
SHI 3.1.23 — Home Values and Inflation

SHI 2.22.23 — Scary Pictures
February 22, 2023
SHI 3.8.23 — Snail Tracks
March 8, 2023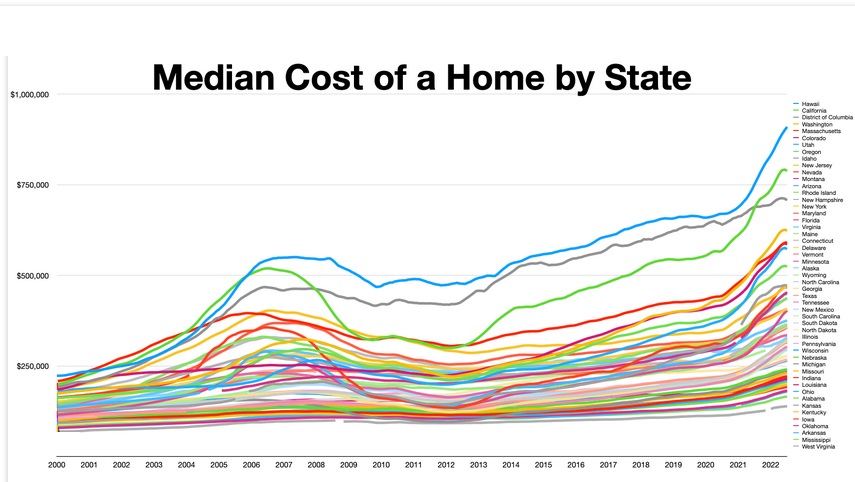
The FED has never raised rates faster. Fixed rate home loans remain around 7%. Have US home prices collapsed?
No. In fact, Tuesday we learned the latest Case-Shiller index was up: “The S&P CoreLogic Case-Shiller U.S. National Home Price NSA Index, covering all nine U.S. census divisions, reported a 5.8% annual gain in December.”
“
What? Home values are UP?”
“
What? Home values are UP?”
No. As a matter of fact, they are not. Values have generally declined. The above quote is another great example of how the media often spins data, telling a very different story that what is factual.
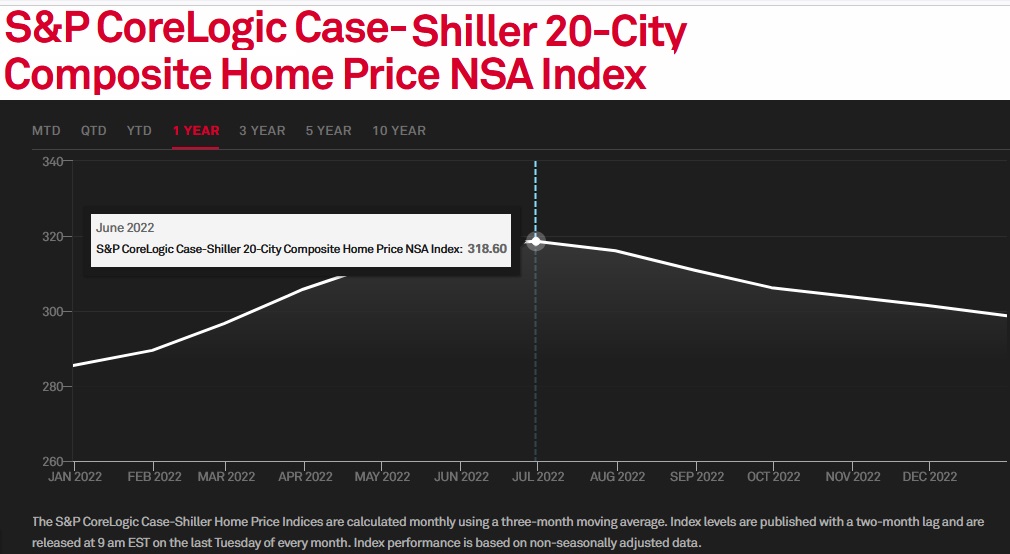
Nationally, the C-S Index actually shows home values are down from their peak. Below, you’ll see that after the index reached a near-term high of 318.60 in June of last year, by December that reading had tumbled down to 298.70. That is a value decline of over 6%. While the US economy as a whole may have avoided a FED-induced recession thus far, clearly residential real estate has not. Housing markets are deep in recession. Home purchase-mortgage demand is at a 28-year low.
On the other hand, things could be a lot worse.
Welcome to this week’s Steak House Index update.
If you are new to my blog, or you need a refresher on the SHI10, or its objective and methodology, I suggest you open and read the original BLOG: https://www.steakhouseindex.com/move-over-big-mac-index-here-comes-the-steak-house-index/
Why You Should Care: The US economy and US dollar are the bedrock of the world’s economy.
But is the US economy expanding or contracting?
Expanding. At the end of Q3, 2022, in ‘current-dollar’ terms, US annual economic output rose to $25.74 trillion. Thru Q3, America’s current-dollar GDP has increased at an annualized rate exceeding 7%. The world’s annual GDP rose to over $100 trillion during 2022. America’s GDP remains around 25% of all global GDP. Collectively, the US, the euro zone, and China still generate about 70% of the global economic output. These are the 3 big, global players.
The objective of this blog is singular.
It attempts to predict the direction of our GDP ahead of official economic releases. Historically, ‘personal consumption expenditures,’ or PCE, has been the largest component of US GDP growth — typically about 2/3 of all GDP growth. In fact, the majority of all GDP increases (or declines) usually results from (increases or decreases in) consumer spending. Consumer spending is clearly a critical financial metric. In all likelihood, the most important financial metric. The Steak House Index focuses right here … on the “consumer spending” metric. I intend the SHI10 is to be predictive, anticipating where the economy is going – not where it’s been.
Taking action: Keep up with this weekly BLOG update. Not only will we cover the SHI and SHI10, but we’ll explore “fun” items of economic importance. Hopefully you find the discussion fun, too.
If the SHI10 index moves appreciably -– either showing massive improvement or significant declines –- indicating growing economic strength or a potential recession, we’ll discuss possible actions at that time.
The Blog:
To repeat: In the aggregate, unsurprisingly US home values have declined from their peak in the middle of 2022.
It’s entirely possible your home has not lost value. Home values are very “local” — that is to say they are most impacted by supply, economic, and demographic trends unique to your location. So “one size fits all” clearly does not apply in the housing marketplace. And one-size-fits-all is a good description of the C-S Index:
But at a high level, the trend above is clear. Values are down from their peak.
But not as much as in Sydney, Australia, measured by that same C-S Index. While Case-Shiller assures us home values across Australia are down an aggregate 8.4% since May of 2022, values in Sydney are down about 13% during that same period. However, over in Perth, the value drop is only 0.7%. I’ll repeat: Home values are local.
Why are home values dropping in Australia?
For the same reason they are falling in the United States: Interest rate hikes. Australia’s central bank increased their overnight funds rate by 300-basis point during that same period. But it’s important to keep recent value declines in perspective: Across Australia, home values increased an eye-popping 28.9% between September 2020 and May 2022, which was the fastest rise in home values nationally on record. So, while the current decline is sizable, at the beginning of 2023 home values were still 16% higher than five years ago, and almost 60% higher than 10 years ago.
Back here in America, “The cooling in home prices that began in June 2022 continued through year end, as December marked the sixth consecutive month of declines for our National Composite Index,” says Craig J. Lazzara, Managing Director at S&P DJI. However, he wanted to be clear that home prices were still up 5.8% in 2022 … and this is above and over the 18.9% increase in 2001. So while the froth in home value increases has subsided, home values over the past decade are up significantly across all developed nations.
In fact, the US home price index is up over 70% in the past 10 years. Very similar, it turns out, to Australia.
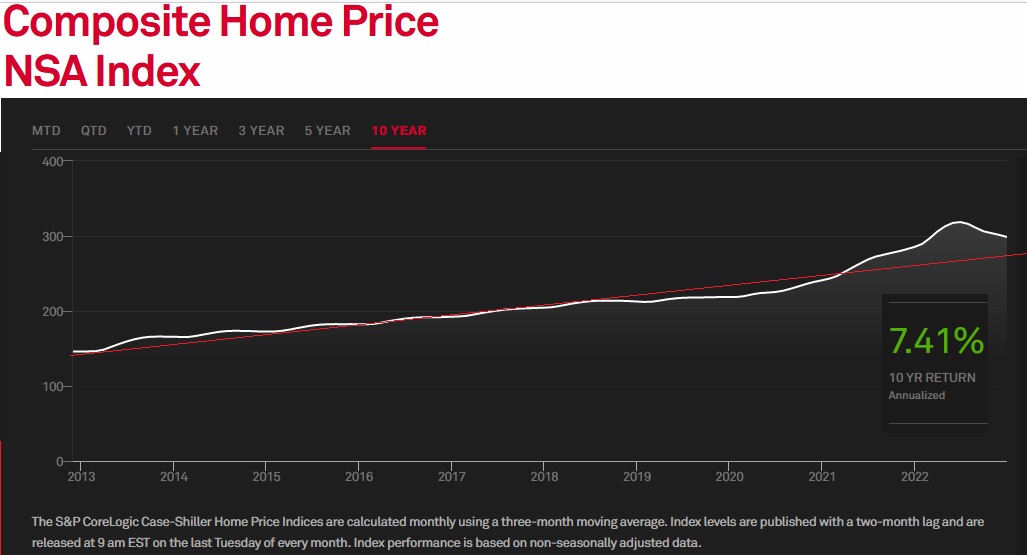
A 7.41% annual “return on investment” is nothing to sneeze at. Case-Shiller provided the graph above; I added the red line … which has been trending up at about 7% or so each year for the past 10 years. Impressive.
Economic statistics, I would argue, are an interesting thing. For example, as we see above, the average annual ‘return’ for owning a home over the prior 10 years was 7.41%. However, leveraged by 50% — and as we know, most homeowners use even more leverage — the math equates to an almost 15% annual ROI. Even more impressive.
This is why owning a home is viewed as an excellent hedge against inflation. If you asked 100 homeowners, “Is home ownership a good hedge against inflation?,” I suspect close to 100 would answer with a resounding yes! But travel back in time 500 years and I suspect that 100 people would reply, “What’s inflation?”
Because inflation is a relatively new thing. In fact, here in the United States, consistent, year-over-year inflation is actually a post-WWII phenomenon. Consider this image courtesy of Yardeni Research:
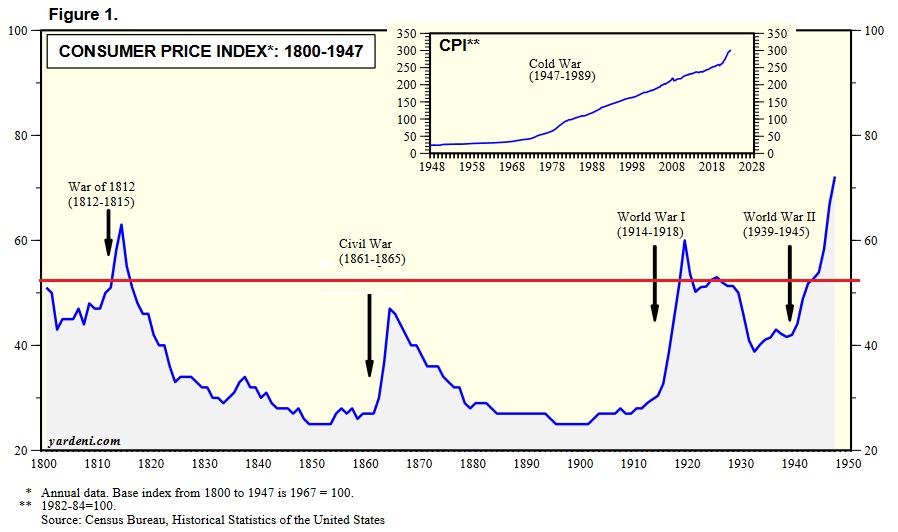
I added the red line in the graphic above. The balance is Yardeni’s. The larger ‘image’ shows a 150-year history of the CPI between 1800 and 1950, while the smaller box in the top-right picks up the action from 1948. Since 1800, historically speaking, inflation was generally a war-only phenomenon. That’s easy to understand given how war causes massive disruptions, resource demands, demographic issues, and supply chain problems. But if we ignore the peaks and valleys with an approximate regression line (the red line), we see relatively no real inflation for 150 years.
And, in fact, CPI inflation remained relatively muted until around 1970. Did something “change” in 1970 to trigger a more durable inflation? Yes, but I’ll get back to this question later.
For many hundreds of years, world economies experienced zero, or near zero, inflation. For example, according to the central bank of Norway, Norges Bank, research suggests that between 1630 and 1700, prices rose by an average of only 0.3% per year. And the longest recent period of European “price stability” was between 1842 and 1914 — when WWI began — during which prices rose by only 0.6% per year. Contrast this outcome with the hyperinflation during the Napoleonic Wars when inflation reached 152% in 1812 in Europe — and similar here in the US.
From the Economist Magazine: “In England in 1500 the price of a standard basket of goods facing consumers (largely food, but including other things such as clothing and light) was no higher than it had been in 1275, suggests work by Gregory Clark, a historian, and researchers at the Bank of England.”
Apparently, this changed after 1500. For the first time in centuries (absent war) durable price inflation, became the norm. Unstoppable. Within 50 years average prices across England had doubled.
The article continued, “Before long Italian prices were rising by 5% a year, research by Paul Schmelzing of Boston College suggests. In France and Holland, inflation hit 4% by the end of the century. In Russia the inflationary trend picked up from the 1530s. The global rate of inflation peaked in the 1590s at close to 3% a year. If 3% does not sound too painful, bear in mind that growth in nominal incomes in a pre-capitalist world was basically zero: almost any level of inflation made people poorer.” Any inflation in any amount must have been a staggering burden for the common man.
Before inflation became a recurring theme, royalty often leased their plots of land with fixed rents for as long as 99 years. That’s right: the annual rent was identical every year for 99 years. The idea of an annual “CPI increase” clause was unthinkable — and not even thought of.
What was the trigger? What changed in the early 1500s, setting of the vicious cost increase cycle?
Theories abound. World population had been crushed by the plague known as the ‘Black Death.’ By 1350, about 1/3 of the worlds population had died. Over the next 150 years, populations rebounded. Population growth probably triggered demand growth, which may have contributed to the change.
However, many economists believe the trigger rests with King Henry VIII. Apparently, Henry “debased” England’s currency. In the 1540s he authorized taking one gold coin, melting it down, adding worthless metal, and then recasting it as two “golden” coins. A two-for-one trick which doubled in value in the royal treasury. As a result, Henry was able to spend lavishly wars and houses — commonly known as palaces. 🙂
Unfortunately, eventually the common folk caught on. The boost in demand eventually caused merchants to raise their prices. Then Scotland joined the party — doing essentially the same thing. Followed by the “southern Lowlands” — today’s Netherlands, Belgium and Luxembourg — where silver coinage was debased 12 times from 1521 to 1644.
Was debasement the primary cause … or simply one more piece of straw on the proverbial camel’s back? It’s hard to say with any certainty. It’s known that France debased its silver coins 123 times between 1285 and 1490, causing no inflation. So the answer is probably more complex than simple than currency debasement.
But now it’s time to answer the question above: Did something “change” in 1970 to trigger a more durable inflation?
Yes. I’ll let Wikipedia explain the event in totality (right click, open in new tab):
https://en.wikipedia.org/wiki/Nixon_shock
No, I’m not advocating a return to the gold standard. I’m only suggesting that the inflationary cycle of the prior 50-years is the result, to some extent, of a continuous currency debasement. US money supply has exploded since 1959:
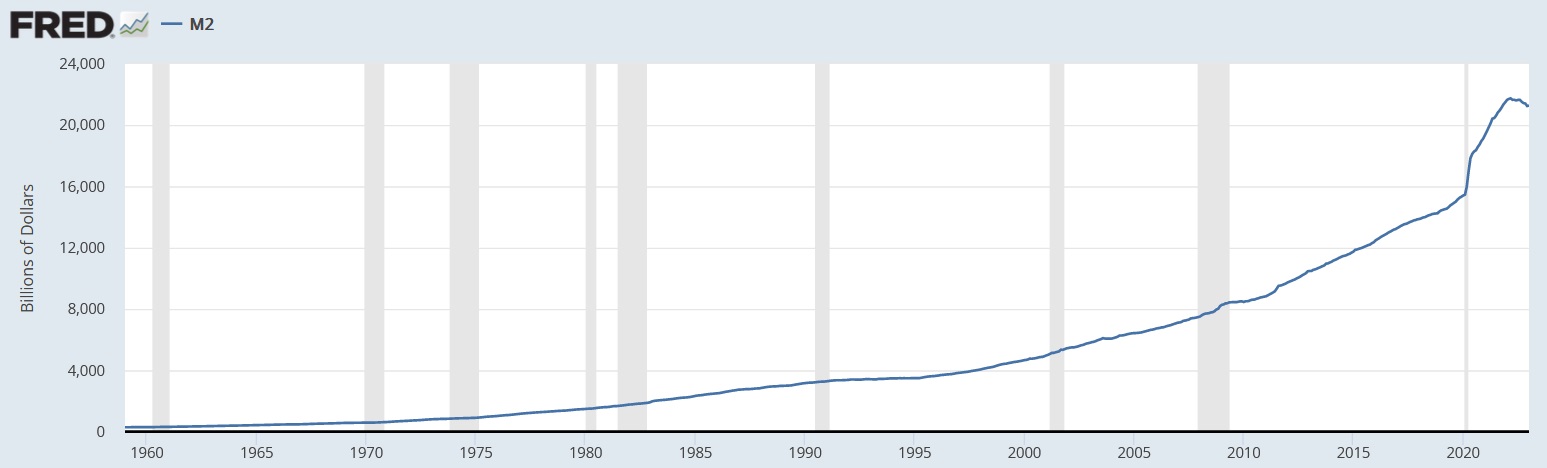
While M2 growth has tailed off lately (another story for another time), M2 today equals 21.2 thousand billion dollars. You read that correctly. Over $21 trillion. Back in 1959, M2 equaled about $287 billion. These are some big numbers … so let me make the concept a little easier to grasp. Since 1959, the US money supply known as M2 has increased almost 74X. In percentage terms, M2 is about 73,900% higher today than it was in 1959.
OK, once again, this fact does not easily explain systemic inflation here and abroad. The entire economic picture is very complex. But I believe this is a foundational contributor to today’s structural inflation issue.
Bottom line: I suggest you accept the fact that inflation is now a fact of life. This will not change in the years to come. Expect it.
At issue, then, is the annual rate of inflation, but inflation itself is now a foundational economic principal of our modern society. Even at the FED‘s annual ‘target rate’ of 2%, the cost of all things will increase by 20% every 10 years.
Keep this in mind as you plan your retirement income. Assuming you plan to be “retired” for 30 years, the cost of things 30 years hence will likely be at least 60% higher than when you retired. Worth thinking about, right?
Let’s head to the steak houses where your favorite cut costs a lot more today than a few years ago. How is reservation demand holding up in our most expensive of eateries?
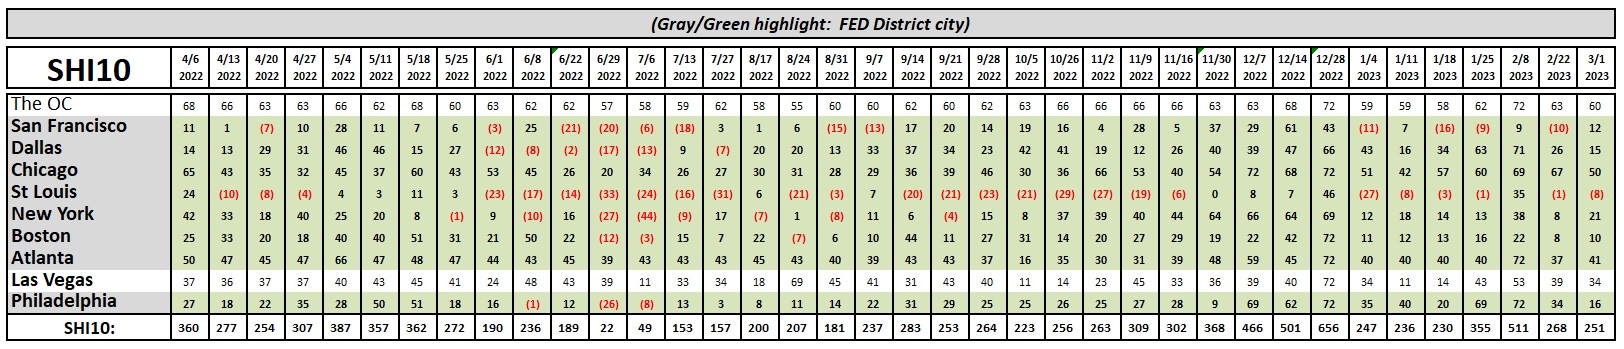
Just fine. Almost no change from last week … or earlier in the year.
So, once again, we have to ask the question: Is a recession coming? The SHI says no.
But conventional thinking suggests the FEDs actions are likely to cause a recession…and we haven’t seen one yet due to the lag effect. Perhaps. But I remain unconvinced. Thus far, data suggests a stable or even growing GDP. Post-Covid and post-historic fiscal stimulus, these are anything but conventional times.
<:> Terry Liebman


