
SHI 5.12.21 – US Household Debt JUMPS

SHI 5.5.21 – GDP on Steroids
May 5, 2021
SHI 5.19.21 – The Kinetic Inflation Roller Coaster
May 19, 2021
In fact, a number of economic variables have really popped. Significantly. We will discuss a few below. But like most news headlines today, the one I’ve posted above is misleading.
“
Household debt increased $85 billion in 2021 Q-1.“
“Household debt increased $85 billion in 2021 Q-1.“
Sounds scary right? Well don’t be frightened.
Because while the data point is accurate, it tells only a small part of the real story, rendering the headline implication to be quite inaccurate. When we take a peek “under the hood” so to speak, we see that in Q-1 mortgage balances increased by $117 billion while credit card balances declined by $49 billion — the second largest credit card balance decline in the history of this data series. When was the largest decline you ask?
During the second quarter of 2020. American credit card balances declined by $76 billion that quarter. Combined, credit card balances are $157 billion lower than at the end of 2019. Is this number statistically significant? Absolutely: Outstanding credit card balances are down almost 17% from 2020 levels. This has never happened before.
Bottom line … Americans are paying off their most expensive debt as many take on mortgage debt to purchase new homes. This is a good thing!
Welcome to this week’s Steak House Index update.
If you are new to my blog, or you need a refresher on the SHI10, or its objective and methodology, I suggest you open and read the original BLOG: https://www.steakhouseindex.com/move-over-big-mac-index-here-comes-the-steak-house-index/
Why You Should Care: The US economy and US dollar are the bedrock of the world’s economy.
But is the US economy expanding or contracting?
The short answer? Expanding. A lot. Forever more, COVID-19 will be mentioned concurrently with any discussion about 2020 GDP. Collectively, the world’s annual GDP was about $85 trillion by the end of 2020. But I am confident all 2021 GDP discussions will start with a nod to the blowout 1st quarter GDP growth number, because our ‘current dollar’ GDP grew at the annual rate of 10.7%! Annualized, America’s GDP blew past $22 trillion during the quarter, settling in at $22.0489 trillion. The US, the euro zone, and China continue to generate about 70% of the global economic output.
The objective of this blog is singular.
It attempts to predict the direction of our GDP ahead of official economic releases. Historically, ‘personal consumption expenditures,’ or PCE, has been the largest component of US GDP growth — typically about 2/3 of all GDP growth. In fact, the majority of all GDP increases (or declines) usually results from (increases or decreases in) consumer spending. Consumer spending is clearly a critical financial metric. In all likelihood, the most important financial metric. The Steak House Index focuses right here … on the “consumer spending” metric. I intend the SHI10 is to be predictive, anticipating where the economy is going – not where it’s been.
Taking action: Keep up with this weekly BLOG update. Not only will we cover the SHI and SHI10, but we’ll explore related items of economic importance.
If the SHI10 index moves appreciably -– either showing massive improvement or significant declines –- indicating growing economic strength or a potential recession, we’ll discuss possible actions at that time.
The Blog:
To finish off the debt conversation, here’s a current summary, courtesy of the New York FED:
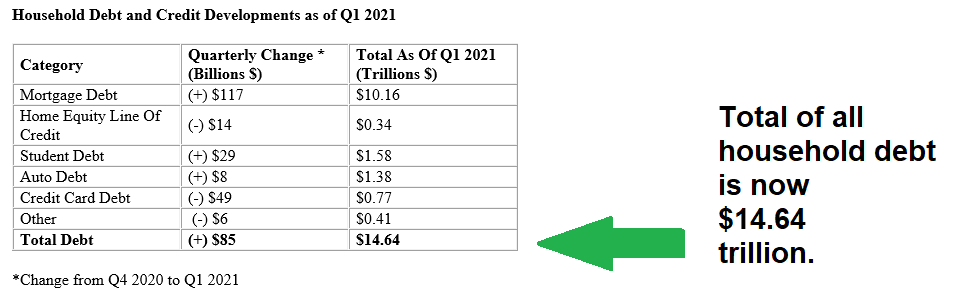
With all the home-buying activity, it’s not surprising mortgage debt up. The numbers also suggest Americans are financing new car purchases.
But credit card debt is down. Way down. And since the average credit card interest rate, according to the FED was 16.28% in 2020, this means American consumers have reduced 2021 interest costs by over $25 billion per year, every year. By comparison, what is the average interest rate on home loan debt? 2.98%, according to S&P Global.
Here’s something else that jumped last month: Job openings are WAY UP!
Per the US Bureau of Labor Statistics:
“On the last business day of March, the job openings level reached a series high of 8.1 million (+597,000)”
The job openings series began in December 2000. This is the highest mark ever recorded. As of this latest report, business are looking to hire 8.1 million people.
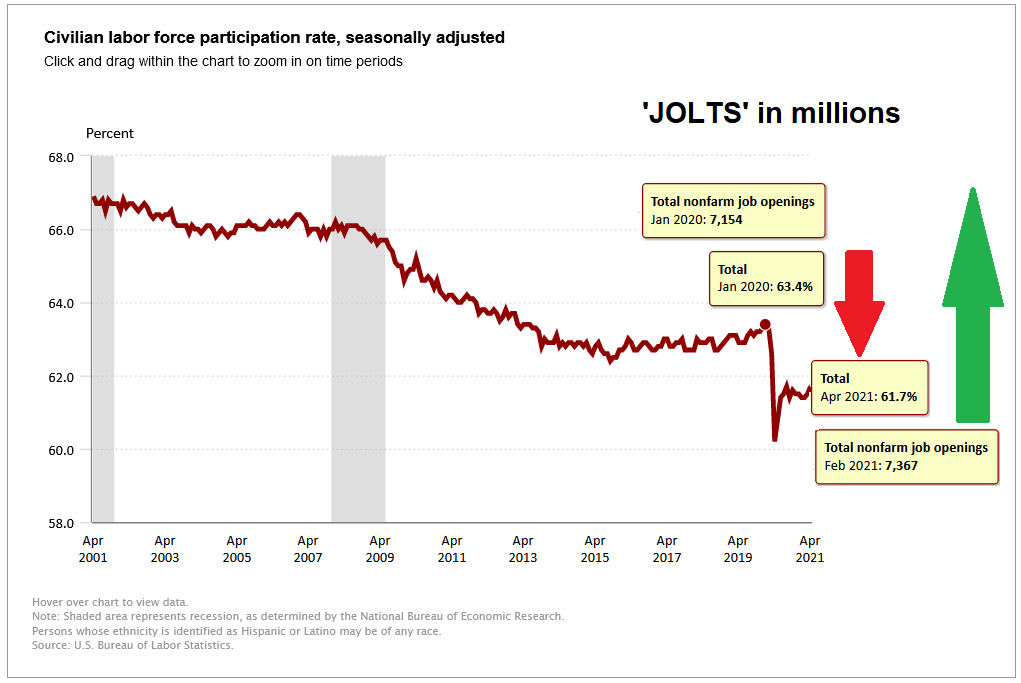
At the same time, the ‘labor force participation rate’ — the percentage of Americans in the labor force that are actually hunting for a job — is down to 61.7%. Back in January of 2020, the number was quite a bit higher — almost 2% higher. You may recall that the US labor force is right around 150 million. So a 2% swing is meaningful.
Summarizing: Business are looking to hire more people than ever. Yet more people are quitting the labor force. Why? Retirement and child care issues are often quoted as culprits. But we have to wonder if the supplemental federal unemployment benefit of $300 per week — paid on top of state unemployment benefits — is having an impact. The economic Nobel laureate Paul Krugman says ‘no.’ Paying people to not work has nothing to do with it. I’m not so sure. But, on the other, I’m also not the owner of a Nobel prize. So Paul is probably right. 🙂
Finally, today’s CPI numbers really jumped, once again triggering fears that the FED cannot adequately control inflation. Numerous times, Powell has assured us inflationary pressures are, and will be, transitory. Meaning the FED expects to see an inflation spike … meaning price increases … but once this higher price plateau is reached, they expect longer-term inflation trends to return to the 2% annual range. Once again, I’m not so sure. But, hey, I don’t have a Ph.D in ‘Economics’ like most of the FOMC members. I’m sure they’re right. 🙂
I jest. I actually believe they will be proven right — over time.
But in the mean time, the numbers are wonky. For example, the April 2021 CPI increase attributable to “shelter” was only 0.4%. And the Y-O-Y increase in “shelter” costs was 2.1% thru April of 2021. Yet we all know the housing market has been on fire. Demand far outstrips supply, and values are WAY up. According to the National Association of Realtors, the most recent Y-O-Y “median price” increase in US home values was 17.2%. Lumber prices have more than tripled in the past year … yet the CPI increase in “commodities” over the last 12 months is a paltry 4.4%. Hmmm….. These numbers make no sense.
My point: This is the wrong time to try to reach conclusions about many economic conditions. The pandemic has caused so much disruption, adversely impacted some many supply chains, intelligent conclusions are hard to come by today.
Except for one. Yep, I’m talking about the SHI. Let’s head to the steakhouses. With Mother’s Day in the rear view mirror, this Saturday’s reservation status should have returned to “normal.” What ever that means. Take a look:

Right. If you want your pick of reservation times this Saturday at an expensive steakhouse, you’d better head to New York or San Francisco. Because in the OC, Dallas, Chicago, and Philly you won’t be sitting down until 8:45 pm at the earliest. Pricey eateries in these cities are almost completely booked thru 9 pm this coming Saturday.
And ‘Vegas appears to remain on fire. Well, the T-Bones and New Yorks are, anyway. Below is a screen shot taken from OpenTable this morning at 11 am:

Not only is the restaurant fully booked on Saturday, look at how many times a reservation was made at Joe’s Seafood as of 11 am. 251 reservations had already been made at Joe’s … and it wasn’t even noon! Staggering.
Here is the longer term report — take a close look:
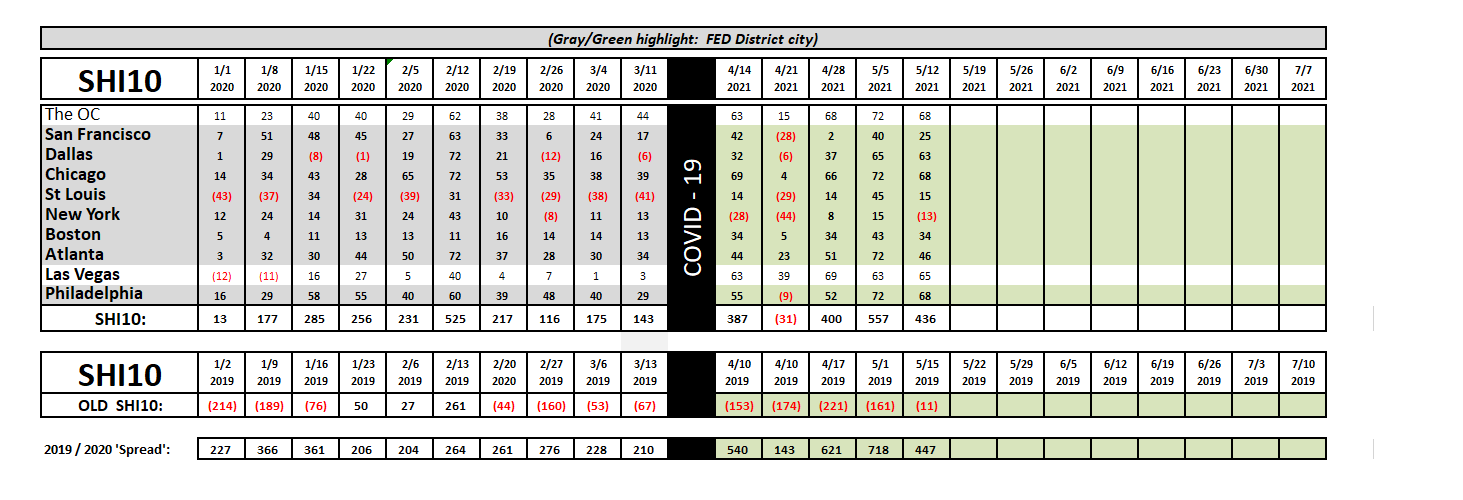
The numbers from SHI are unequivocal: Restaurant demand at the highest dollar steakhouses is off the charts. I see no reason for this to change.
Earlier today about $1 trillion in shareholder value was lopped off the equity markets. (A 2% decline on a collective market cap of $50 trillion.) Clearly investors are concerned. I suspect they are worried about an inflationary spiral’s impact on long-term interest rates, P/E ratios, and the FEDs promise to stay the course.
Does today’s CPI report portend an inflationary spiral? It’s hard to say. The numbers are wonky. Clearly prices of many things — houses, copper, lumber, etc. — are way up. But none of these things are tracked by the CPI. Further, in the report itself was this disclaimer:
“Coronavirus Pandemic Impact on April 2021 Consumer Price Index Data: Data collection by personal visit for the Consumer Price Index (CPI) program has been suspended since March 16, 2020. When possible, data normally collected by personal visit were collected either online or by phone. Additionally, data collection in April was affected by the temporary closing or limited operations of certain types of establishments. These factors resulted in an increase in the number of prices considered temporarily unavailable and imputed.”
Unavailable or imputed!?! Meaning when the BLS couldn’t get the actual number, they just made one up. Hilarious!
My advice: For now, take all economic numbers with a grain of salt. Except for the SHI, of course. That one is spot on! 🙂
- <> Terry Liebman


