
SHI 5.26.21 – The $8 Trillion Man

SHI 5.19.21 – The Kinetic Inflation Roller Coaster
May 19, 2021
SHI 6.2.21 – Where’s the Beef?
June 2, 2021
Under Powell’s leadership, the FED balance sheet has grown to almost $8 trillion. Permit me to put that number into perspective: In 2007, before the “Great Recession”, the FED had about $800 billion in total assets. Today’s balance is a 10X increase. Staggering. And perhaps a little frightening.
However, depending on your point of view, the massive FED balance sheet has a silver lining. What, you ask? The US Treasury is makin’ bank! Lot’s of it! In fact, over the next decade, they could rake in about $1 trillion! Cool beans!
“
The upside from the bloated FED balance sheet …“
“The upside from the bloated FED balance sheet …“
This is a rarely discussed financial benefit to the US, the direct result from the incredibly large FED balance sheet. The FED might pay about $1 trillion to the Treasury, and by extension, the US tax payer, over the next 10 years. How does this work?
Welcome to this week’s Steak House Index update.
If you are new to my blog, or you need a refresher on the SHI10, or its objective and methodology, I suggest you open and read the original BLOG: https://www.steakhouseindex.com/move-over-big-mac-index-here-comes-the-steak-house-index/
Why You Should Care: The US economy and US dollar are the bedrock of the world’s economy.
But is the US economy expanding or contracting?
The short answer? Expanding. A lot. Forever more, COVID-19 will be mentioned concurrently with any discussion about 2020 GDP. Collectively, the world’s annual GDP was about $85 trillion by the end of 2020. But I am confident all 2021 GDP discussions will start with a nod to the blowout 1st quarter GDP growth number, because our ‘current dollar’ GDP grew at the annual rate of 10.7%! Annualized, America’s GDP blew past $22 trillion during the quarter, settling in at $22.0489 trillion. The US, the euro zone, and China continue to generate about 70% of the global economic output.
The objective of this blog is singular.
It attempts to predict the direction of our GDP ahead of official economic releases. Historically, ‘personal consumption expenditures,’ or PCE, has been the largest component of US GDP growth — typically about 2/3 of all GDP growth. In fact, the majority of all GDP increases (or declines) usually results from (increases or decreases in) consumer spending. Consumer spending is clearly a critical financial metric. In all likelihood, the most important financial metric. The Steak House Index focuses right here … on the “consumer spending” metric. I intend the SHI10 is to be predictive, anticipating where the economy is going – not where it’s been.
Taking action: Keep up with this weekly BLOG update. Not only will we cover the SHI and SHI10, but we’ll explore related items of economic importance.
If the SHI10 index moves appreciably -– either showing massive improvement or significant declines –- indicating growing economic strength or a potential recession, we’ll discuss possible actions at that time.
The Blog:
Last week, the Federal Reserve Bank of New York (“NY FED“) published their annual report on 2020 “open market operations” — which essentially is the FED buying and and/or selling of FED assets. Of course, they would describe this a bit differently. The NY FED said the report “describes open market operations of the Federal Reserve System and other policy actions related to monetary policy implementation for the calendar year 2020.” Right.
Anyway, I’m sure you’re chomping at the bit to read this riveting and scintillating 82 page report. No? I can’t say I blame you. But that’s why you read my blog, right? Because YOU know that I will read it and share the important stuff. So let me summarize:
<|> “Federal Reserve Notes:” another name for ‘cash,’ exploded during 2020. Cash in circulation increased by $281 billion to a level slightly over $2 trillion. (Typical annual cash growth is about $90 billion per year.) This is important, as this fact, once again, illustrates the phenomenal liquidity flowing thru our economic system today.
<|> SOMA holdings — another term for FED balance sheet assets — reached almost $7 trillion by the EOY 2020. It’s worth noting that the FED balance sheet, as of May 20 of this year, is now up to $7.922 trillion. That’s right. Just shy of $8 trillion.
<|> Forecast: The NY FED is projecting the FED balance sheet will reach $9 trillion by the end of 2021.
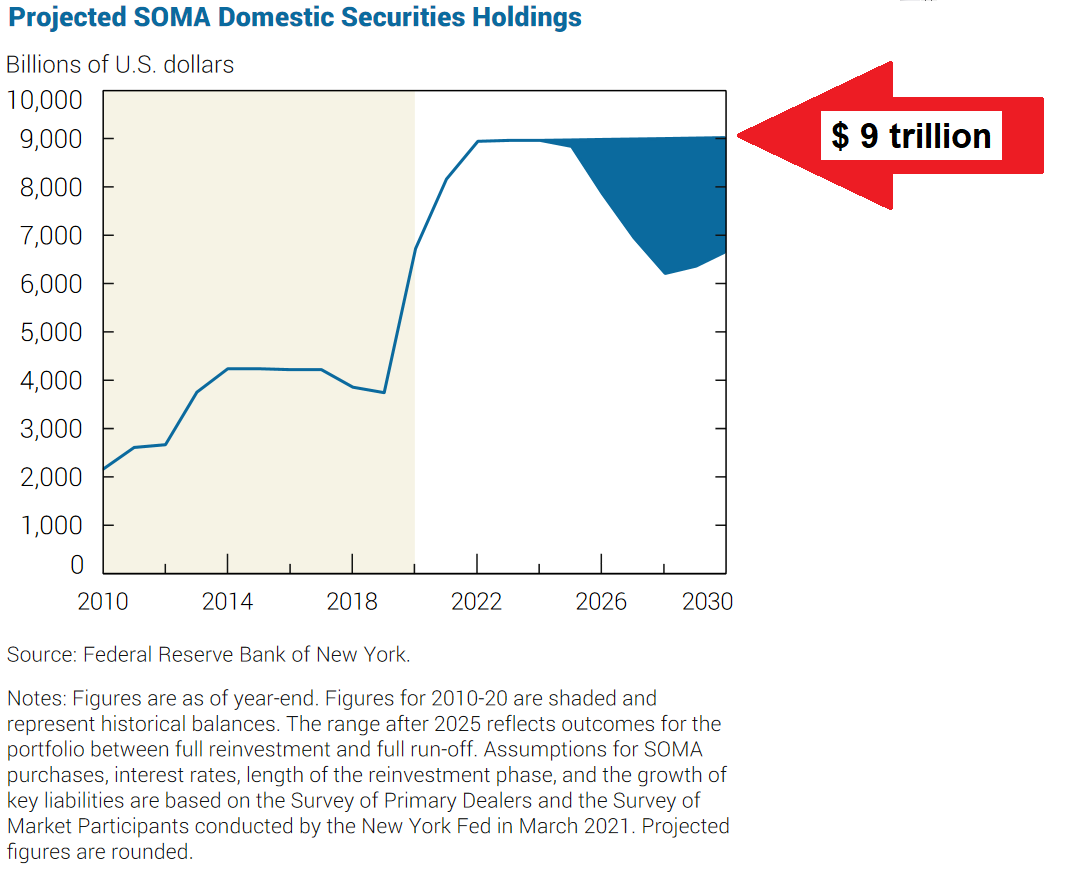
That’s a lot of trillions. You may have noticed the NY FED expects a ‘ceiling’ of $9 trillion at the end of this year? That sounds about right, in that they are accumulating new assets of about $120 billion per month. And thereafter, beginning in 2022, depending on economic conditions, they plan to either maintain assets at $9 trillion, or possibly reduce holdings, depending on economic conditions. I think they will maintain the balance … but I’ll discuss this more in a future blog.
How does this all translate into cash for the US Treasury?
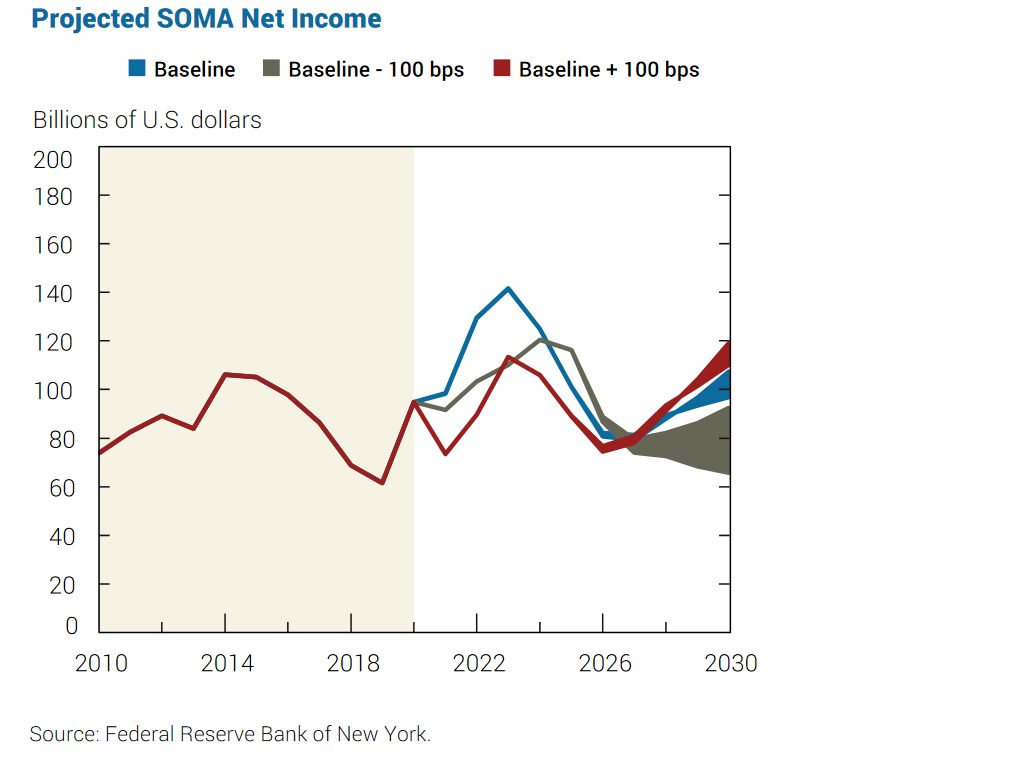
Here’s how it works: From its holdings, in 2020 the FED generated a gross income of $103 billion, and a net income of $95 billion. FED income was primarily from interest on the almost $7 trillion of assets it held during 2020. In fact, only about $2 billion earned in 2020 was not interest income. So, summarizing and repeating, the FED earned about $101 billion in interest income. Are you wondering about their corresponding interest cost — you know, the cost of borrowing the almost $7 trillion — that the FED paid? Well, the short answer is zero. None. In fact, their “interest expense” was actually negative, as they actually netted about $700 million on investments. Amazing. 🙂
From the report:
“The Federal Reserve remits excess earnings to the U.S. Treasury on a weekly basis, after providing for the cost of operations, payment of dividends, and reservation of any amount necessary to maintain aggregate Reserve Bank capital surplus up to a specified limit. The Federal Reserve remitted a total of $89 billion to the Treasury during 2020, an increase from the $55 billion remitted in 2019.”
Big picture, with a balance sheet even bigger than in 2020, close to $100 billion should be paid to the US Treasury in 2021 … and possibly every year for the next decade! Here’s their projection thru 2030:
The Bottom Line: The size of the FEDs balance sheet has many folks worried. The concern mentioned mentioned most often is what happens when the FED begins to either slow, or altogether stop, their asset purchases. in 2013 the FED announced they were planning to slow asset purchases, triggering what was later called the “taper tantrum”, resulting in significant rate spikes. Clearly, the financial markets are concerned about a repeat if and when the FED chooses to shrink their balance sheet. By the forecast above, this might begin in 2024. Or it might not. The FED may choose to leave their asset levels unchanged. Thru 2030. Or even longer. And if they do, the US Treasury will be the biggest benefactor. 🙂
Shall we head to the steakhouses and check on the SHI10? Here’s this week’s chart:
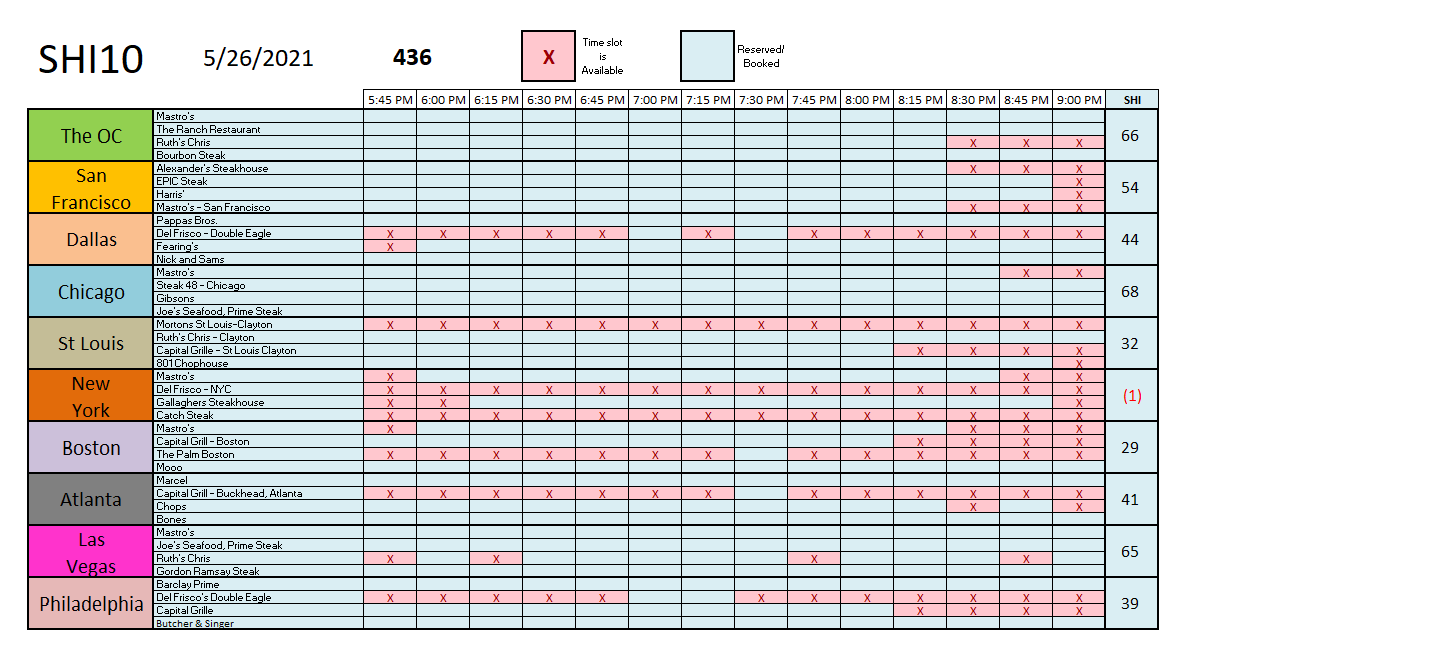
Once again, restaurant reservations are in high demand for this coming Saturday. New York remains the ‘softest’ market … but San Francisco has come back quickly — no expensive steak reservations are available before 8:30. Wow. An SHI40 reading of 436 is very strong, as we all know, and is indicative of a booming US economy. Here’s the longer term trend report:
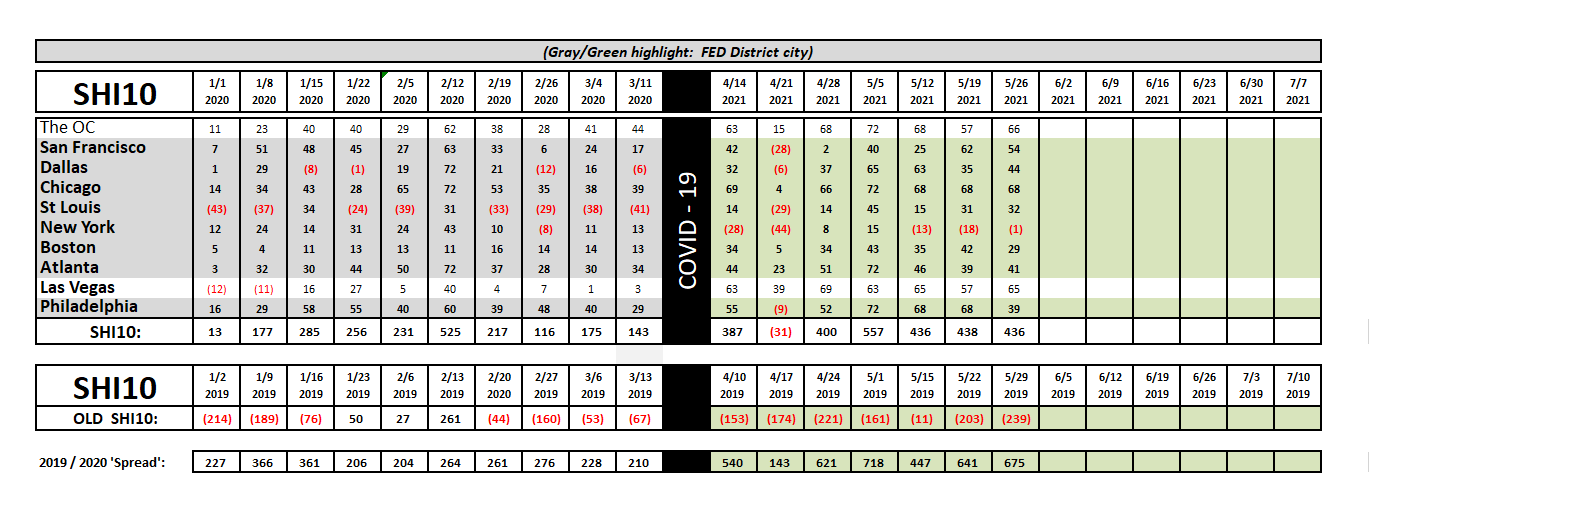
Steaks are flying off the grill. Demand is sizzling … and quite likely, the US economy is doing the same. While no one actually knows what the future holds, all indicators suggest this is the time to carefully consider all investment options and take intelligent risks. You decide what “intelligent” means … but the signs suggest it’s time to be “risk on.” Good luck out there. 🙂
<|> Terry Liebman


