SHI 6.14.23 — Nextbite?

SHI 6.7.23 — On Ice
June 7, 2023
SHI 6.28.23 — Here … Kitty, Kitty, Kitty!
June 28, 2023
It pays to look over your shoulder now and then.
This is not a food blog, but with a name like the Steak House Index, inevitably food must be a foundational theme. And so when I found this tasty little morsel of a headline in one of my news-feeds, I just had to share:
“Nextbite acquired by competitor ….”
The question of “who is Nextbite?” isn’t overly meaningful for this blog, but it is interesting and a bit fun. We all know many of their entertaining and tasty brands: ‘Packed Bowls by Wiz Khalifa,’ ‘Shawarmama,’ Nestle Toll House Cookies, IHOP, Thrilled Cheese, and Nathan’s Famous … and the list goes on. “Thrilled cheese?” Schwarmama? Awesome.
And how can one not love their company name? But, alas, as they have now been acquired, the image above seemed appropriate. They are gone. Eaten. I don’t know if the acquisition was hostile or friendly — I suspect friendly — but the acquisition and the image above are a good reminder for all us to keep our eyes open, know what’s going on around us, and we should all look back over our shoulder now and then. Your economic survival could depend on it! This is not just paranoia talking … something may be planning to eat you!
“
The FED left rates unchanged.”
“The FED left rates unchanged.”
Perhaps nothing wants to eat you, personally, but this is the inherent nature of America’s capitalist system. It’s been said “its a dog-eat-dog world out there” and I don’t think we’re talking about hotdogs. Consider recent developments in San Francisco. If you’ve missed the media reports, their downtown city-center is struggling; and, in the recent past a number of very large marquis retail and hotel properties have failed. We’ve all read about office towers selling for pennies on the dollar. This week, one hotel group stopped mortgage payments on debt (I believe) exceeding $1 billion. They are perfectly willing to lose the properties in foreclosure. The (previously) billion-dollar retail mall owner — Westfield — simply handed the lender their keys to the front door, saying “Bye. It’s yours. We don’t want it any more.” They will likely incur a write-down of over $500 million.
My point? It’s tough out there. Financial and economic data is all over the map. What “worked great” pre-pandemic may not be working today. And predicting the future is dangerous, given the level of turbulence.
Which is probably why the FED decided to pause today. No rate hike. They decided to forgo their ‘next bite’ into the US economy. (See what I did there?) 🙂 For context, it’s worth noting this is the first pause by the FED since March 16th of last year. Today, eight (8) rate hikes later, the FED left rates unchanged following today’s FOMC meeting.
Does this mean the rate hikes are over? Great question.
Welcome to this week’s Steak House Index update.
If you are new to my blog, or you need a refresher on the SHI10, or its objective and methodology, I suggest you open and read the original BLOG: https://www.steakhouseindex.com/move-over-big-mac-index-here-comes-the-steak-house-index/
Why You Should Care: The US economy and US dollar are the bedrock of the world’s economy.
But is the US economy expanding or contracting?
Expanding. Even as the FED rapidly raises rates! At the end of Q4, 2022, in ‘current-dollar’ terms, US annual economic output rose to an annualized rate of $26.14 trillion. During 2022, America’s current-dollar GDP increased at an annualized rate exceeding 9%. No wonder the FED is so concerned, right? The world’s annual GDP rose to over $100 trillion during 2022. America’s GDP remains around 25% of all global GDP. Collectively, the US, the euro zone, and China still generate about 70% of the global economic output. These are the 3 big, global players.
The objective of this blog is singular.
It attempts to predict the direction of our GDP ahead of official economic releases. Historically, ‘personal consumption expenditures,’ or PCE, has been the largest component of US GDP growth — typically about 2/3 of all GDP growth. In fact, the majority of all GDP increases (or declines) usually results from (increases or decreases in) consumer spending. Consumer spending is clearly a critical financial metric. In all likelihood, the most important financial metric. The Steak House Index focuses right here … on the “consumer spending” metric. I intend the SHI10 is to be predictive, anticipating where the economy is going – not where it’s been.
Taking action: Keep up with this weekly BLOG update. Not only will we cover the SHI and SHI10, but we’ll explore “fun” items of economic importance. Hopefully you find the discussion fun, too.
If the SHI10 index moves appreciably -– either showing massive improvement or significant declines –- indicating growing economic strength or a potential recession, we’ll discuss possible actions at that time.
The Blog:
If for some random reason, you are ever forced to take an Econ test, and you’re asked a question like the one I posed above, “Does this mean the rate hikes are over?,” permit me to suggest the answer: Maybe. 🙂
It seems like that’s always the answer in economics. Now that the FED has lifted short-term rates from close to near zero up to 5%, future actions will likely depend on future data. Per Powell and the FED.
But I disagree. As I write this blog today, I’m of the opinion the opinion this ‘pause’ will become a ‘stop.’ I do not anticipate any future rate hikes in this cycle.
That’s a bold statement, right? In light of the fact that ALL but 2 of the FOMC members disagree with me? Take a look at their ‘dot-plot’ forecast released today with the FED‘s decision to leave rates unchanged:
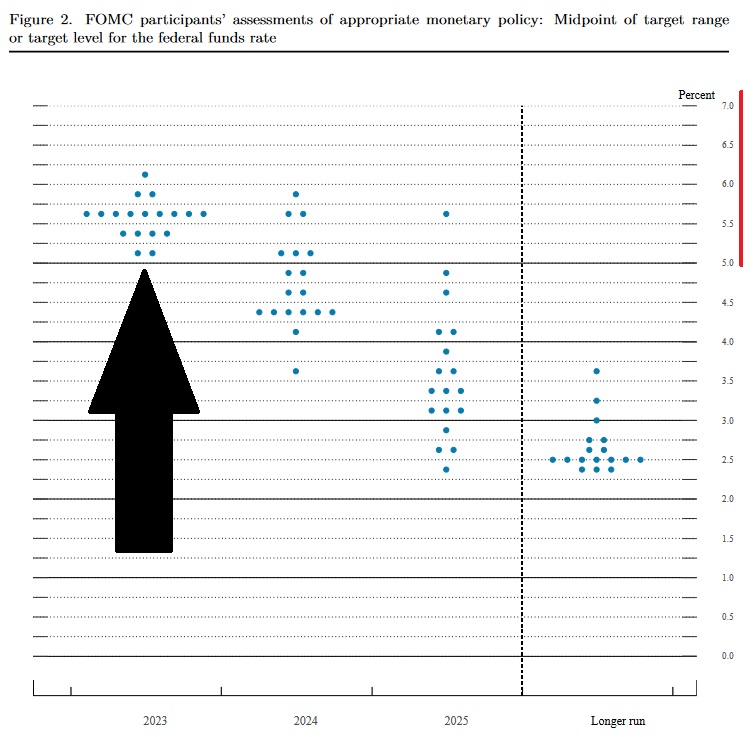
I know the image above my added black arrow looks like a cute little spaceship, but those 18 dots are actually individual voting member future rate forecasts. Like me, only two expect rates to remain static for the rest of 2023. At the other end of the spectrum, two voting members believe the FED funds rate will be closer to 6% by year end … and one believes it will exceed 6%!
I don’t think so. I know the inflation picture is as murky and confusing as everything else, but for a number of reasons I believe inflation will cease to be an issue for the FED in the coming months. Here’s a recent CPI image incorporating data from earlier this week:
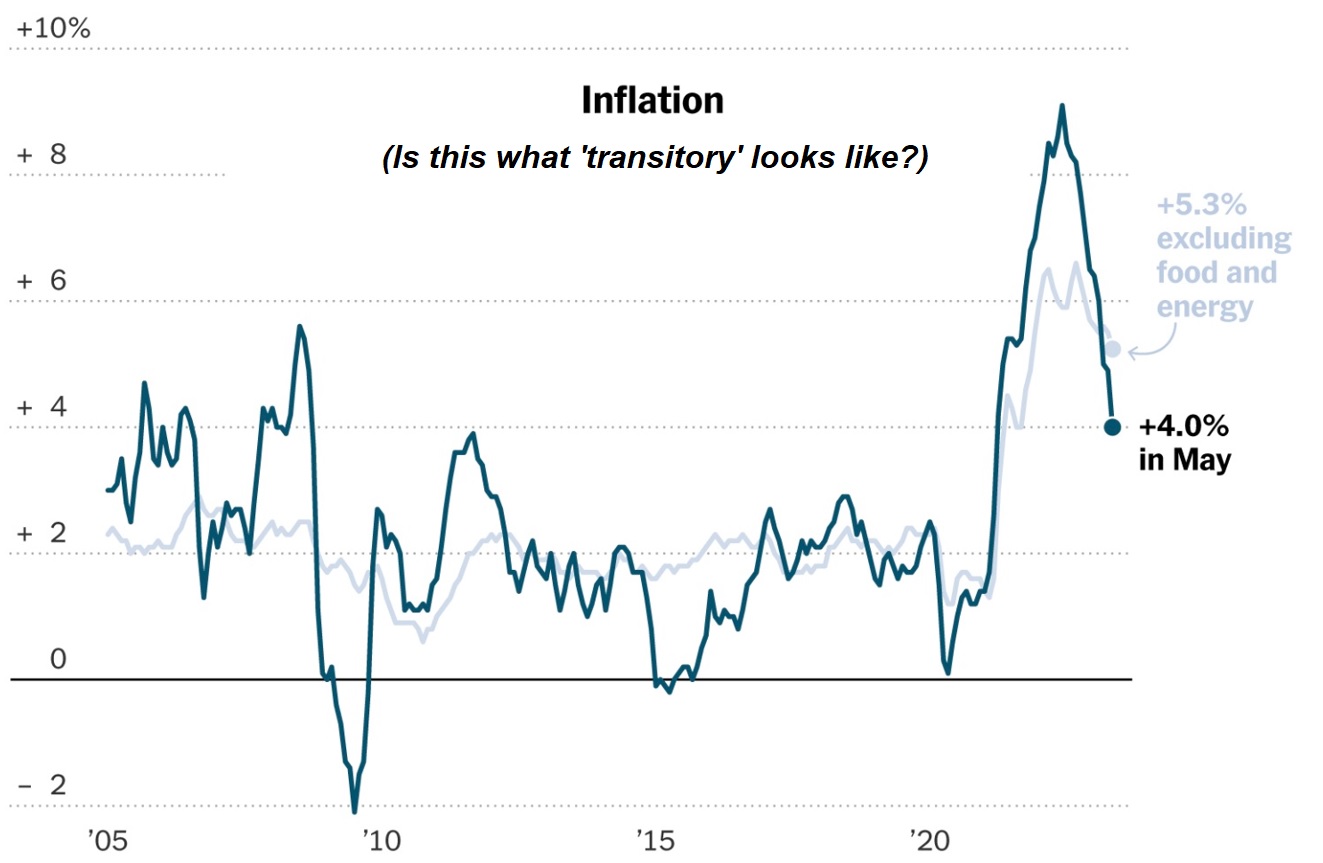
The chart above reminds me of the Himalayas, home of 9 of the 10 world’s highest peaks. That post-pandemic spike — almost straight up and then equally straight down — looks transitory to me. And as “housing” numbers moderate in the next few months, I expect this trend to continue. Sure, the ‘core’ inflation rate remains elevated — perhaps even sticky — but unlike the FED voting members I believe this, too, will moderate in coming months.
Again, I fully understand today’s data is highly conflictive. For example, the metric commonly used to assess the level of money supply — known as ‘M2’ — is shrinking at a precipitive rate. In fact, M2 has not fallen at this speed in almost 100 years — since the early 1930s. Many point to this fact with fear and trepidation, assuring us a massive recession is guaranteed. But I completely disagree. Now, had M2 not swelled by over 30% in the two years following the pandemic — by about $5 trillion — I might be more concerned. But my read is some of that excessive monetary and fiscal stimulus is now simply “burning off.”
And the consumer remains flush with cash. Consider this image, ‘cut’ from the FED‘s quarterly Z.1 report. Take a look and I will decipher the data below. 🙂
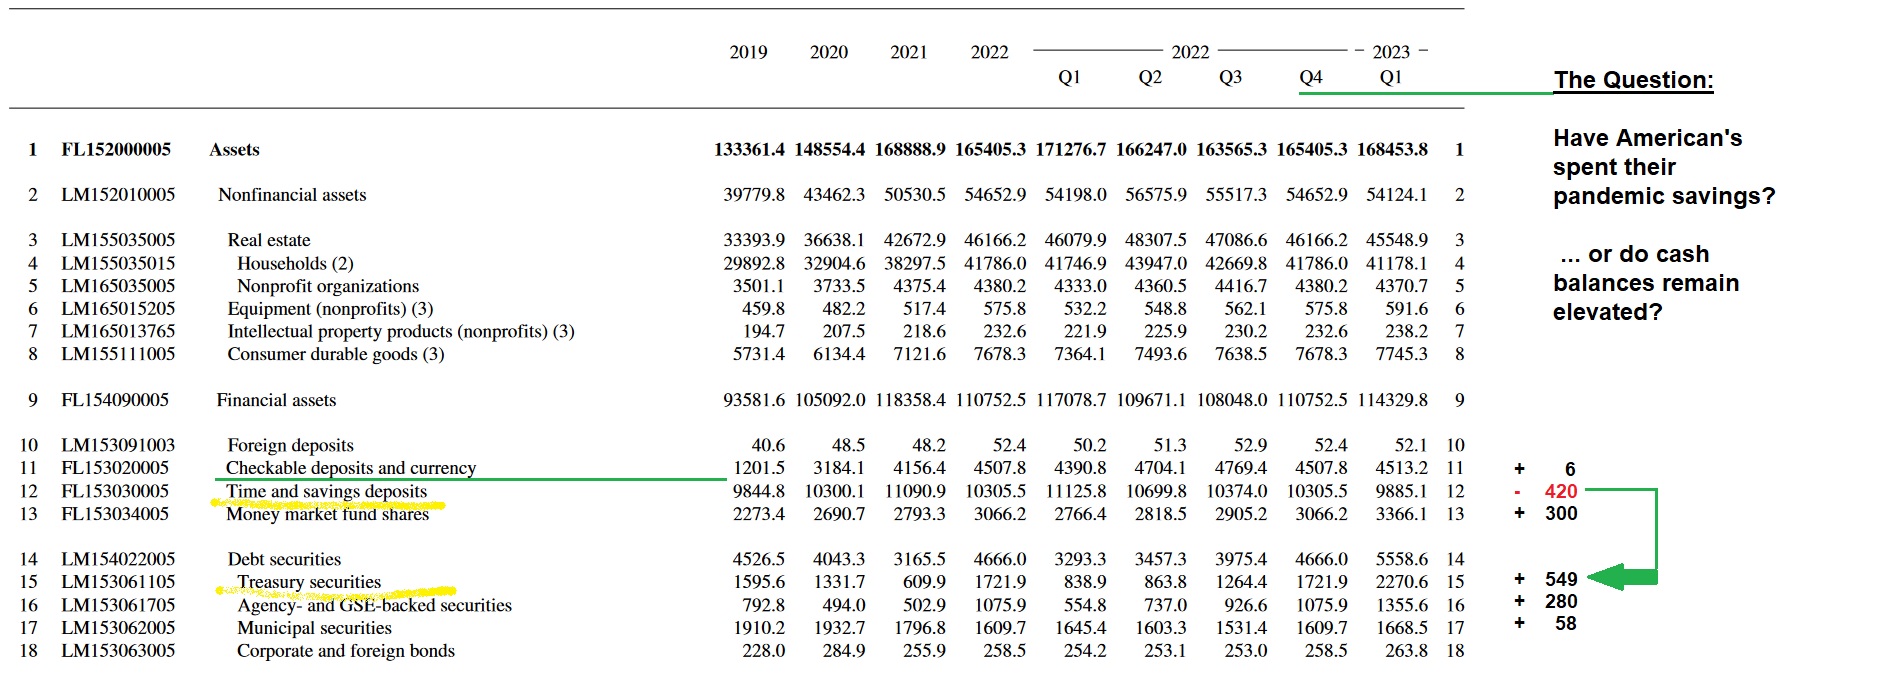
This is the aggregate balance sheet for all Americans. Have they spent all their pandemic savings yet? Nope. Trust the data … not the hype from the media. The data is clear: Pre-pandemic, Americans in the aggregate had saved about $3.2 trillion (line 11 above.) Post-pandemic, after both Republican and Democrat administrations alike handed out trillions in federal stimulus, savings swelled to almost $4.8 trillion in Q3 of 2022. Today’s number remains very near that level. Americans are flush with cash. In fact, if we include ‘longer term’ deposits in the mix, Americans actually have more cash than they did back in 2022!
What about the huge drop during the past quarter in ‘Time and savings deposits’ you ask? Is this concerning (line 12)?
If I simply wanted to frighten and mislead you with the comment “SAVINGS FELL BY ALMOST 1/2 A TRILLION DOLLARS IN Q1 !!!” this statistic from line 12 would do it. But that would ignore line 15. Treasury securities. Concurrent with a ‘time deposits’ declined of $420 billion, American investment in Treasury securities increased by $549 billion. The data doesn’t lie. Americans are still flush with cash.
OK, shall we sink our teeth into a sizzling steak? Let’s check in with the steak houses.
Ironically, this week, the SHI is up. That ‘nextbite’ is more compelling this week than last:
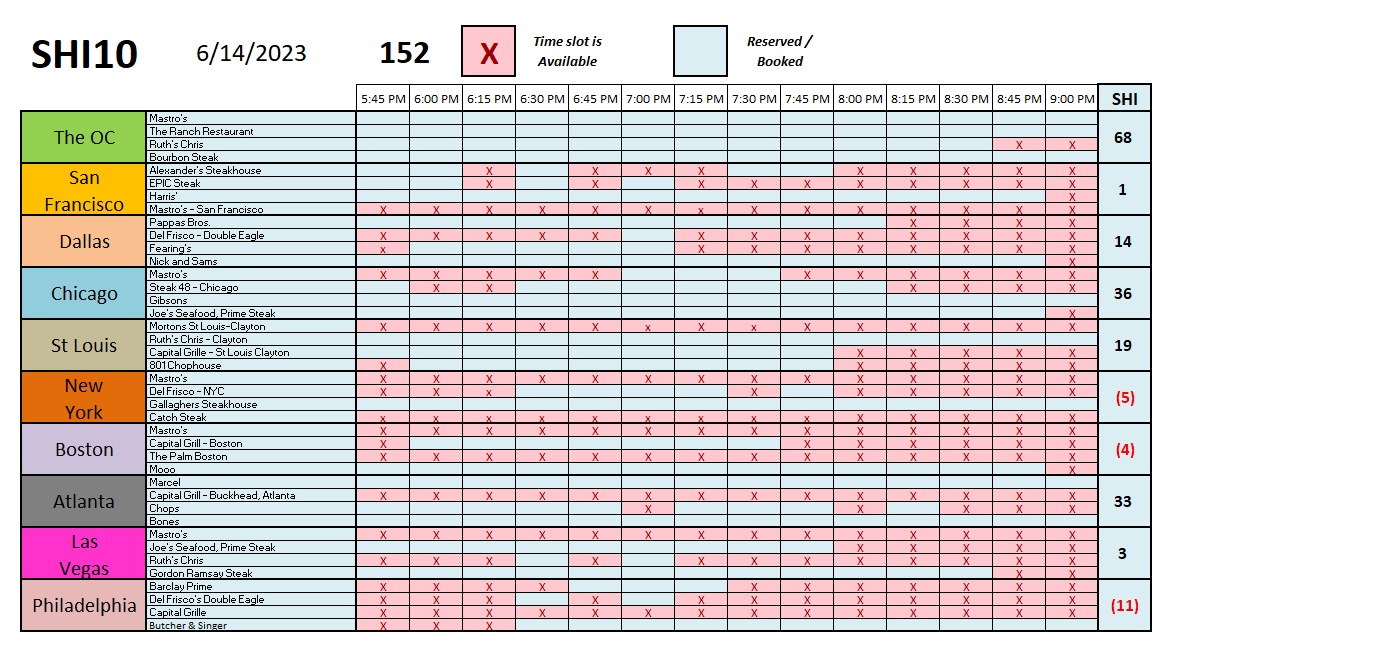
This week, reservation demand firmed in the OC, and even San Francisco generally saw improvement! In light of my comments above, you may find this surprising; but, like with economic data, the details matter with steak houses too. The hotels I mentioned above are in Union Square — and so is the ‘Mastro’s’ restaurant we track. Frankly, I’m not surprised every reservation time slot is available at Mastros. I’m sure an expensive steak house operator would like to be in almost any other location today than Union Square.
Here’s the longer term trend analysis:
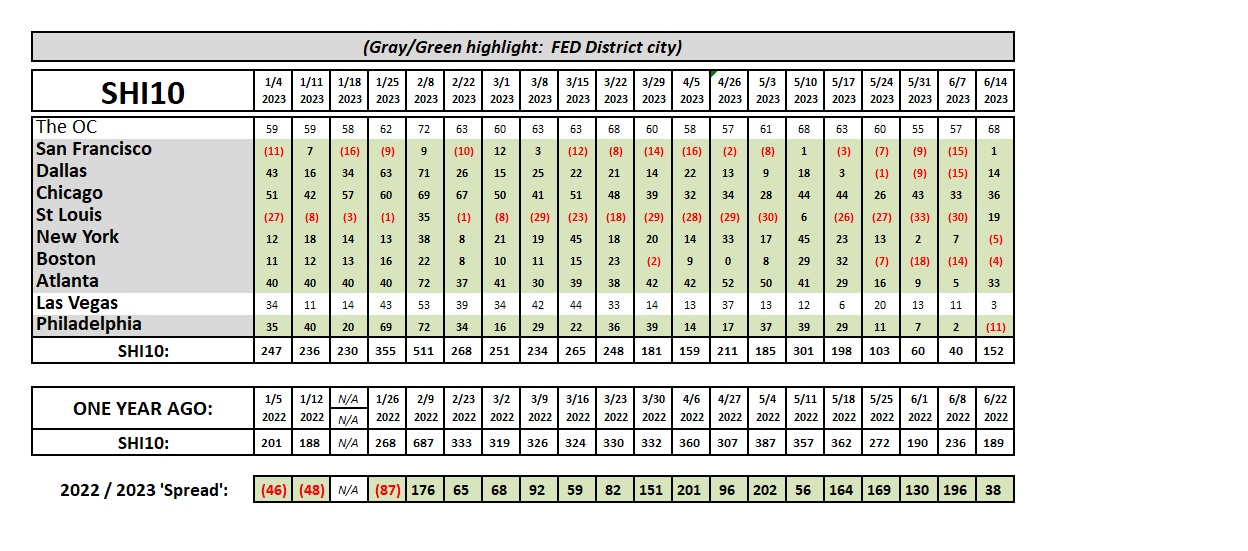
Yep, reservation demand was up for the week … and the ‘Spread’ shrunk appreciably. Interesting. What does this little twist mean for consumer consumption and the economy as a whole?
¯\_(ツ)_/¯
You got me. Once again, the data is all over the map. 🙂
<:> Terry Liebman