
SHI 6.7.23 — On Ice

SHI 5.31.23 — Yardsticks and Labor Hoarders
May 31, 2023
SHI 6.14.23 — Nextbite?
June 14, 2023
The FED wants housing on ice. That is about to happen.
The CPI is the de facto inflation metric for the consumer. ‘Housing cost’ — measured in the CPI via month-over-month rental rate increases — directly comprises about 1/3 of the CPI. Indirectly, increases in housing cost are responsible for about 40% of all CPI rate increases. And by extension, for 40% of all inflation.
“
Housing cost accounts for
40% of the CPI.”
“Housing cost accounts for
40% of the CPI.”
So if rental rates are moving up fast, so is the CPI. And this has been the case for the past couple of years. Rental rates have been moving up super fast since February of 2021. In fact, during this time, annual increases in rental rates — as measured by the CPI — moved up faster than any time in the past 40 years. Spurring consumer inflation to higher and higher levels.
Consider this 50-year chart, courtesy of FRED, which shows the Y-O-Y “percentage change from a year ago” in CPI rental rates across the US, in the aggregate:
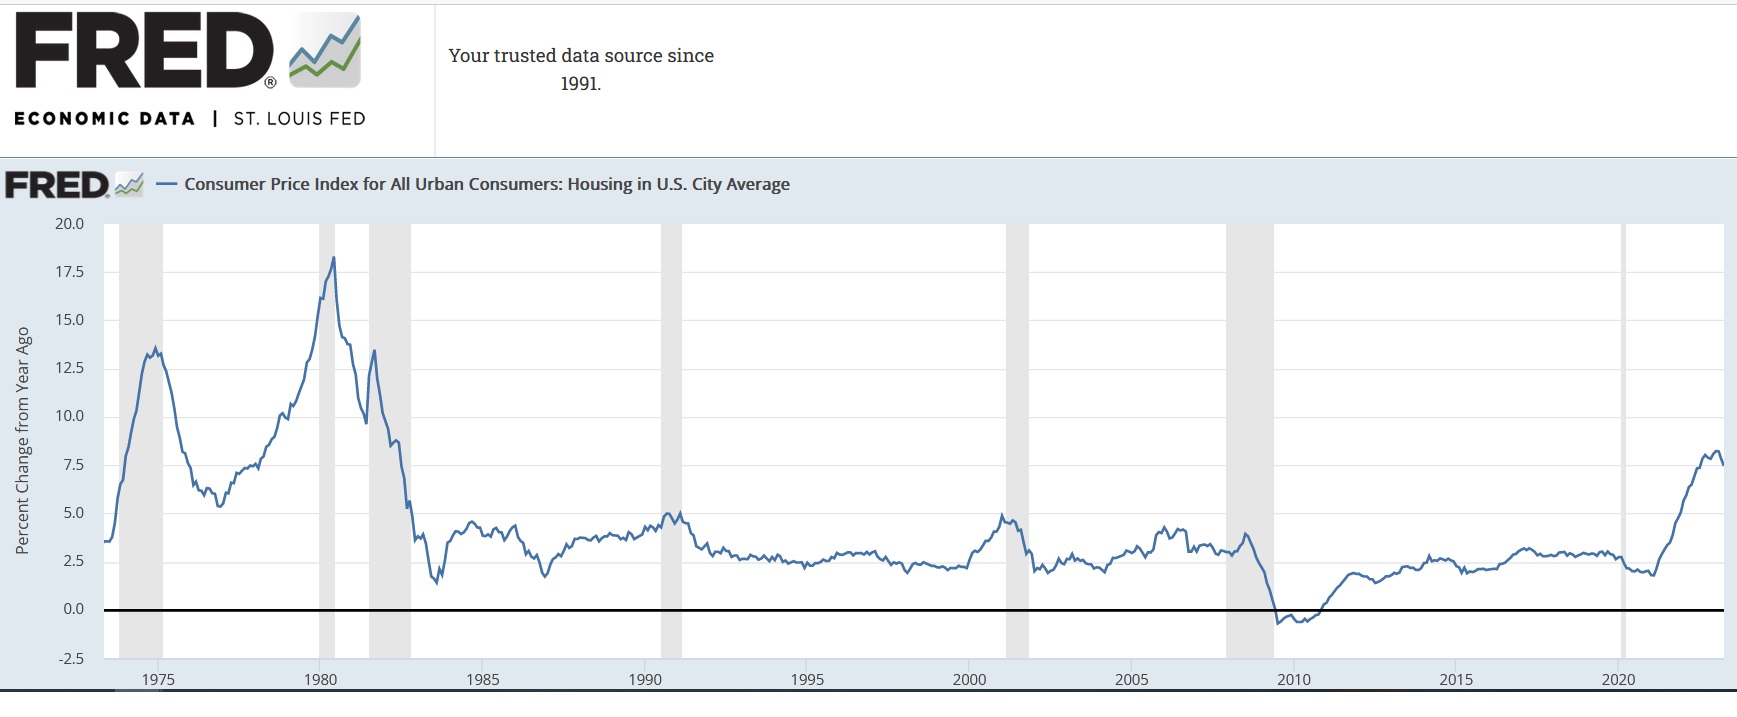
It’s easy to see that annual changes in rental rate/housing costs have been range-bound for almost 40-years. In fact, I would argue the CPI component for housing cost generally declined for about 4 decades. I know, I know … this claim sounds inherently nonsensical. We all know home prices are WAY up across the US. And so are apartment rental rates. So, for now, I ask you to suspend your disbelief, and simply accept the fact that the consistency of the CPI measuring methodology is what we’re discussing here. And that metric trended lower for decades … until February of 2021.
In February of 2021, increases in the CPI housing component shot thru the roof, helping propel the perceived rate of inflation to levels unseen since the 1980s. But that’s all about to change.
And the FED had very little to do with it. Almost nothing, in fact.
Welcome to this week’s Steak House Index update.
If you are new to my blog, or you need a refresher on the SHI10, or its objective and methodology, I suggest you open and read the original BLOG: https://www.steakhouseindex.com/move-over-big-mac-index-here-comes-the-steak-house-index/
Why You Should Care: The US economy and US dollar are the bedrock of the world’s economy.
But is the US economy expanding or contracting?
Expanding. Even as the FED rapidly raises rates! At the end of Q4, 2022, in ‘current-dollar’ terms, US annual economic output rose to an annualized rate of $26.14 trillion. During 2022, America’s current-dollar GDP increased at an annualized rate exceeding 9%. No wonder the FED is so concerned, right? The world’s annual GDP rose to over $100 trillion during 2022. America’s GDP remains around 25% of all global GDP. Collectively, the US, the euro zone, and China still generate about 70% of the global economic output. These are the 3 big, global players.
The objective of this blog is singular.
It attempts to predict the direction of our GDP ahead of official economic releases. Historically, ‘personal consumption expenditures,’ or PCE, has been the largest component of US GDP growth — typically about 2/3 of all GDP growth. In fact, the majority of all GDP increases (or declines) usually results from (increases or decreases in) consumer spending. Consumer spending is clearly a critical financial metric. In all likelihood, the most important financial metric. The Steak House Index focuses right here … on the “consumer spending” metric. I intend the SHI10 is to be predictive, anticipating where the economy is going – not where it’s been.
Taking action: Keep up with this weekly BLOG update. Not only will we cover the SHI and SHI10, but we’ll explore “fun” items of economic importance. Hopefully you find the discussion fun, too.
If the SHI10 index moves appreciably -– either showing massive improvement or significant declines –- indicating growing economic strength or a potential recession, we’ll discuss possible actions at that time.
The Blog:
In about 1-year, the FED effectively raised short-term rates from near zero up to 5%. The rapid rate increases caused all kinds of issues, challenges, responses and financial distress. They broke the mortgage business and for a while there, it looked like they may have taken down the banking system. The death of First Republic is definitely attributed to the FED‘s actions.
By the FEDs words and actions, they wanted to chill the economy and the labor markets, thereby slowing the overall economy. Nothing would make them happier, it seemed, than icing entire housing industry. Significantly higher interest rates did precisely that — home sales activity plummeted and home price increases stalled and flattened.
But thru it all, labor markets remained robust and while GDP growth is definitely slowing — a fact the SHI10 completely agrees with — the US economy continued to expand, slowly but surely chugging up the hill like the little engine that could. And I believe it continues to expand today.
For more than a year, economic expert have assured us that wide-spread home value declines were just around the corner. Get ready for a crash, they said! Nope. Not so much. In fact, according the the folks over at S&P Case-Shiller, home values increased nationally in March. Not by much … but they did increase. Of course, this fact does not address certain geographic pockets where values have fallen for various reasons. But over all, in the aggregate, home values appear stable if not rising.
But rental rates are not. In fact, I believe rental rates are about start trending down at a very meaningful clip. We can thank our capitalist system for this market ‘correction.’ Because that’s precisely what it is. Let me explain.
For decades, US home builders did not keep up with growing home demand. The reasons are widely varied and not overly important for this discussion. But regardless, until about 10-years ago, both new single-family and new multi-family construction lagged ‘household’ formation. Meaning demand outstripped supply.
What happens when demand outstrips supply? That’s easy. Prices go up.
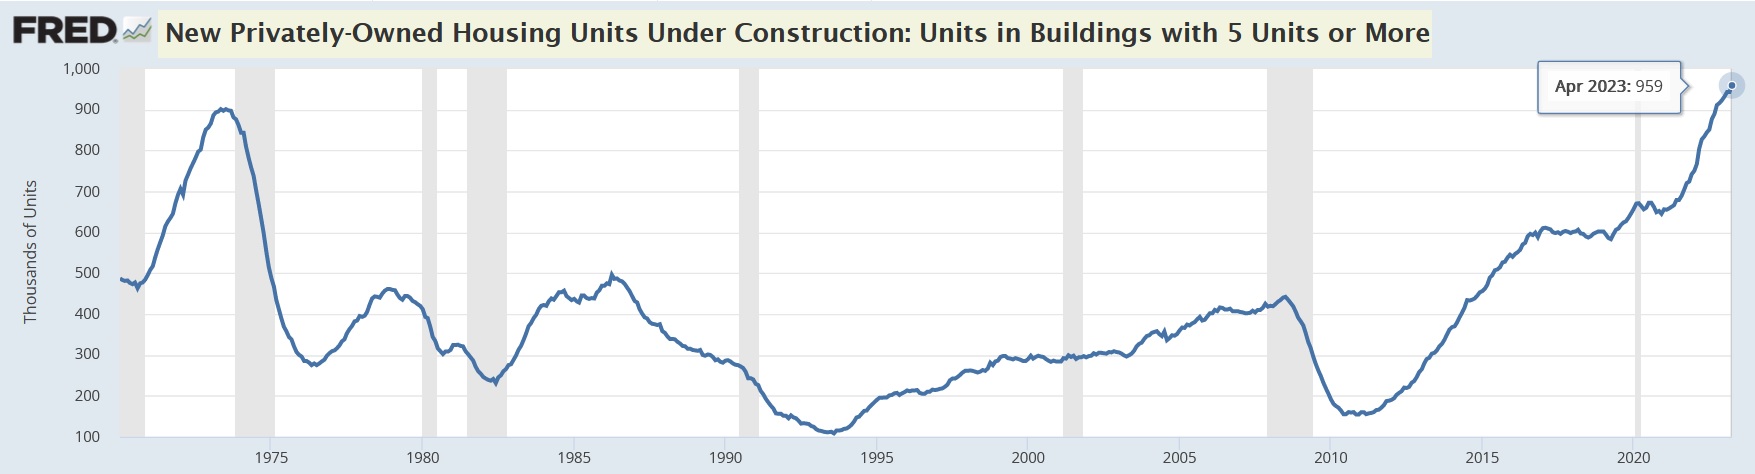
For years, whatever builders built, renters rented. Consider these graphs courtesy of Freddie Mac:
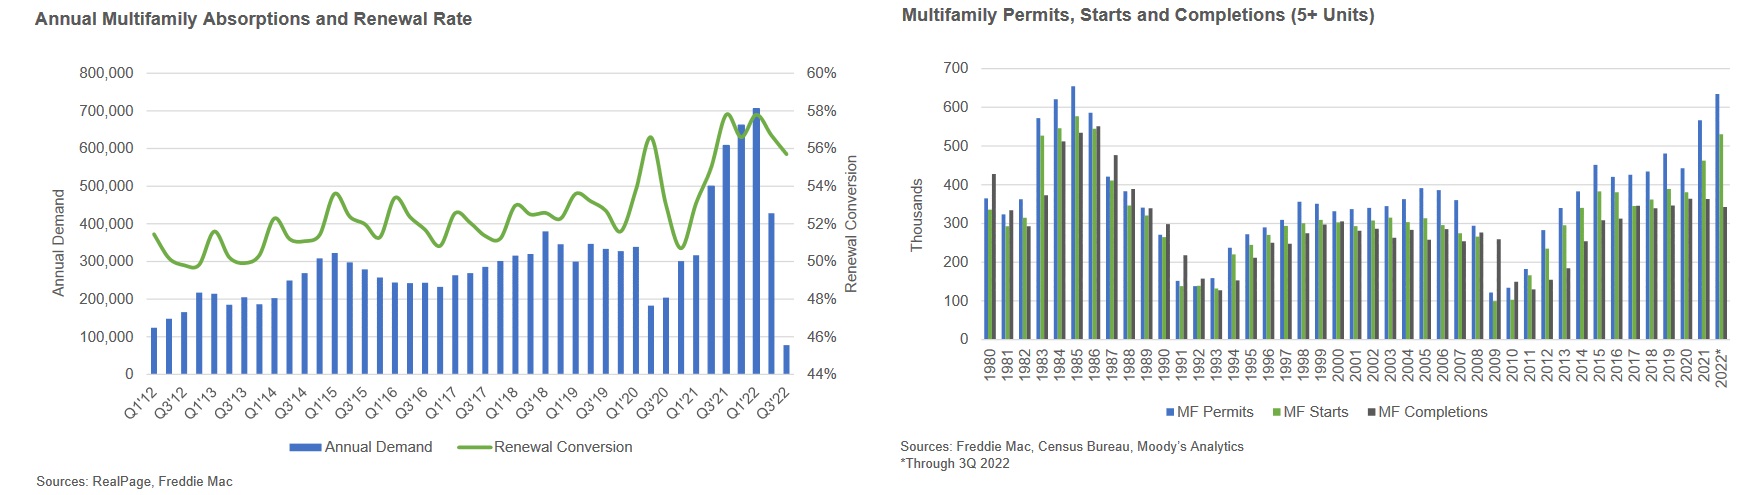
As rental demand spiked post-pandemic, and new multifamily units were completed and put on the market, absorption kept pace. And still, demand was not sated. Demand exceeded supply, year after year. Until now. Now, I believe, for the first time in years, supply will generally exceed demand.
From a variety of data sources, I compiled the chart below. Please note the “Apartments Needed” numbers are my calculation based on the owner/renter percentages implied by the home ownership rate. The ‘Surplus/Deficit’ numbers are also a calculation, intended to demonstrate the continuous tug-of-war between new supply and growing demand since 2010.
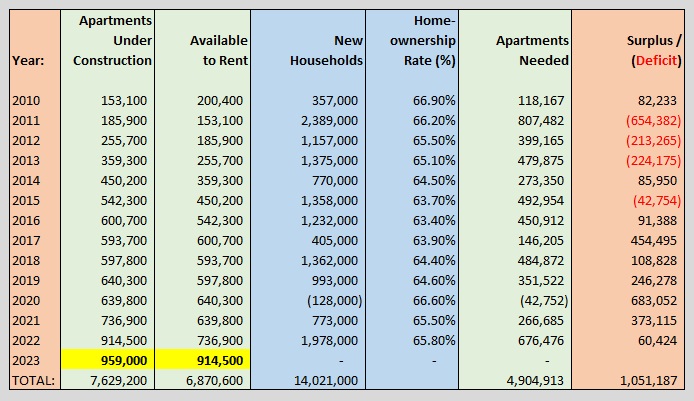
In 2010, 153,100 apartment units were under construction according to the US Census Bureau. I assume units under construction in 2010 became “available to rent” in the next year, or 2011. Units under construction in 2011 — which numbered 185,900 — came on the market in 2012 … and so on. Look at the yellow highlights. The number of apartments that hit the market in 2023 were almost 6X the number in 2011. In fact, there are more apartment units under construction right now across the US than at any time in the past two decades. And as a result, for the first time in a very long time, America has a “surplus” of new apartment units. In other words, for the first time in a long time, supply exceeds demand.
This is not the result of FED action. This is how capital markets correct when they are relatively unencumbered by government regulation. Left to their own devices, capitalism generally corrects and resolves many problems over time. Problems like an inadequate supply of apartments … and a problem like soaring rental rates. The process is not quick or painless, but it does work. Generally. 🙂
Apartment rents are now declining nationwide. Not everywhere, of course. Demand still exceeds supply in many cities. But in geographies where the supply/demand balance has now tilted toward an over-supply, rental rates are falling. Consider this graph:
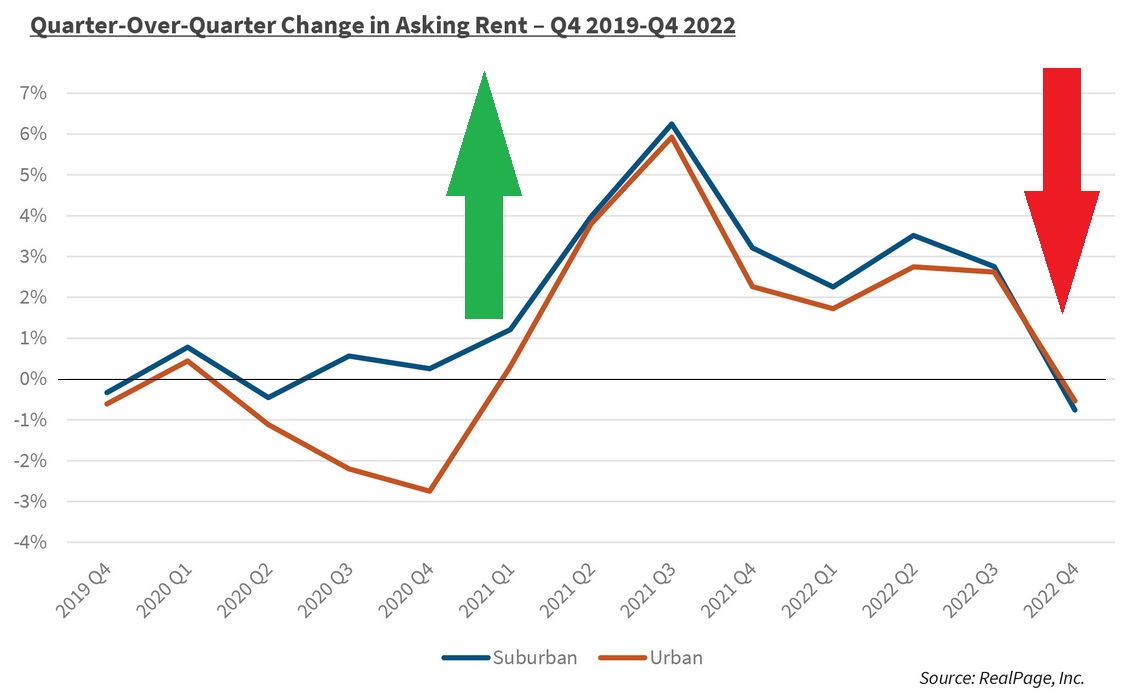
The challenge for the American renter, as I mentioned above, is that this problem resolved itself only over a period of many years … making CRE multifamily investors very happy and tenants, well, quite the opposite.
As the green arrow shows, rental rate increases were soaring. And they didn’t start to moderate or decline until Q4 of last year. Rental rates are declining now. And over the next year or so, I expect apartment rental rates to continue their moderation. Slowly. But I now expect apartment rental rates to slowly decline for the foreseeable future. Ultimately, declines here will find their way into the CPI figures, thereby reducing inflation.
As inflation, too, moderates, the FED has less motivation to raise rates and break things. Good. 🙂
Let’s head over to the SHI steakhouses.
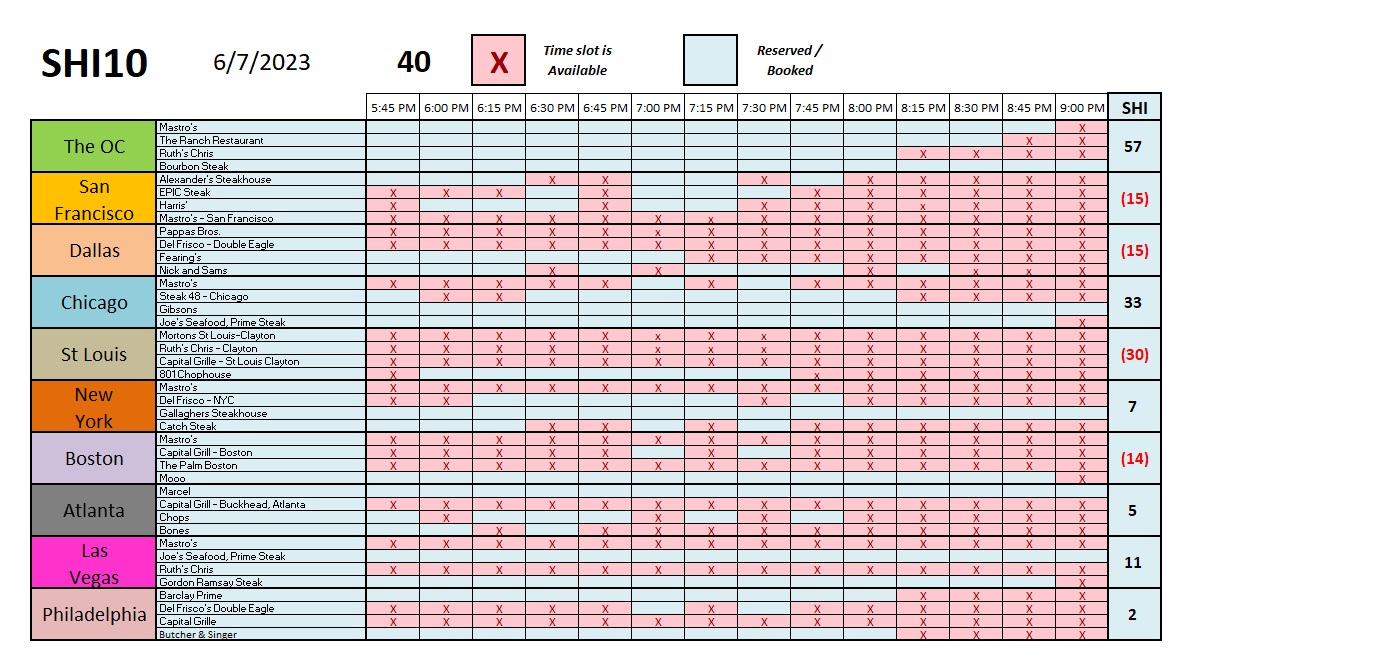
Like rental rates, reservation demand continues to moderate. This week, we’re seeing more open tables in most of the 10 SHI cities. This is much easier to see in the trend report below.
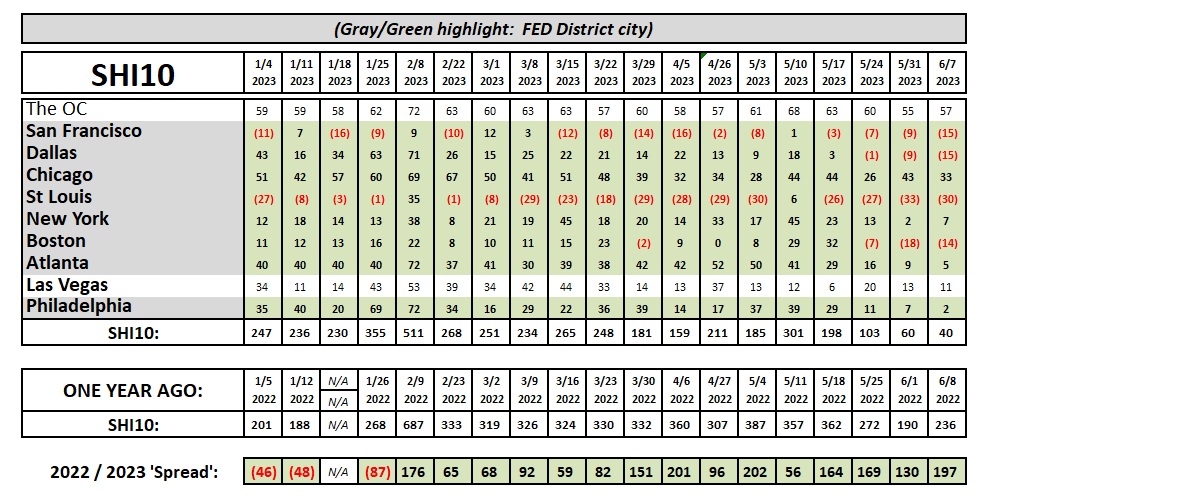
For example, take a closer look at Atlanta. In the beginning of the year, 3 of the 4 expensive steak houses we track in Atlanta were almost always fully booked. Week after week, the Atlanta SHI hovered on either side of ’40.’ No longer. The last 4 weekly readings have grown weaker and weaker. The Atlanta SHI suggests economic conditions in this city are degrading quickly. The same seems to be happening in Philly and Dallas — reservation demand is slowing. SHI readings in NYC are choppy, but demand remains firm. Here in the OC, however, we see little change.
Note that I’ve brought back the year-over-year comparison — or ‘spread.’ I now have same-week 2022 data we can compare to 2023. And with this comparison, we can easily see expensive eatery reservation demand is sliding week after week. In early January, 2023 demand exceed the 2022 comparison week by over 40 points. No longer. As 2023 progresses, aggregate demand is declining. And this week, 2022 expensive eatery demand exceeded 2023‘s reading by almost 200 points. For context, remember the maximum SHI10 reading is 720. So a 200 point decline in the ‘spread’ is a significant change and strong indication of demand weakness … and by extension, overall consumption and economic weakness.
Keep in mind that when I mention economic weakness, I am not suggesting the US is entering a recession. I’m simply stating that the SHI is indicating the extremely robust ‘current-dollar’ GDP growth rate we saw in 2022 is moderating, slowing, as 2023 progresses. I believe our economy continues to expand, albeit at a slower rate than last year.
<:> Terry Liebman


