
SHI 5.31.23 — Yardsticks and Labor Hoarders

SHI 5.24.23 – We Need AI Right Now
May 24, 2023
SHI 6.7.23 — On Ice
June 7, 2023
Why are there 60 minutes in an hour?
And why 24 hours in a day? Or 365 days, plus or minus, in each year for that matter? Have you ever stopped to consider these questions? Probably not. Why would you. After all, that’s simply the way it is. There have always been 60 minutes in an hour.
Seconds, minutes and hours are the yardsticks measuring the passage of time. That’s all they are. Units of measurement. We need units of measurement for many reasons, but one of the most important reasons is consistency. The only way we can compare two seemingly identical items is to use a never-changing yardstick.
“
Did an hour always have 60 minutes?”
“Did an hour always have 60 minutes?”
No.
Homo sapien did not arrive on Earth with clocks or watches. The sun rose and set. And seasons came and went. But history tells us it wasn’t until about 4000 years ago when the Babylonians in Mesopotamia decided to measure time. They paid close attention … and eventually tracked movements of the sun, moon and stars, using them to create calendars and create the first known system for measuring the passage of time.
And because they used a ‘base-60’ numbering system — not the ‘base-10’ system we use today — they counted in units of 60. The Babylonians divided the day into 12 periods of time, each 2 hours. Time passed … and this system was subsequently adopted and modified by the Egyptians, Greeks and Romans, all of whom influenced the development of timekeeping. The Egyptians decided to split the day into 24 hours, based on their sundials. The Greeks used a system of 60 fractions, called minutes, to measure time more precisely. The Romans named some of these fractions after their gods, such as hora (hour), minuta (minute) and secunda (second).
Today’s modern system of timekeeping is based on these ancient systems. Had the Babylonians used a base-10 system, a ‘modern’ hour might have been only 10 minutes long. And each minute might be just 10 seconds.
But as nutty as this sounds, it really wouldn’t matter in the bigger scheme of things. Because no matter what yardstick we use to measure a day, a day is always the same duration. Maintaining global consistent is much more important than how many minutes we decide an hour has. And thus, regardless of whether an hour is 10 minutes (with each minute lasting much longer — 6 “Babylonian” minutes, to be precise) or 100 minutes matters little. What matters most is the absolute, and unequivocal, consistency and universal adoption of the yardstick itself.
Welcome to this week’s Steak House Index update.
If you are new to my blog, or you need a refresher on the SHI10, or its objective and methodology, I suggest you open and read the original BLOG: https://www.steakhouseindex.com/move-over-big-mac-index-here-comes-the-steak-house-index/
Why You Should Care: The US economy and US dollar are the bedrock of the world’s economy.
But is the US economy expanding or contracting?
Expanding. Even as the FED rapidly raises rates! At the end of Q4, 2022, in ‘current-dollar’ terms, US annual economic output rose to an annualized rate of $26.14 trillion. During 2022, America’s current-dollar GDP increased at an annualized rate exceeding 9%. No wonder the FED is so concerned, right? The world’s annual GDP rose to over $100 trillion during 2022. America’s GDP remains around 25% of all global GDP. Collectively, the US, the euro zone, and China still generate about 70% of the global economic output. These are the 3 big, global players.
The objective of this blog is singular.
It attempts to predict the direction of our GDP ahead of official economic releases. Historically, ‘personal consumption expenditures,’ or PCE, has been the largest component of US GDP growth — typically about 2/3 of all GDP growth. In fact, the majority of all GDP increases (or declines) usually results from (increases or decreases in) consumer spending. Consumer spending is clearly a critical financial metric. In all likelihood, the most important financial metric. The Steak House Index focuses right here … on the “consumer spending” metric. I intend the SHI10 is to be predictive, anticipating where the economy is going – not where it’s been.
Taking action: Keep up with this weekly BLOG update. Not only will we cover the SHI and SHI10, but we’ll explore “fun” items of economic importance. Hopefully you find the discussion fun, too.
If the SHI10 index moves appreciably -– either showing massive improvement or significant declines –- indicating growing economic strength or a potential recession, we’ll discuss possible actions at that time.
The Blog:
By now, you must be wondering what the heck time yardsticks have to do with economics or finance? Great question.
Every month since 1998 the United States Bureau of Labor Statistics (“BLS”) has been measuring the number of monthly job openings across America. Here’s a comprehensive historic chart, courtesy of the St Louis FED:
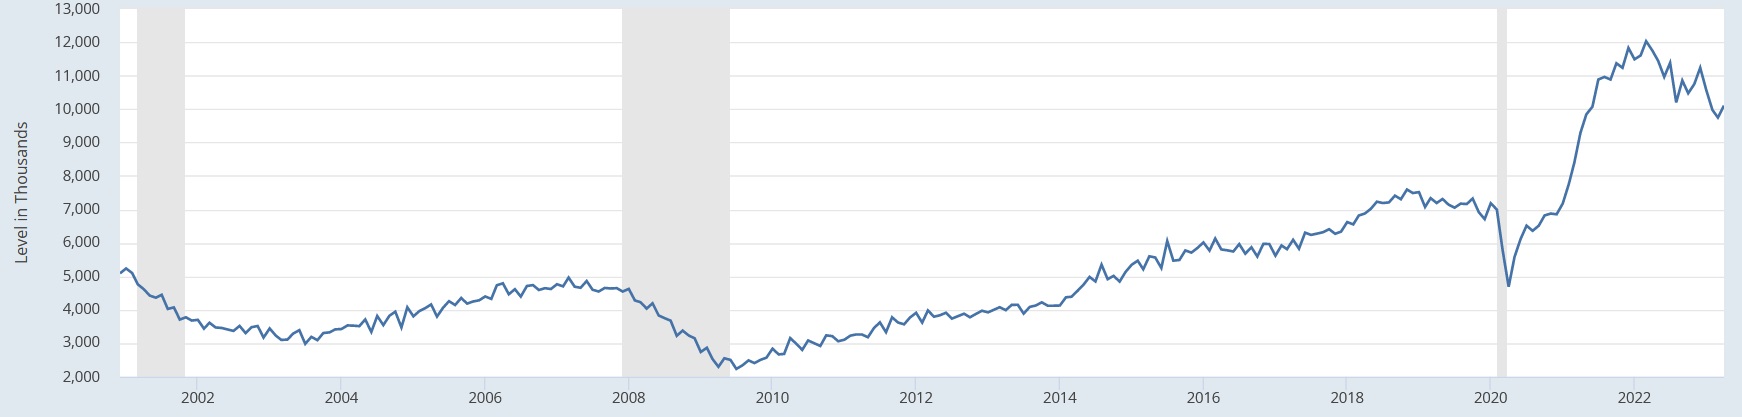
Just as time has been measured consistently for centuries, the BLS measures the number of job openings the identical way every month. And since every year is divided into 12 months, we are able to measure and graph the ebbs and flows of job openings over the years, as shown above.
The consistent units of measurement make it possible to compare results over time, as we see in the image above. Since job openings were first measured in 1998, the BLS consistently reports the number of open jobs on the last day of each month. Openings rise and fall based on the economic conditions at that time, but over time, they were relatively range-bound. Until the pandemic.
Post-pandemic, for the first time ever, the number of job openings here in America shot seemingly straight up, peaking at over 12 million in March of 2022. For context, consider this fact: The US labor force includes approximately 160 million folks. It too ebbs and flows, but this number is helpful to develop a contextual framework. With 5 million job openings around the turn of the century, American business were seeking to fill positions and employ about 3% of the labor force. That number — the 3% — is known as the ‘jobs opening rate.’ In March of 2022, that number jumped to 12 million and 7.5% of the total labor force.
And since March of 2022, the number has remained exceptionally high, but the general trend was down. And in fact, by the last day of March of 2023, the openings number had fallen to about 9.75 million. Still almost double the historic trend, of course, but at least the number was falling month over month, giving the FED some comfort that US firm’s demand for labor was waning, slowly and surely.
Until today. Today, that number jumped once again, to just a bit over 10.1 million, reflecting a job openings rate of 6.1% of the labor force. Hmmm … by this metric, the demand for labor clearly remains quite strong. Which is puzzling, right? After all, we all know the FED has raised interest rates about 5% in the last year or so, pushing the ‘prime rate’ up to 8.25% today.
Back in 2010, Microsoft — one of only 2 American companies having a triple-A credit rating, sold $1 billion of 3-year notes at a rate of 0.875%. Not anymore. That same bond issue would likely be well over 4%. Remember: Microsoft is an Aaa rated company — this entitles them to the lowest rates possible.
The point is this: Every company in America today — in fact, every company in the world — will pay a much higher interest rate for borrowed funds. And these higher interest charges adversely affect their profits. When profits come under pressure, large American corporations cut the one expense they know they can easily reduce: Their labor force. You and me. They cut jobs. They reduce headcount.
How many of the 160 million or so in the labor force are employed by large corporations? Another great question.
The BLS divides companies into nine (9) categories based on number of employees. The largest category is ‘size class 9’ — firms with 1,000 or more employees. And while the BLS says size class 9 firms represent only 0.4% of all US ‘private sector’ companies, they employ almost almost 30% of all workers in the private sector. Perhaps all are not yet reducing headcount, but many are.
Which begs the question: If the large American companies that employ about 30% of the labor force are cutting their employee count, why is the job openings number remaining stubbornly high — in fact, not just stubbornly high, but when measured in historic context at levels almost double the highest job openings rate we’ve ever seen? This makes no logical sense to me.
Moving from fact to opinion, here’s what I think is happening. While an hour remains firmly set at 60 minutes, the JOLTs report from the BLS is no longer an accurate yardstick measuring American’s demand for labor. I believe something is throwing off the numbers. I think post-pandemic we find ourselves in a new paradigm. And this new paradigm is ‘job hording’ by large companies.
The BLS methodology remains unchanged. They survey about 16,000 businesses and government agencies, across all industries and regions. The survey asks employers to report the number of “job openings” on the last business day of the month. Historically, the BLS has defined job openings as vacant positions for which the employer is ‘actively recruiting workers.’
But even though the methodology for the collection of JOLT data is consistent, I believe the private sector has changed their definition of ‘actively recruiting workers.’ I contend they found recruitment so unbelievably difficult as the pandemic ended, they are leaving positions open long after they no longer have any serious desire to fill. Much like a sleeping fisherman leaves a fishing pole and line in the water, and a baited hook on the end, these large corporations are not seriously attempting to catch fish. If one happens to take the bait, and it’s a good one, they’ll keep it. If not, they’ll simply throw it back. In this way, post-pandemic inspired fear has created the environment where, for the first time ever, large American companies are labor hoarding. And, I believe, they are not sharing their true intentions with the BLS.
Of course, this is only conjecture on my part. Once again, that thing we call time will ultimately prove me right or wrong. But until that time, unless the 400 PhD economist at the FED begin reading my blog, I’m confident the FED will continue to view the BLS JOLT report as important and consistent labor force data. 🙂
Speaking of fish, let’s head over to the steak houses and see if today’s SHI10 agrees with today’s JOLT report from the BLS.which suggests everything is quite rosy in America’s economic flower bed!
Nope. It does not. In fact, today’s SHI10 is the lowest reading we’ve seen since July of 2022. Here’s the chart.
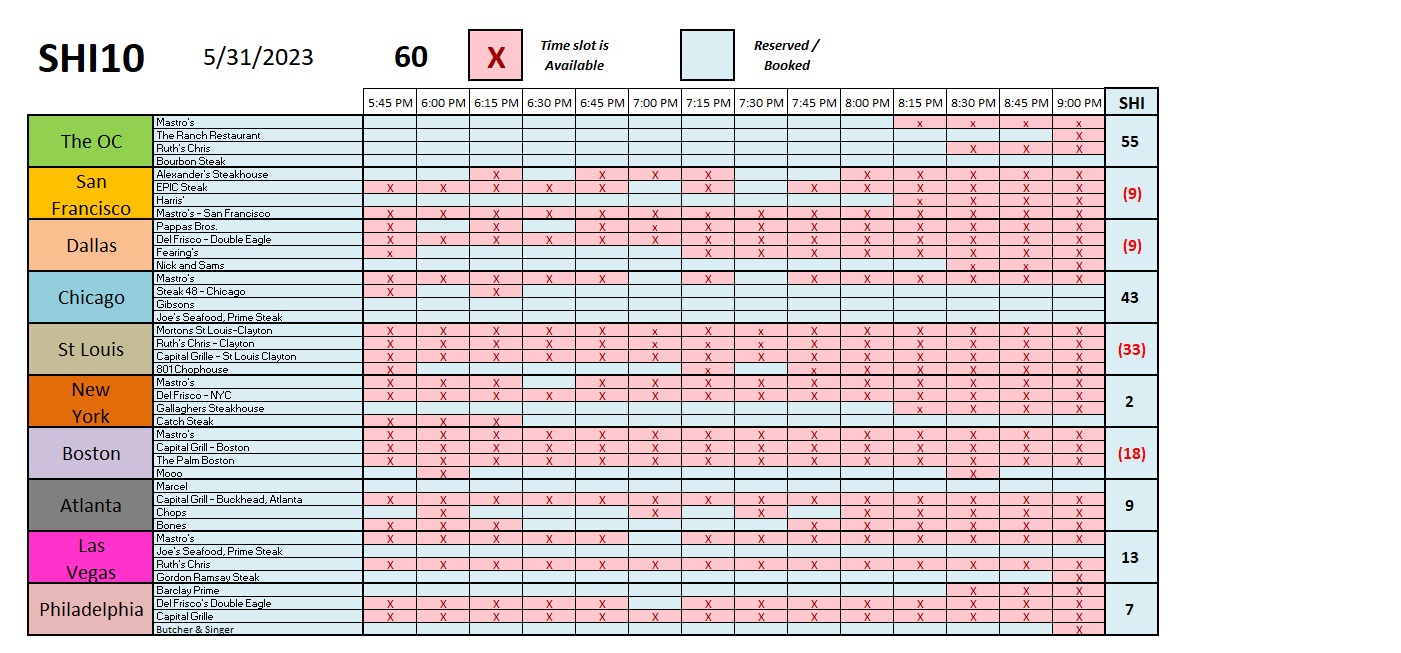
This week, for the first time in a long time, our expensive eatery icons that have been consistently unavailable have openings. For example, take a look at ‘Mastro’s Ocean Club’ here in the OC. Sure, 8:15 isn’t my idea of the optimal reservation, but this is the first week in many, many months that anything has been available before 9 pm. And check out Boston: For the first time in memory, right two (2) reservation slots for a party of 4 on Saturday are available at Mooo before 9 pm.
Of course, we won’t talk about St Louis. That city should just get out of the extravagant steak house business. 🙂
Here’s the longer term trend report:
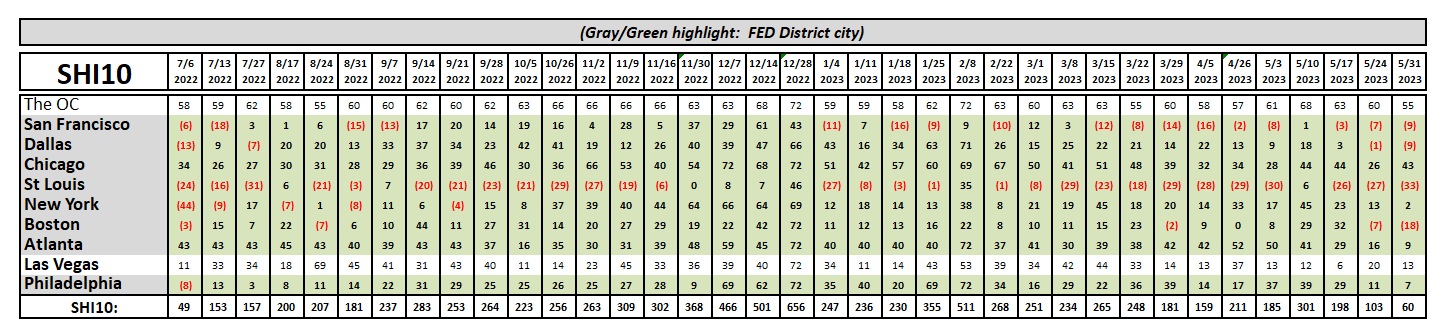
Clearly, the SHI disagrees with the JOLTs report implications that the labor market, and by extension our economy, remains exceptionally strong today. Well heeled patrons are not booking reservations as often as they were just months ago. The SHI trendline suggests the US economy is definitely slowing. Which, if true, given the feverish growth pace seen in recent quarterly nominal GDP, is not necessarily a bad thing.
The FED’s ‘Beige Book’ report was also released today. To quote our friends over there,
” … Economic activity was little changed overall in April and early May. Four Districts reported small increases in activity, six no change, and two slight to moderate declines. Expectations for future growth deteriorated a little, though contacts still largely expected a further expansion in activity. Consumer expenditures were steady or higher in most Districts, with many noting growth in spending on leisure and hospitality.“
The BLS job openings report and the Beige Book both suggests the economy remains on strong footing. The SHI disagrees … and is pointing toward declining consumer activity. Time will tell … but I think the FED’s 5% aggreagate rate hikes are starting to gain traction, slowing the economy more and more with the passage of time.
<:> Terry Liebman


