
SHI 6.28.23 — Here … Kitty, Kitty, Kitty!

SHI 6.14.23 — Nextbite?
June 14, 2023
SHI 7.5.23 — Rolling Along
July 5, 2023
Have you ever tried to call your cat home at night? I’m sure he trots on over the moment you do.
No? Not so much? I understand. Same with my cat.
Cats are not like dogs. You call for your dog … and he probably bolts to your side, hoping get a ball, a head rub, or <GASP!> YOU-HAVE-FOOD! But not a cat. You can yell for your cat until you’re blue in the face, but he’ll show up when he’s darn good and ready.
“
The 2023 recession is like a cat.“
“The 2023 recession is like a cat.“
Because like a cat, it doesn’t just show up when you call for it. Many economists have been calling for a US recession for over a year now. Some for almost 18 months.
But like your cat, the 2023 recession has been quite elusive. Early on, as the FED began their meteoric rate-hike cycle back in March of 2022, I was concerned about our US labor force … the job market … and the impact higher rates would have on the consumer. Elizabeth Warren and I were essentially pen-pals on these issues. But neither came to pass. Like your elusive kittie … the recession is still out there, lurking, waiting for god-knows-what before “coming home” so to speak. Is this about to change? Is our 2023 ‘cagy kittie recession’ about to pounce like a Ninja Kittie in the night?
Welcome to this week’s Steak House Index update.
If you are new to my blog, or you need a refresher on the SHI10, or its objective and methodology, I suggest you open and read the original BLOG: https://www.steakhouseindex.com/move-over-big-mac-index-here-comes-the-steak-house-index/
Why You Should Care: The US economy and US dollar are the bedrock of the world’s economy.
But is the US economy expanding or contracting?
Expanding. Even as the FED rapidly raises rates! At the end of Q4, 2022, in ‘current-dollar’ terms, US annual economic output rose to an annualized rate of $26.14 trillion. During 2022, America’s current-dollar GDP increased at an annualized rate exceeding 9%. No wonder the FED is so concerned.
The world’s annual GDP rose to over $100 trillion as 2022 began. And according to the IMF, in June of this year, current-dollar global GDP eclipsed $105 trillion! IMF forecasts call for global GDP to reach almost 135 trillion by 2028.
America’s GDP remains around 25% of all global GDP. Collectively, the US, the euro zone, and China still generate about 70% of the global economic output. These are the 3 big, global players. They bear close scrutiny.
The objective of this blog is singular.
It attempts to predict the direction of our GDP ahead of official economic releases. Historically, ‘personal consumption expenditures,’ or PCE, has been the largest component of US GDP growth — typically about 2/3 of all GDP growth. In fact, the majority of all GDP increases (or declines) usually results from (increases or decreases in) consumer spending. Consumer spending is clearly a critical financial metric. In all likelihood, the most important financial metric. The Steak House Index focuses right here … on the “consumer spending” metric. I intend the SHI10 is to be predictive, anticipating where the economy is going – not where it’s been.
Taking action: Keep up with this weekly BLOG update. Not only will we cover the SHI and SHI10, but we’ll explore “fun” items of economic importance. Hopefully you find the discussion fun, too.
If the SHI10 index moves appreciably -– either showing massive improvement or significant declines –- indicating growing economic strength or a potential recession, we’ll discuss possible actions at that time.
The Blog:
Well, maybe. 🙂 But I don’t think so.
As usual, the data conflicts. For example, consider this week’s SHI trend report:
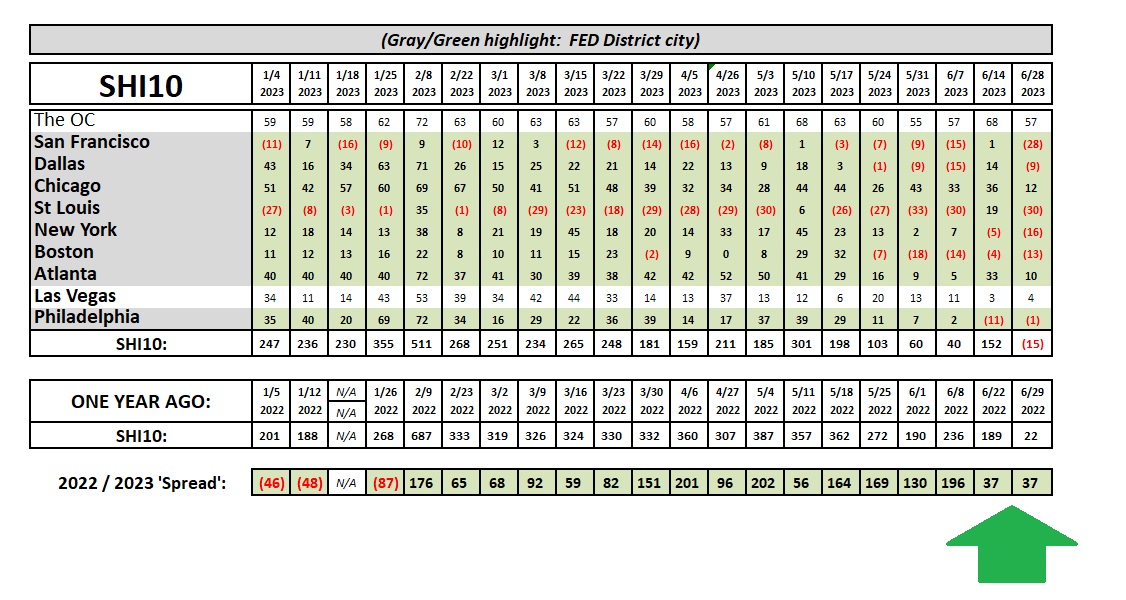
It’s easy to see from the chart above that the SHI in most of our ten (10) cities fell dramatically this week. ‘Vegas and the OC were fairly consistent week-over-week, but our other 32 expensive eateries in the other 8 SHI cities are struggling this week. And for the first time in 2023, the SHI10 is negative!
But at the same time, the 2022/2023 ‘Spread‘ (see the ‘green arrow’ above) is unchanged. Meaning that while reservation demand in our steak houses dropped significantly this week, the same thing happened this week, last year. The ‘Spread’ number helps offer us context at a time when the underlying trend is a bit concerning.
So the SHI40 is not flashing red warning signs for a coming-soon recession. Sure, it’s a bit soft, which is mildly concerning, but it is only one data point. What are other data points suggesting? Here’s an interesting one for you:
Every quarter, the Federal Reserve Board produces a report that tracks movement in the “Financial Obligations Ratio” — known as FOR — so see how stressed the American public is, as a whole. This metric calculates the percentage of household after-tax income needed for debt repayment (such as mortgages, HELOCs, auto loan payments, and credit card interest.) It is calculated as a ratio, or percentage, of aggregate mandatory debt payments (interest and principal) to aggregate after-tax income. The idea is to observe trends in the “burden” for American households caused by debt and other similar obligations.
The data goes back to 1980, which is meaningful because the “all time” high in interest rates was 1981. And the all-time low, of course, was January of 2021 — almost exactly 40 years later. Inasmuch as the FOR ratio measures the percentage of American’s pay of their disposable income to cover their debts, logic would suggest the FOR in 1981 would be super-high and the 2021 FOR, quite low. Nope. The highest FOR during the 1980s was measured in 1987. And the highest measure of FOR ever recorded was in the 4th quarter of 2007. At this time, the FOR measured 18%. Remember: This ratio is very fluid … if aggregate disposable income rises a lot, the ratio can go down. If the amount of debt Americans are carrying goes up, it can go up significantly even if rates are lower. I might be getting too deep in the weeds here, so let me summarize with this comment:
The FOR hit a 40-year low in the first quarter of 2021.
Makes sense, right? Not only did interest rates bottom at that time, but American’s used much of the federal government’s cash handouts in 2020 and 2021 to pay down debt. As a result, the FOR dropped all the way down to 12.55%.
It’s higher today. American’s have been loading up on debt lately. However, much of that debt is fixed rate housing debt. Meaning as long as those Americans remain in their houses, and keep their super-low fixed rate mortgage, the FOR is only impacted by variable rate loans. Such as HELOCs, autos and credit cards.
So American’s are staying put. Check out the graph below. New home loans (below, ‘single-family mortgage obligations’) also peaked when interest rates bottomed. I find it pretty amazing that new home loan originations hit their highest point at almost precisely the same time interest rates hit their lowest level. (I added the red and green lines.)
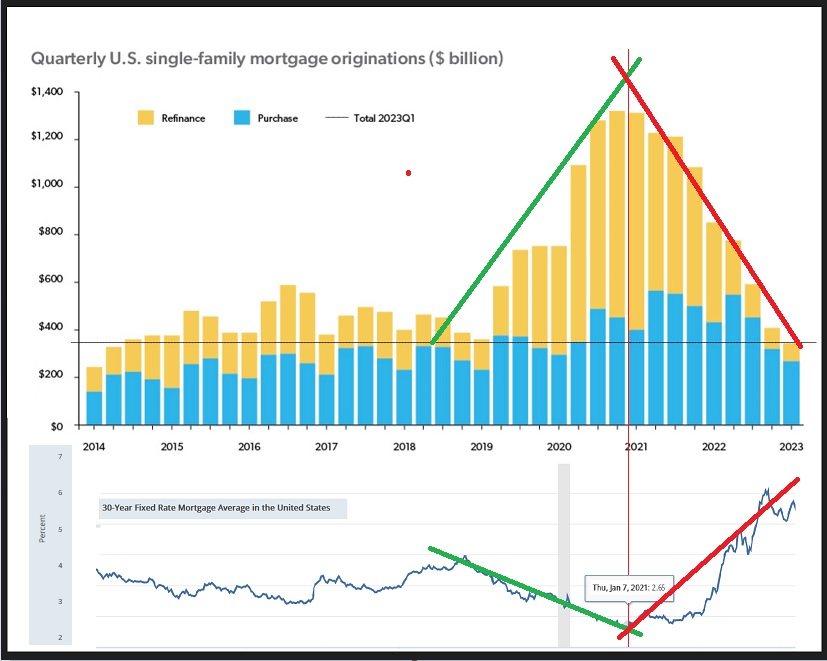
So while homes are much more expensive today, the FOR is quite a bit lower today than it was in 2007. Remember, the FOR peaked at 18% in 2007. Today, it measures 14.28%, as of the end of Q1, 2023. Said another way, Americans are spending only a bit more than 14% of their disposable income on debt payments, down from 18% in 2007.
So we all have more money to spend on expensive steaks. Or family trips to Disneyland. Or that long-delayed European honeymoon. You’ll also recall from my last blog that American’s are also sitting on a huge pile of cash. The FOR is a great measure of financial stress. Cash helps offset financial stress. That huge pile of cash, when combined with a moderately low FOR, suggests that mythical recession remains well at bay.
And while these metrics changes often, in my opinion, these days you have a better chance of seeing a Ninja Kittie before a recession.
<:> Terry Liebman


