
SHI 7.5.23 — Rolling Along

SHI 6.28.23 — Here … Kitty, Kitty, Kitty!
June 28, 2023
SHI 7.12.23 – A Gigantic Meal
July 13, 2023
It appears the much-feared ‘recession’ ninja kittie remains fast asleep.
The day following my last blog — again, I’ll repeat: the next day — we learned that the US economy as measured by GDP growth was actually much stronger than previously reported. I stress ‘the next day’ so you know I’m not cheating. 🙂
I’ll admit even I was a bit surprised by the strength of the BEA report:
“Real gross domestic product (GDP) increased at an annual rate of 2.0% in the first quarter of 2023, according to the “third” estimate. In the fourth quarter of 2022, real GDP increased 2.6%. The GDP estimate for the first quarter was revised up 0.7 percentage point from the “second” estimate, primarily reflecting upward revisions to exports and consumer spending.”
Wow. Revised up by 0.7%. Revised up from a real growth rate of 1.3% up to 2.0%. That’s a significant upward revision.
“
The US economy is stronger than I expected.“
“The US economy is stronger than I expected.“
It’s one thing to to avoid a recession after the fastest FED rate hike cycle in over 40 years. It’s another thing entirely for our economy to continue its at-trend ‘real’ GDP growth in spite of the FED headwinds. Consider these facts:
- <:> After realizing a real growth rate of 2.6% in the fourth quarter of last year, in Q1 of 2023, real GDP grew at the annualized rate of 2.0.
- <:> ‘Current dollar’ GDP increased by a staggering annualized rate of 6.1%, adding $392 billion to our GDP.
- <:> US GDP is now running at the annualized level of over $26.5 trillion.
What? You’re not impressed yet? Well consider this: The American economy finished 2019 — the last, full pre-pandemic year — at an annualized GDP level of $21.73 trillion. Thus, current dollar GDP has grown by almost $5 trillion — an increase of almost 22% — during the pandemic and post-pandemic periods to date. Staggering.
Of course, past performance does not ensure the ninja kittie will remain asleep. Our cute little recession buddy might wake up and meow ferociously … but I remain doubtful.
Welcome to this week’s Steak House Index update.
If you are new to my blog, or you need a refresher on the SHI10, or its objective and methodology, I suggest you open and read the original BLOG: https://www.steakhouseindex.com/move-over-big-mac-index-here-comes-the-steak-house-index/
Why You Should Care: The US economy and US dollar are the bedrock of the world’s economy.
But is the US economy expanding or contracting?
Expanding. Even as the FED rapidly raises rates! At the end of Q1, 2023, in ‘current-dollar’ terms, US annual economic output rose to an annualized rate of $26.53 trillion. After enduring the fastest FED rate hike in over 40 years, America’s current-dollar GDP still increased at an annualized rate exceeding 6% during the first quarter of 2023. No wonder the FED is so concerned. The world’s annual GDP rose to over $100 trillion as 2022 began. And according to the IMF, in June of this year, current-dollar global GDP eclipsed $105 trillion! IMF forecasts call for global GDP to reach almost 135 trillion by 2028. America’s GDP remains around 25% of all global GDP. Collectively, the US, the euro zone, and China still generate about 70% of the global economic output. These are the 3 big, global players. They bear close scrutiny.
The objective of this blog is singular.
It attempts to predict the direction of our GDP ahead of official economic releases. Historically, ‘personal consumption expenditures,’ or PCE, has been the largest component of US GDP growth — typically about 2/3 of all GDP growth. In fact, the majority of all GDP increases (or declines) usually results from (increases or decreases in) consumer spending. Consumer spending is clearly a critical financial metric. In all likelihood, the most important financial metric. The Steak House Index focuses right here … on the “consumer spending” metric. I intend the SHI10 is to be predictive, anticipating where the economy is going – not where it’s been.
Taking action: Keep up with this weekly BLOG update. Not only will we cover the SHI and SHI10, but we’ll explore “fun” items of economic importance. Hopefully you find the discussion fun, too.
If the SHI10 index moves appreciably -– either showing massive improvement or significant declines –- indicating growing economic strength or a potential recession, we’ll discuss possible actions at that time.
The Blog:
Economists may think only ‘real’ GDP growth is worth measuring, but the US Treasury collects income taxes based on America’s ‘current-dollar’ GDP results. Consider the image below. Following the end of WW2 in the late 1940s, total federal tax receipts as a percentage of nominal or current-dollar GDP increased to just under 20%.
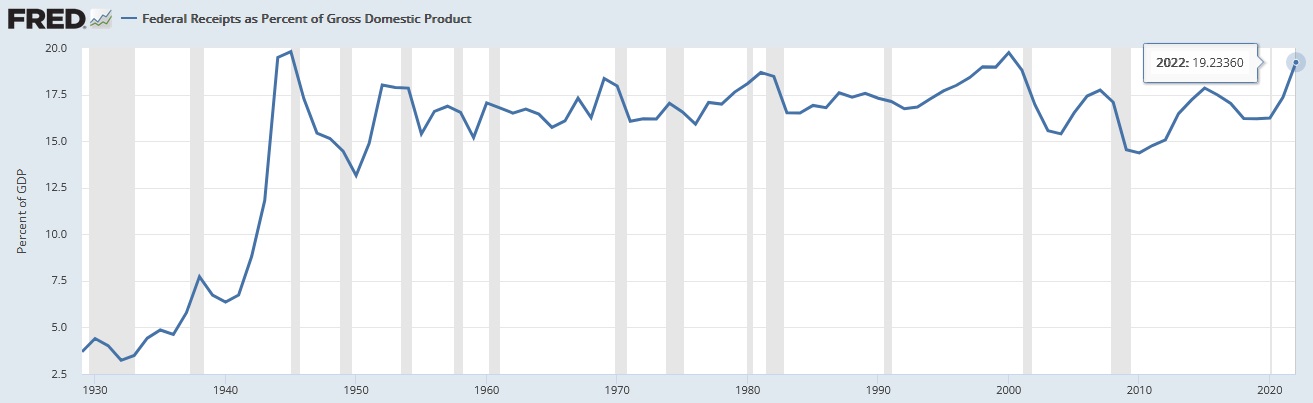
Over the decades, the collection percentage ebbed and flowed, but all the political rhetoric and tax-law changes over the years aside, the collection percentage has been somewhat range-bound between 15% and 20% of nominal GDP. And most recently, in 2022, collections hit the high-water mark of 19.23%.
Interesting, right? Now that nominal GDP is up significantly from the pre-pandemic period ending on January 1st, 2020, it follows that the US Treasury tax collections will also increase significantly. Below are the Congressional Budget Office projections for both ‘Revenues’ and ‘Outlays’ over the next three (3) decades:
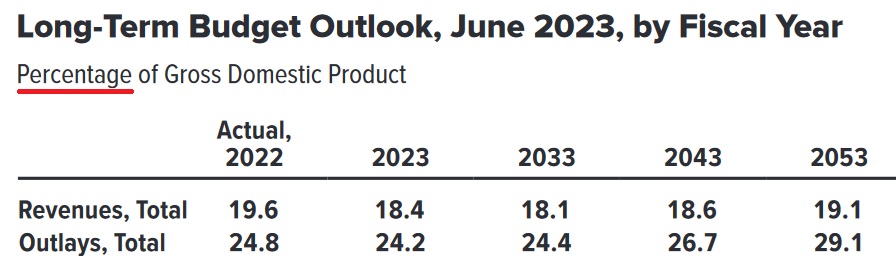
Of course, the one thing we know for sure is the 2053 numbers are wrong. And probably the 2043 figures as well. Forecasts that far out are never accurate.
It is interesting to see that the CBO expects tax collections to drop to 18.4% of GDP in 2023. Regardless, that figure is significantly higher than the 16.2% collection rate in 2019. Doing the math, that suggests that collections in 2019 clocked in at around $3.5 trillion and in 2023 should rise up to almost $4.9. Good news for the US Treasury.
Of course, all this good news does increase the odds of another FED rate increase. You’ll recall a few weeks ago I opined that the FED rate hikes are over. I remain convinced that’s still the case. I do not believe the FED will raise again during this cycle. Q1’s economic strength notwithstanding, we’re now in the beginning of Q3 and the bite marks from the already experienced, oversized hikes were not baked into the economy during Q1. In fact, in my opinion because all duration (short to long term) rates were so low, for so long, and such a large chunk of both consumer and corporate debt is fixed-rate debt, it will take longer this cycle for the hikes to take a chunk out of the economy.
Recent SHI results have suggested the economy is slowing. Let’s look at today’s numbers.
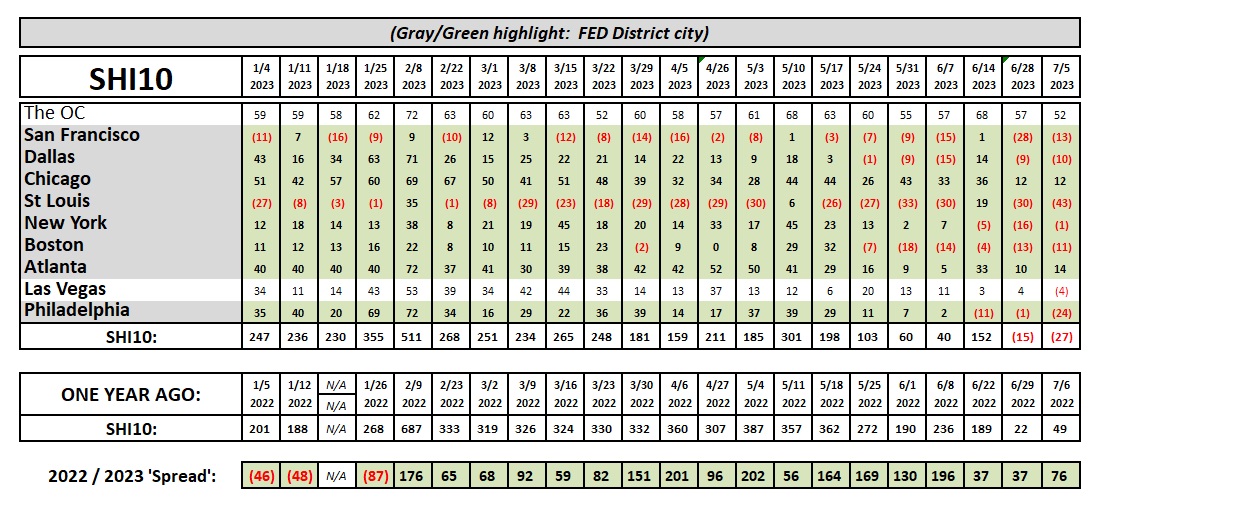
The weakening trend continues. Not significantly, of course, but directionally. Opulent steak house reservation demand is down this week in most SHI markets. It’s worth noting the continue erosion of demand in Las Vegas. Demand was consistently strong thru the end of Q1. Erosion began in earnest during Q2 … and the SHI just turned negative as Q3 begins. This is an important trend and distinction inasmuch as Las Vegas, more than any other SHI city, represents truly discretional consumer spending. Weakness here speaks volumes.
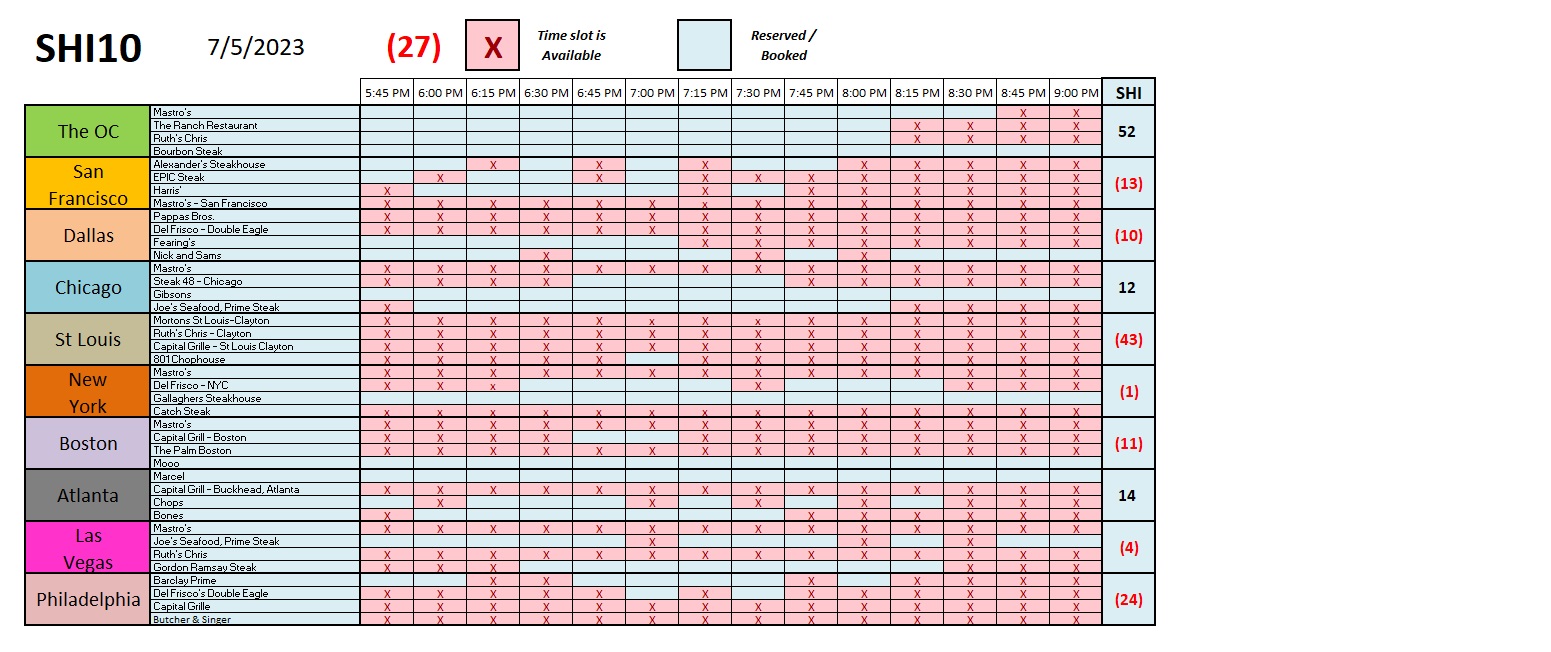
Of the 56 ‘available’ reservation time slots in St Louis, only one is unavailable on Saturday. 55 slots are wide open … waiting for your call! (Or click on OpenTable.com) If you never, ever take anything else away from my blog, take this:
DO NOT INVEST IN, OR OPEN, AN EXPENSIVE STEAKHOUSE IN ST LOUIS! 🙂
Here’s the individual restaurant chart for our 10 SHI cities:
The FED released ‘minutes’ from their June meeting earlier today. On the topic of interest rates within the economy, and their impact, they made these comments:
In domestic credit markets, borrowing costs for businesses, households, and municipalities increased notably over the intermeeting period. Interest rates on newly originated bank loans to businesses and households in the first quarter rose further above their peaks from the previous tightening cycle, and yields on leveraged loans also rose, reaching levels close to their peak at the onset of the pandemic. Rates also moved up on a broad array of fixed-income securities, including investment- and speculative-grade corporate bonds, municipal bonds, both agency and non-agency commercial mortgage-backed securities (CMBS), and agency residential mortgage-backed securities. The increases in yields on these instruments over the intermeeting period were generally in line with, or less than, the changes in their Treasury benchmarks. Small businesses and households saw continued increases in their borrowing costs. Rates on 30-year conforming residential mortgages stepped up, broadly in line with increases in comparable-duration Treasury yields. Interest rates on credit card offers continued to rise through April, and auto loan interest rates moved sideways during the intermeeting period.
Both credit card and auto loan interest rates stood at, or near, their highest levels since the Global Financial Crisis.
For context, the ‘Global Financial Crisis’ they refer to was in 2007. So rates are at or near their highest levels in over 15 years. Rates are showing their teeth and are chewing into disposable incomes. I expect the slowdown we’re experiencing to get legs during the next quarter or two. But I remain streadfast in my believe that (1) rate increases are over and (2) a recession remains unlikely. Remember, we can still have a positive GDP and economic expansion, even if the rate of growth is lower.
<:> Terry Liebman


