
SHI 6.3.20 – Disasters: Natural and Unnatural

SHI 5.27.20 – Climbing the Mountain
May 27, 2020
SHI 6.10.2020 – Goodbye Old Friend
June 10, 2020
What a mess. A global pandemic, staggering world-wide unemployment, the “coming soon” tidal wave of corporate and personal bankruptcies, food lines across the country, and now this. As the world’s economies struggle under the weight of a once-in-a-century pandemic, the ugly face of US racism appears once again, triggering peaceful protests but also unrest and extensive looting.
Our economy now faces far greater social and economic obstacles than just one week ago. And we have to wonder how long, and how deep, the impact will prove on our once thriving economy. But while ‘Rome is burning’ and Nero fiddles, the stock markets are back to near all-time highs. What the heck is going on?
” So how can the S&P 500 be within spitting distance of its all-time high? “
I mean, US economic data is ugly. Really ugly. REAAAALLLLY ugly. Look at the most recent ‘Nowcast‘ from NY FED:
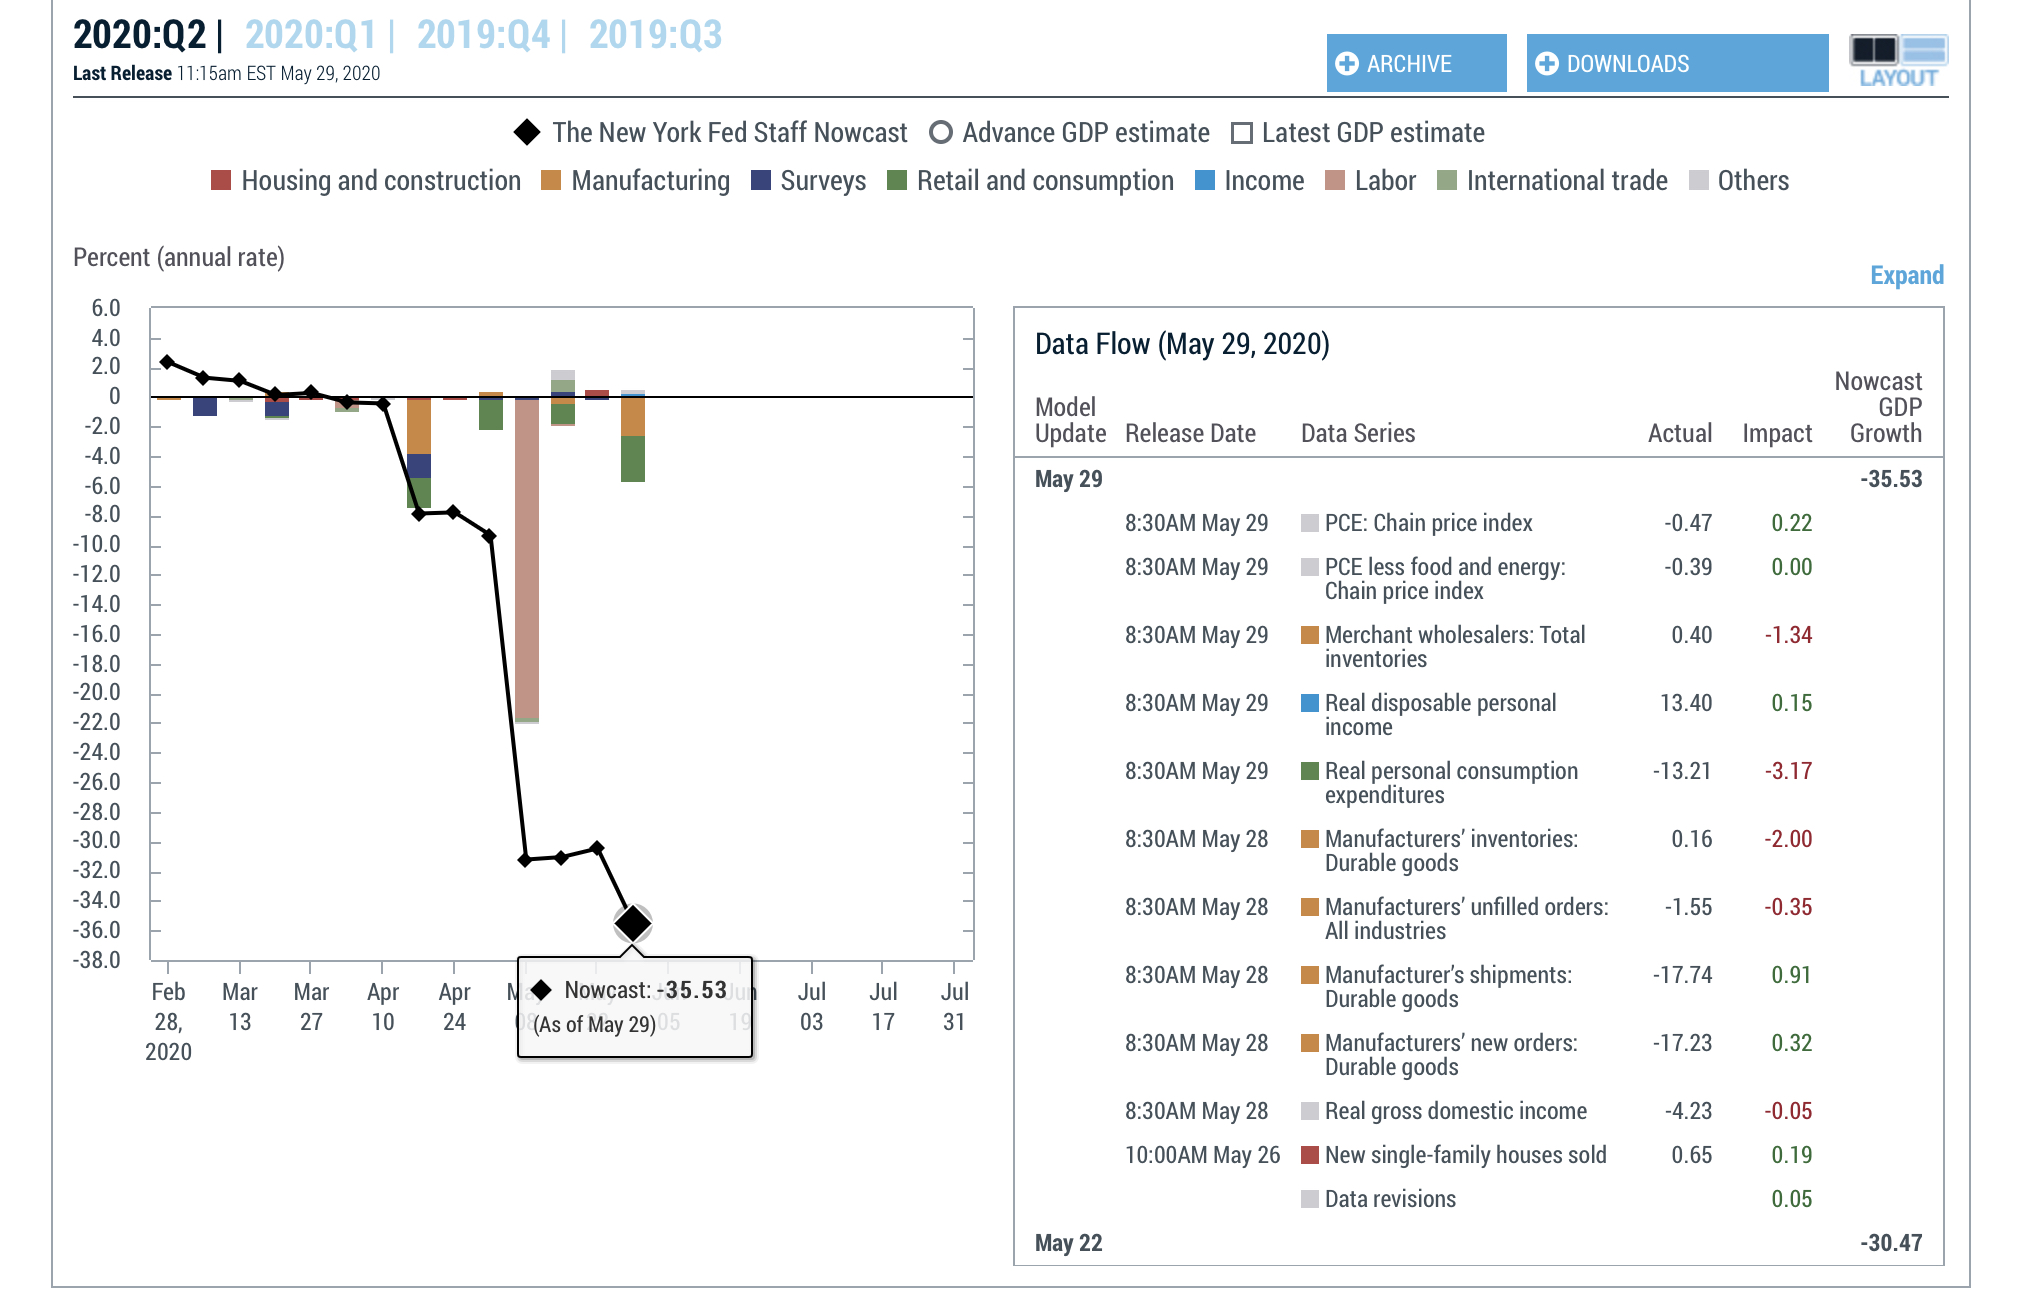
I thought last week’s forecast — a Q2, 2020 GDP decline of 30.47% (on an annualized basis) was bad — but this week is worse: The Nowcast expects a 35.53% decline in Q2 GDP. So I’ll ask again: How the heck can the stock markets be nearing their all-time highs? I may have an answer for you. Read on.
Welcome to this week’s Steak House Index update.
If you are new to my blog, or you need a refresher on the SHI10, or its objective and methodology, I suggest you open and read the original BLOG: https://www.steakhouseindex.com/move-over-big-mac-index-here-comes-the-steak-house-index/
Why You Should Care: The US economy and US dollar are the bedrock of the world’s economy.
But is the US economy expanding or contracting?
Before COVID-19, the world’s annual GDP was about $85 trillion today. No longer. It has shrunk sizable during ‘The Great Lockdown.’ I did not coin this phrase — the IMF did. The same folks who track global GDP. Until recently, annual US GDP exceeded $21.7 trillion. Together, the U.S., the EU and China still generate about 70% of the global economic output.
The objective of this blog is singular.
It attempts to predict the direction of our GDP ahead of official economic releases. Historically, ‘personal consumption expenditures,’ or PCE, has been the largest component of US GDP growth — typically about 2/3 of all GDP growth. In fact, the majority of all GDP increases (or declines) usually results from (increases or decreases in) consumer spending. Consumer spending is clearly a critical financial metric. In all likelihood, the most important financial metric. The Steak House Index focuses right here … on the “consumer spending” metric. I intend the SHI10 is to be predictive, anticipating where the economy is going – not where it’s been.
Taking action: Keep up with this weekly BLOG update. Not only will we cover the SHI and SHI10, but we’ll explore related items of economic importance.
If the SHI10 index moves appreciably -– either showing massive improvement or significant declines –- indicating growing economic strength or a potential recession, we’ll discuss possible actions at that time.
The BLOG:
The answer to the question, I believe, is simple. The answer is a slight twist on the economic principal of the ‘substitution effect.’ What is the substitution effect? If we google it, we see this definition from our friends at Investopedia:
“The substitution effect is the decrease in sales for a product that can be attributed to consumers switching to cheaper alternatives when its price rises. A product may lose market share for many reasons, but the substitution effect is purely a reflection of frugality.”
What “product” is experiencing a decrease? Financial products with an ultra-low yield. Consider this headline from an article in the London Financial Times posted on May 28th:
“US money market funds waive fees to stave off negative returns.”
Wow. TIAA-CREF manages some of the largest money market funds in the world, and they recently waived fees on some of their products. Per the article, last week TIAA’s money market fund with over $12.3 billion in assets had an annualized yield of a whopping 0.06%. That’s just about zero, folks. So, sure, I envision customers leaving in droves if their yields moved into negative territory. That hasn’t happened yet…so far the asset levels are remaining fairly stable. But let me give you some advice:
GET YOUR MONEY OUT OF MONEY MARKET FUNDS. NOW. INTO CASH. AT YOUR BANK.
Why? Out of an abundance of caution … and the fact that you’re NOT being paid to take any risk. What risks might you have in money market funds? Probably none. Because the FED will likely prevent any bad outcome. But if a bunch of people run for the exits at the same time, which tends to happen when investors get spooked, and the fund is forced to quickly liquidate massive positions, you may find yourself with a $1.00 money market share that is no longer worth a buck. My 2 cents.
But should you move some of your money into the stock markets? Can you get a positive return there?
Maybe. Common stock in well-established companies can pay a 2% – 3% dividend (or more) … and throughout history, over time, markets tend to rise. So while a stock market investment has the inherent risk of “loss of capital,” at least you’re getting paid to take that risk. On the other hand, the data underlying the stock markets look pretty grim, too. U-G-L-Y.
Consider this chart from our associates at FactSet:
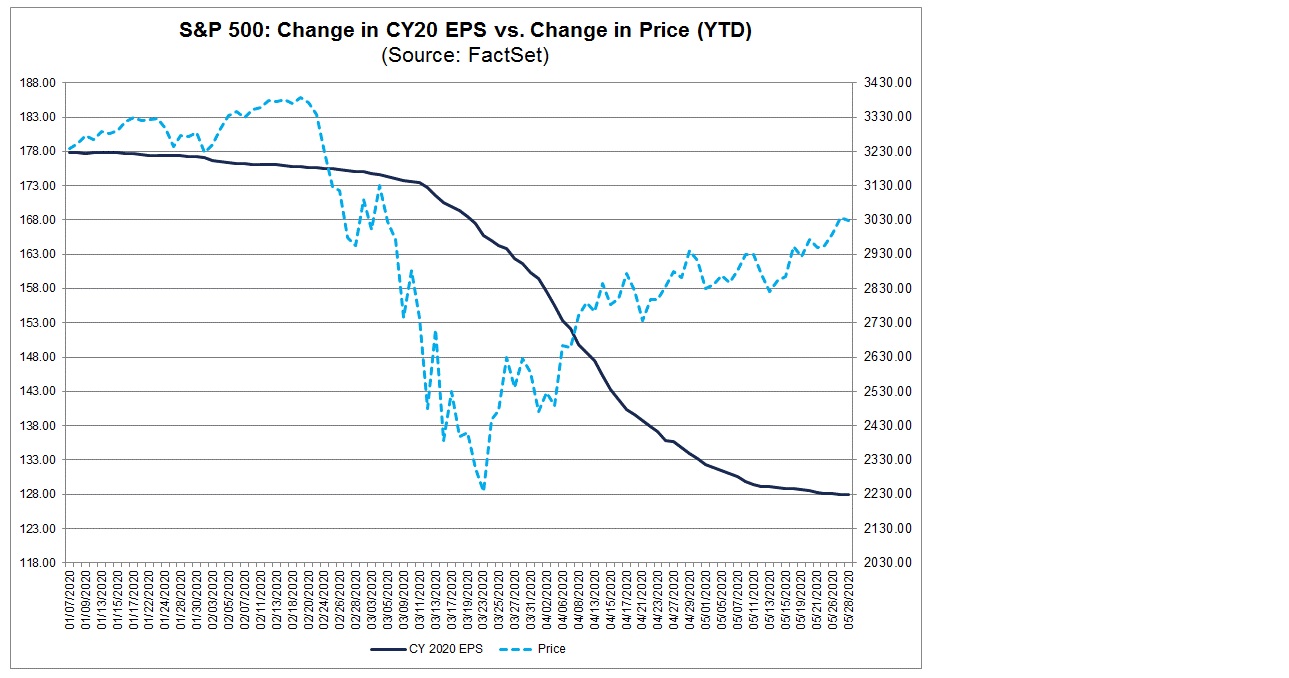
This chart is 2 days old. The S&P is even higher today. But this chart is mind-numbingly baffling thru any other lens except the substitution effect theory. How else can you explain the rise in the S&P 500 stocks (blue line) against the forecasted massive decline (black line) in ‘current year’ earnings per share (EPS)? In theory, both lines should be moving in tandem.
Of course, the markets are support by a bit of positive data. For example, even as the ‘Great Lockdown’ continues, people here in the US are moving around once again. Take a look at this chart courtesy of JP Morgan:
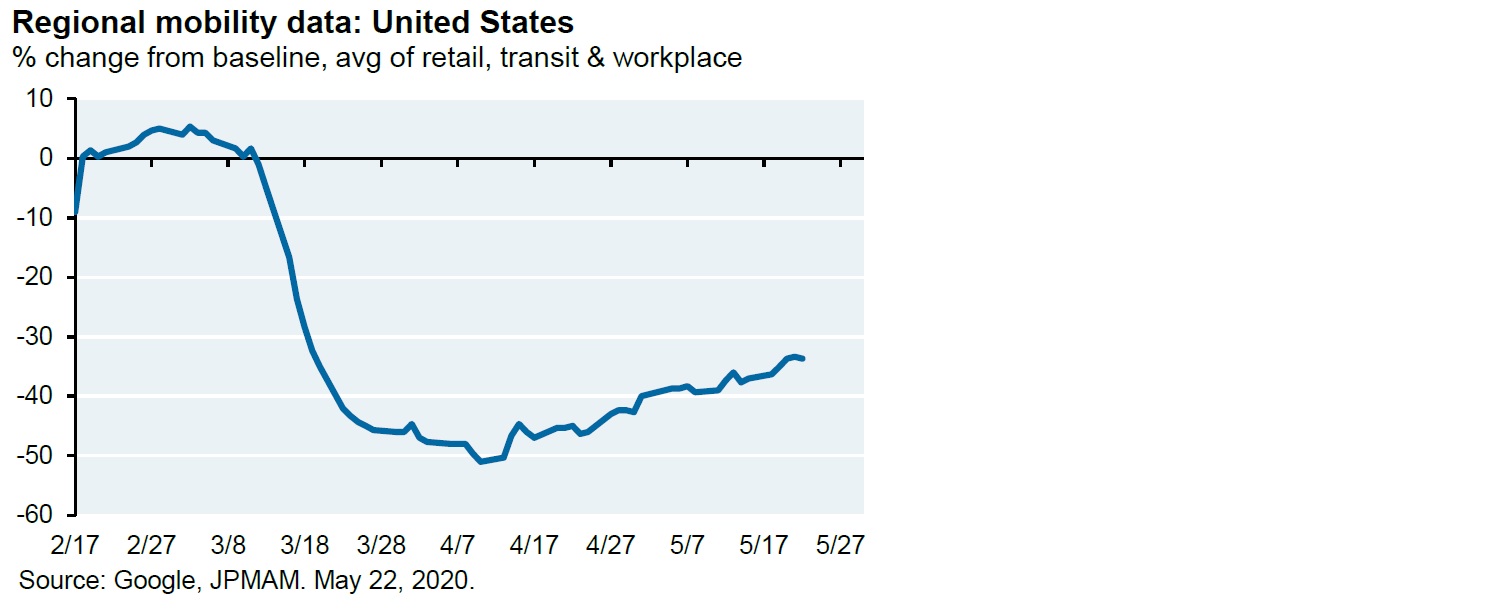
From a low-point around of about negative 50% in early April, US mobility has recovered meaningfully. Don’t get me wrong: Current levels are dreadful when compared to early February. But at least we see positive movement. And we’re seeing similar changes in European mobility. Once again, a chart courtesy of our friends at JP Morgan:
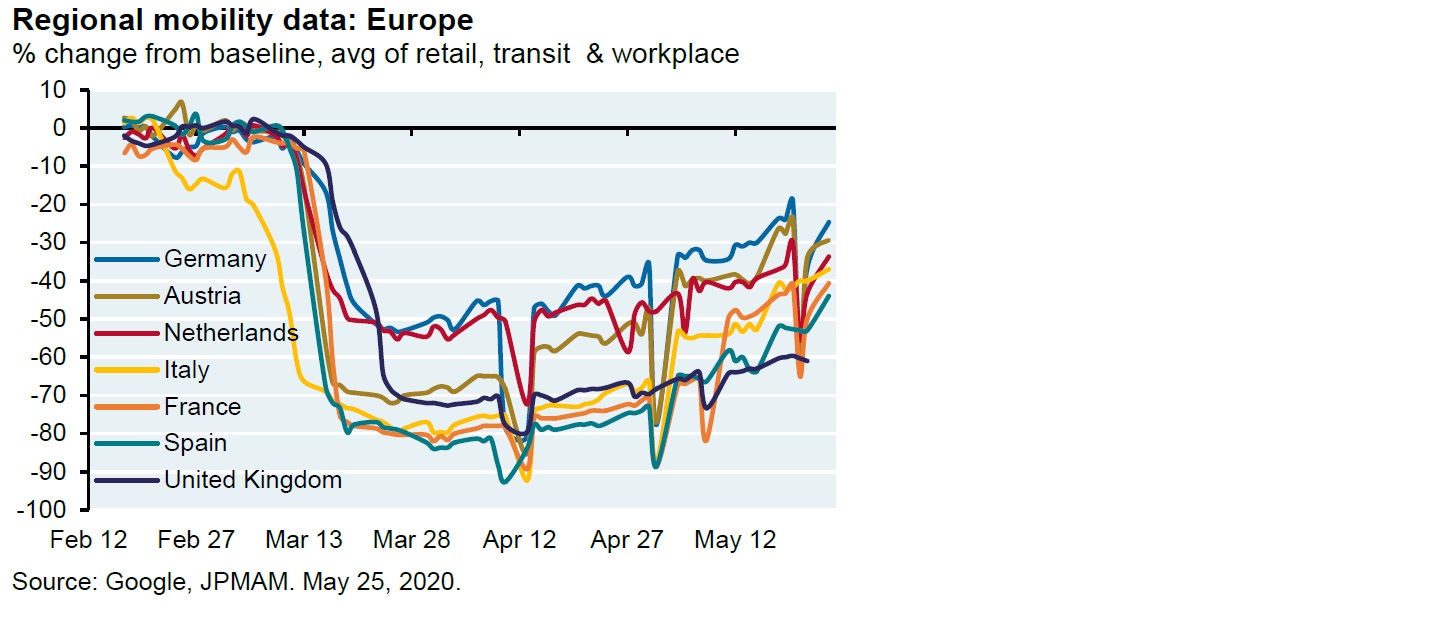
All across the advanced economies of western Europe, people are moving around more and more as time passes. Look at that dip around April 12th … mobility was down over 90% in many countries. Staggering. And then, in late-May, mobility in Germany was down only about 25%. Good.
Heading back to the good ‘ol US of A, below is another telling chart from JPM. It’s interesting to “see” a nascent recover in business applications, rail traffic and hotel occupancy rates. And I’m not surprised to see “TSA checkpoint travelers” still near all-time lows:
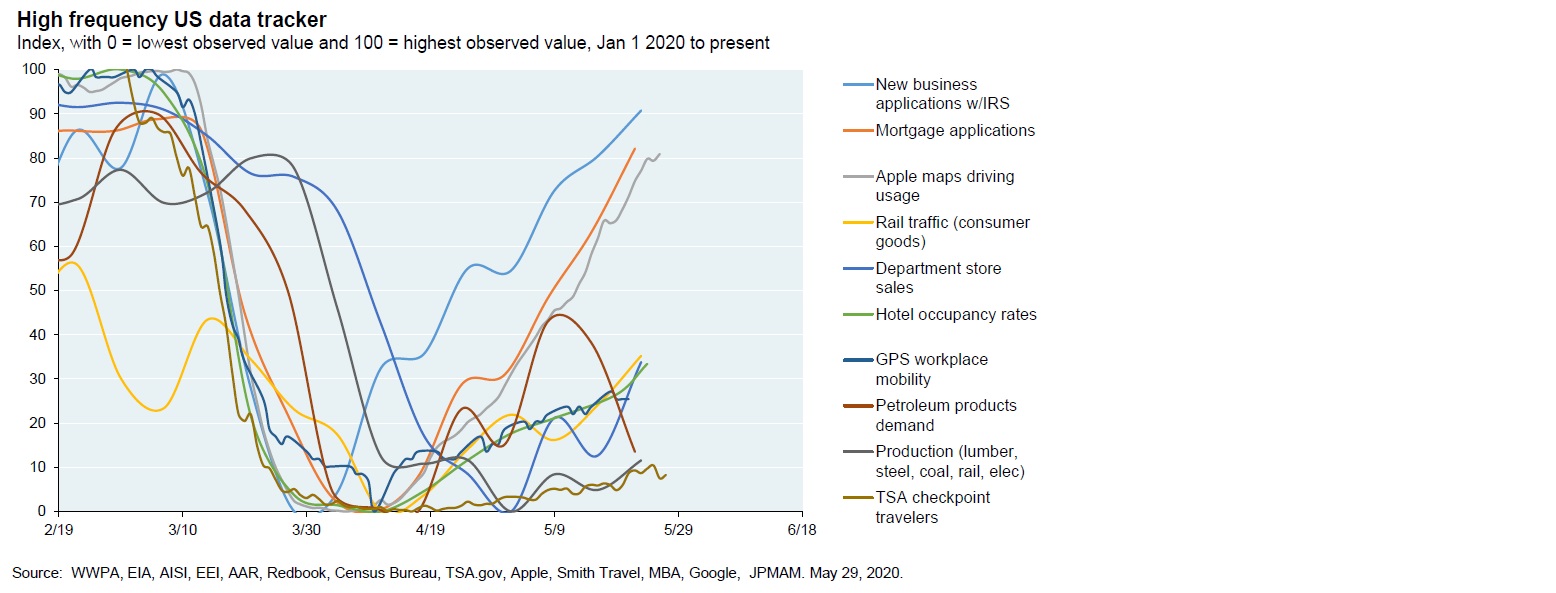
The curves on the chart above are all going in the right direction. However, all this data alone does not support the recent upward moves in the stock markets. It provides support and a backdrop, but I continue to believe the movement must be primarily explained by the paucity of investment alternatives. Given the dismal “ROI landscape” we see in just about every other asset class, the stock markets look pretty darn good right about now! Especially with the monetary and fiscal support from the FED, the US Treasury and just about every other government on the planet.
By the way, you recall this blog is called the Steak House Index? The operative words being “steak house?” Well, checking my data set earlier today, it appears many of our steak houses are opening up once again. Not all, and not yet, but many. So, very soon I may be able to restart that index! Exciting, right?
Perhaps next week! Until then, be well.
– Terry Liebman


