
SHI 8.19.10 – Unemployment and Economic Expansion

SHI 8.12.20 – Not Thinking About Thinking
August 12, 2020
SHI 8.26.20 – Halley’s Comet
August 26, 2020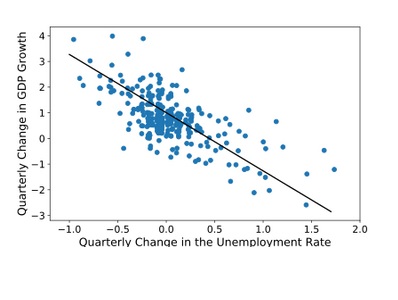
The United States ‘Bureau of Labor Statistics’, also known as the BLS, tells us 10.2% of the labor force was unemployed in July. While the percentage sounds bad, the actual number sounds, and is, much worse: Over 16.3 million Americans are officially unemployed today. Compare and contrast these numbers to the same metrics from more than a decade ago, in October of 2009, just a few months after the ‘Great Recession’ officially ended:
- Unemployment Rate: 10.2%
- Unemployed Persons: 15.7 million
The October 2009 unemployment rate was the highest since early in 1983, when the number of unemployed persons was 11.3 million. You have to go back in time to the Great Depression to beat these depressing numbers. Let me repeat: There are more people unemployed today than at any time since the Great Depression.
And yet, today, the DJIA, the S&P500 and the NASDAQ are all at or near their highest levels ever. You probably remember that during the ‘Great Recession’ of 2007, home values plummeted. The speed and size of the decline was absolutely staggering. Not today. Today, home values are rising. Here is the headline from a press release by the National Association of Realtors, also known as the NAR, on July 22:
Existing-Home Sales Climb Record 20.7% in June
Wow. In that same press release: “The median existing-home price for all housing types in June was $295,300, up 3.5% from June 2019 ($285,400), as prices rose in every region. June’s national price increase marks 100 straight months of year-over-year gains.” Amazing. 100 straight months of increased value. And in every region of the US.
” How can this be? “
Let me recap: Stock prices and home prices are at or near all-time highs, while, at the same time, so is the number of unemployed Americans. Current economic theories suggest this outcome is not only improbably, they assure us this outcome is probably impossible given the unemployment levels … yet it has happened. The impossible has just happened. It’s happening right now. How?
Welcome to this week’s Steak House Index update.
If you are new to my blog, or you need a refresher on the SHI10, or its objective and methodology, I suggest you open and read the original BLOG: https://www.steakhouseindex.com/move-over-big-mac-index-here-comes-the-steak-house-index/
Why You Should Care: The US economy and US dollar are the bedrock of the world’s economy.
But is the US economy expanding or contracting?
Before COVID-19, the world’s annual GDP was about $85 trillion. No longer. It will shrink thanks to ‘The Great Lockdown.’ I did not coin this phrase — the IMF did. The same folks who track global GDP. Until recently, annual US GDP exceeded $21.7 trillion. Again, no longer. But what has not changed is the fact that together, the U.S., the EU and China still generate about 70% of the global economic output.
The objective of this blog is singular.
It attempts to predict the direction of our GDP ahead of official economic releases. Historically, ‘personal consumption expenditures,’ or PCE, has been the largest component of US GDP growth — typically about 2/3 of all GDP growth. In fact, the majority of all GDP increases (or declines) usually results from (increases or decreases in) consumer spending. Consumer spending is clearly a critical financial metric. In all likelihood, the most important financial metric. The Steak House Index focuses right here … on the “consumer spending” metric. I intend the SHI10 is to be predictive, anticipating where the economy is going – not where it’s been.
Taking action: Keep up with this weekly BLOG update. Not only will we cover the SHI and SHI10, but we’ll explore related items of economic importance.
If the SHI10 index moves appreciably -– either showing massive improvement or significant declines –- indicating growing economic strength or a potential recession, we’ll discuss possible actions at that time.
The BLOG:
Andrew Ross Sorkin, a CNBC anchor and NY Times author, suggests there are five (5) reasons why the stock markets are in rally mode:
- Looking past bad news today and anticipating better conditions 12 to 18 months from now.
- The continued good fortunes of a few big tech companies.
- An almighty market pop that would arise from news of a vaccine breakthrough.
- An accommodating Fed printing money and keeping rates low.
- The hope that Congress overcomes its divisions and pumps the economy with more stimulus.
I agree with all 5 of his points. And I would add a sixth.
Okun’s law, named after Arthur Okun back in 1962, observed a highly-correlated relationship between changes in the unemployment rate and GDP growth. Simply stated, and as we see from the scatter graph below, as the unemployment rate increases, GDP growth theoretically decreases. And visa versa.
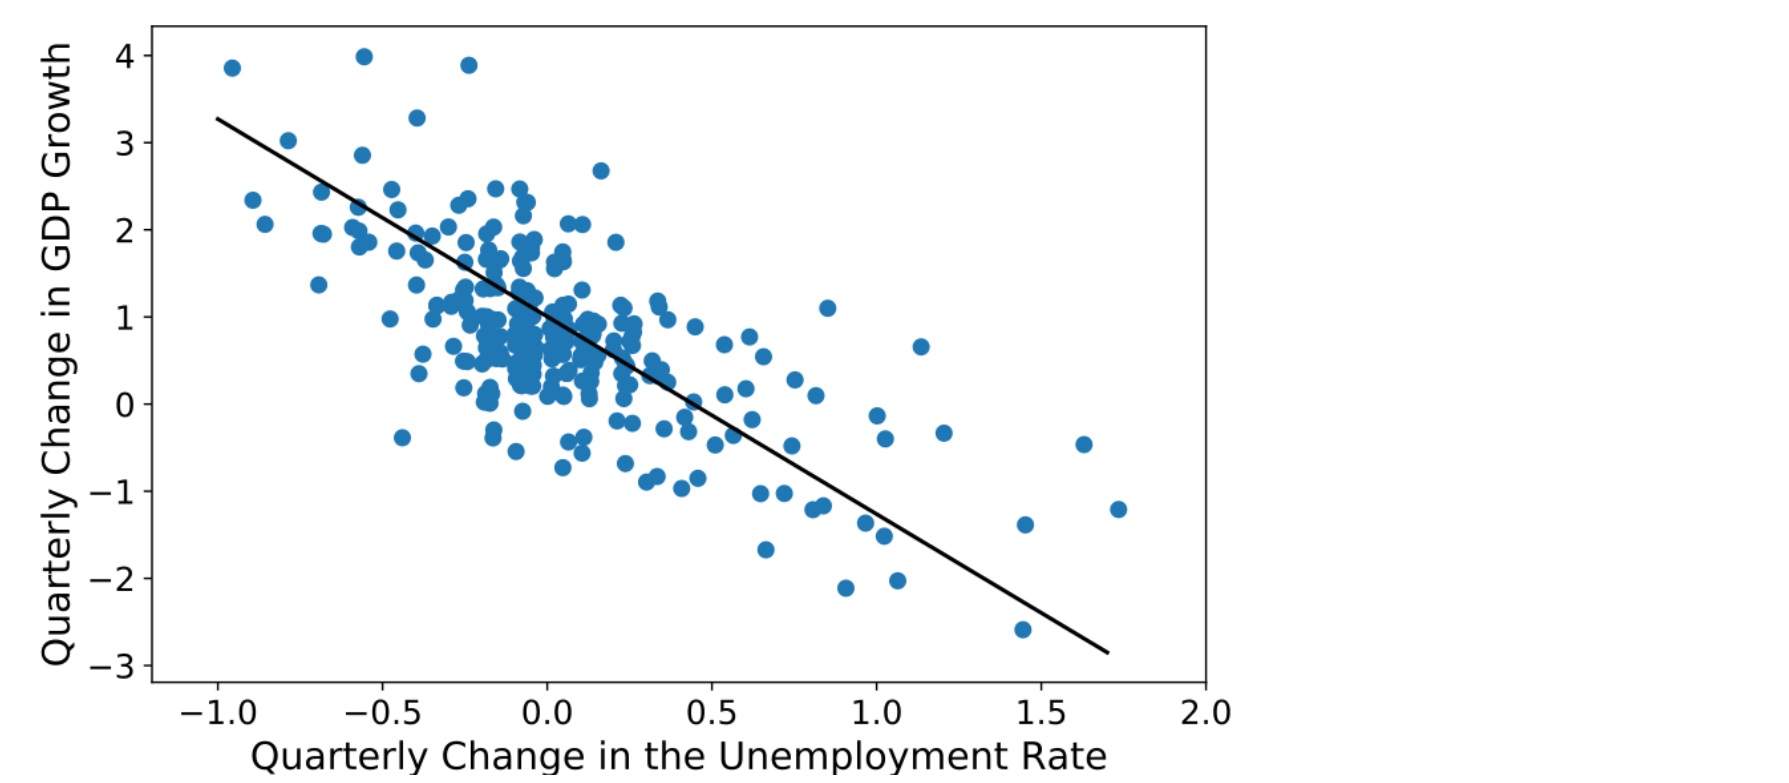
The relationship between GDP growth and the unemployment rate has remained fairly consistent and predictable for decades. But this relationship appears to be changing right before our eyes. Today, we’re witnessing a roaring stock market and increasing home values — two strong indicators of economic growth — while, at the same time, experiencing one of the highest unemployment levels in modern history.
In 1939, John Maynard Keynes, the father of the promient Keynesian economic theory we rely on today, told us this outcome is impossible. Because if the labor force is struggling, the country’s economic output would also struggle. Keynes believed the relationship between labor and output was static and factual. Unchanging. In Keynes words, “The stability of the proportion of the national dividend accruing to labor…is one of the most surprising, yet best-established, facts in the whole range of economic statistics, both for Great Britain and the United States.”
Unfortunately, I believe this “fact” is no longer factual — and hasn’t been for decades. Human labor, as a contributing factor to economic output, has been declining for years. I’ve touched on this topic in many prior blogs. You’ll recall I’ve proven that while the historic and traditional “population pyramid” has morphed from, well, a pyramid into more of a cylinder, thereby depriving advanced economies of the growing labor force historically required to maintain high levels of productivity and GDP growth, at the same time automation and artificial intelligence have filled in the labor gaps, and even reduced the need for many types of jobs. Sorry. That’s a long sentence. Let me say this another, shorter way: Today, developed economies need fewer workers to support and generate their GDP growth. Okum’s law and some of Keynes theories, unfortunately, are falling to the side of the economic road. They no longer work today.
Larry Summers, past US Treasury Secretary and Harvard University Professor, wrote an interesting paper discussing this fact in June. From his paper: “… labor rents have declined substantially: from 12% of net value added in the U.S. nonfinancial corporate sector in the early 1980s to 6% in the 2010s.” (The term labor rent is the author’s way of suggesting that labor used in GDP production is ‘rented.’)
Said another way, the “value” that labor adds to US GDP has declined by about half — from 12% to 6% — in the past 4 or so decades. This chart, while a bit dense, shows the “decline in labor rents” since 1982:
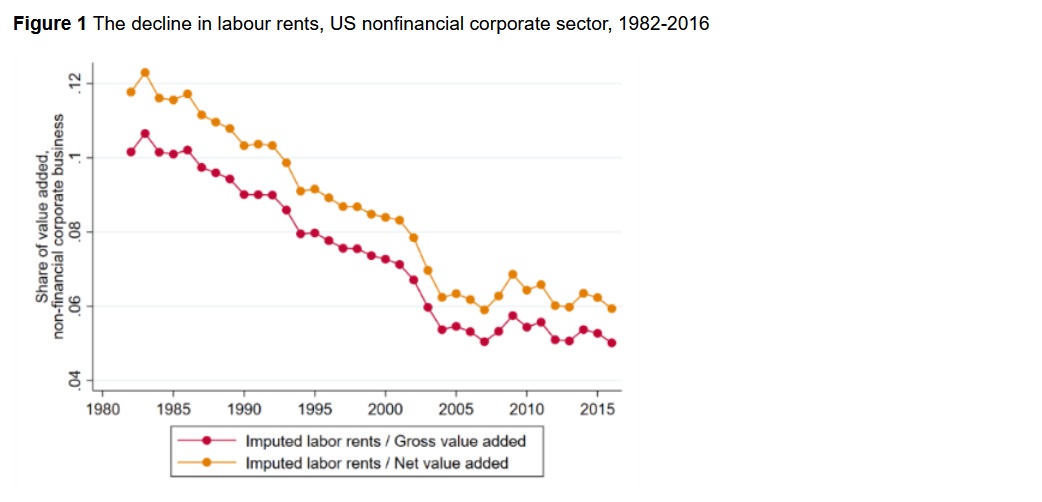
Note the graph encompasses data only thru 2016. Other reports suggest the trend has accelerated since that time. Here’s a link to his paper if you’re interested:
https://voxeu.org/article/declining-worker-power-versus-rising-monopoly-power
My point is this: Historically, today’s unemployment levels would have significantly damaged the country’s economic output. But no longer.
Right about now you’re probably thinking A-HA! You, sir, are wrong! The US economy was absolutely destroyed in Q2 of 2020. You are correct. It was. According to the BEA, “real GDP decreased at an annual rate of 32.9 percent in the second quarter of 2020.” That’s the largest decline on record. But while both the economic destruction and massive unemployment happened at the same time, I don’t think one caused the other. Remember, correlation is not the same as causation.
I think the pandemic has triggered a more rapid acceleration in two (2) very different, very long-term trends. Trends that have been developing for years. First, I think we’re seeing an accelerated erosion in the value of labor as a production input. Summers talks about this fact in detail in his paper. Second, I believe we’re witnessing a labor-force bifurcation, where the value of certain labor groups to overall economic growth is being, or has been, diminished, while others have been enhanced. At least for the moment.
Which groups have been diminished in value within our economy? Here are the “industry sectors” that have experienced massive job losses in the past 12 months, according to the BLS in their Table B-1 addendum to the ‘Employment Situation’ report released a few weeks ago:
- Leisure and hospitality: Almost 5 million jobs lost in the past year.
- Administrative and waste services: Almost 1.2 million jobs lost with about 500,000 of this number from ‘Temporary help services’ and about 300,000 from the group called ‘Services to buildings and dwellings.’
- Health cares and social assistance: Almost 900,000 jobs lost.
- Professional and technical services: About 300,000 jobs lost. (But almost no change in the ‘Legal services’ group.)
- Publishing Industries (not including the internet): About 300,000 jobs lost.
- Clothing and Clothing Accessory Stores: About 300,000 jobs lost equal to 25% of the category.
I believe you’ll agree that the vast majority of these jobs are low wage. Meaning that when they are lost, the overall economic effect is smaller than had they been high-wage jobs. Which, I believe, is why homes continue to sell and the markets continue to rise, in spite of the massive unemployment problem. Of course, the fact that interest rates are pegged near zero is a huge economic tailwind, too.
Job losses in the ‘Leisure and hospitality’ segment, of course, are the result of the pandemic and the Great Shutdown. Many of these jobs should return, relatively quickly, after a vaccine is widely distributed. At least, that is my expectation and hope.
And while the structural changes in our economy may have reduced the impact of the unemployment problem, from a economic perspective at least, it’s still a serious human problem. Which is why these folks need to continue to receive a federal unemployment subsidy. Probably not $600 per week, in my opinion, but probably a number that’s close to 2/3 of this figure. And over time, we’re going to have to deal with the larger, structural economic and human issue. Consider this: According the the BLS, the United States now has over 100 million folks that are “not in the labor force.” Yes, this number includes many retirees, but it also includes many younger people made somewhat irrelevant by automation and AI, among other things. 100 million folks. Wow. And this number is growing each year.
The developed world has some issues to grapple with. The pandemic did not cause these structural problems…. but it did accelerate the longer-term trends that began decades ago. Put on your thinking caps, folks. We need some creative solutions.
– Terry Liebman


