
SHI 8.26.20 – Halley’s Comet

SHI 8.19.10 – Unemployment and Economic Expansion
August 19, 2020
SHI 9.2.20 – With Little Fanfare, A New Era Arrives
September 2, 2020
Have you ever seen it? Perhaps you have, but I imagine not, because it is visible from Earth only once every 75 years. Your next opportunity: July 28, 2061.
Well, I doubt you’ve seen this either: Check out the image above. The IMF is forecasting that when 2020 finishes, China alone will have an expanding economy … and every other major economy will shrink. Take another look at the image above. The IMF believes the US economy will contract by 8% in 2020. This would be a shocking, unprecedented result. If this proves true, this outcome would be more rare than a Halley’s Comet sighting.
” Is the IMF correct? Will US GDP shrink in 2020? “
In a word, no. I don’t believe they are. Because empirical data suggests that in spite of the massive obstacles we face, when the year is over, the US economy may actually show positive 2020 GDP growth. And given the path taken to get there, this outcome may be even more surprising than seeing Halley’s Comet.
Welcome to this week’s Steak House Index update.
If you are new to my blog, or you need a refresher on the SHI10, or its objective and methodology, I suggest you open and read the original BLOG: https://www.steakhouseindex.com/move-over-big-mac-index-here-comes-the-steak-house-index/
Why You Should Care: The US economy and US dollar are the bedrock of the world’s economy.
But is the US economy expanding or contracting?
Before COVID-19, the world’s annual GDP was about $85 trillion. No longer. It will shrink thanks to ‘The Great Lockdown.’ I did not coin this phrase — the IMF did. The same folks who track global GDP. Until recently, annual US GDP exceeded $21.7 trillion. Again, no longer. But what has not changed is the fact that together, the U.S., the EU and China still generate about 70% of the global economic output.
The objective of this blog is singular.
It attempts to predict the direction of our GDP ahead of official economic releases. Historically, ‘personal consumption expenditures,’ or PCE, has been the largest component of US GDP growth — typically about 2/3 of all GDP growth. In fact, the majority of all GDP increases (or declines) usually results from (increases or decreases in) consumer spending. Consumer spending is clearly a critical financial metric. In all likelihood, the most important financial metric. The Steak House Index focuses right here … on the “consumer spending” metric. I intend the SHI10 is to be predictive, anticipating where the economy is going – not where it’s been.
Taking action: Keep up with this weekly BLOG update. Not only will we cover the SHI and SHI10, but we’ll explore related items of economic importance.
If the SHI10 index moves appreciably -– either showing massive improvement or significant declines –- indicating growing economic strength or a potential recession, we’ll discuss possible actions at that time.
The BLOG:
So, you’re probably wondering, ‘how can Terry possibly disagree with the IMF?’ After all, they are so large and important … and he is so insignificant in comparison?!? 🙂
True. And if we consider the most current actual economic results, my forecast might seem even more outlandish. Consider these figures, taken from the most recent issue of The Economist magazine:
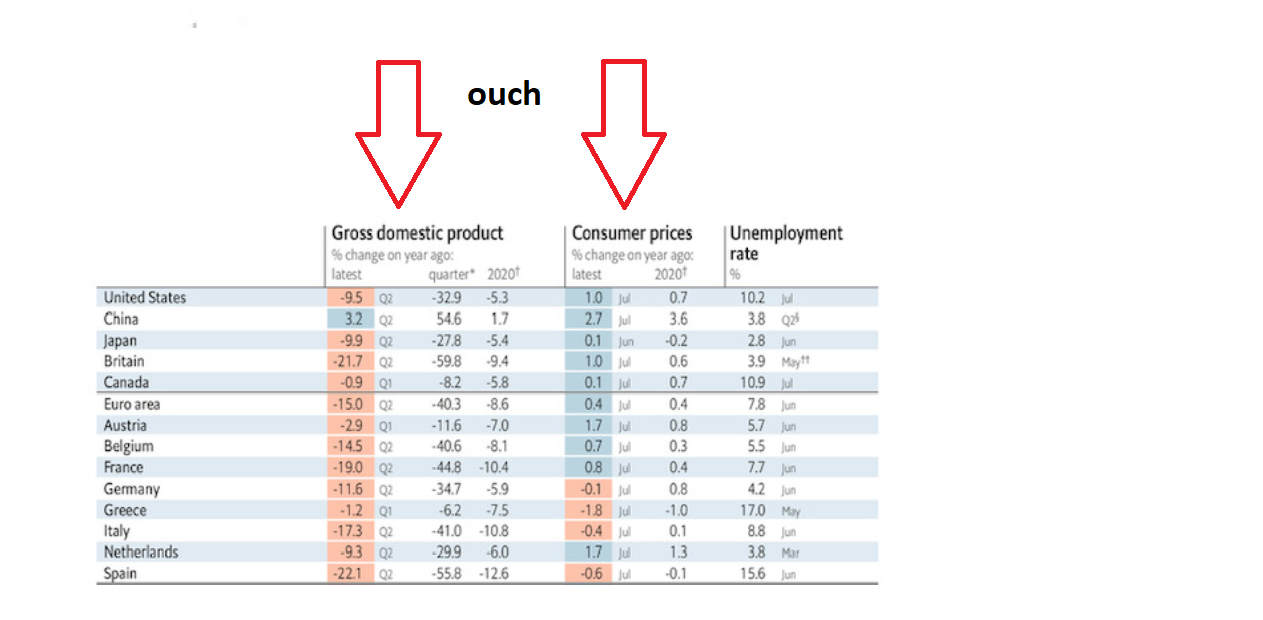
Thru the end of Q2, 2020, every country tracked on the chart above, save one, has experienced contracting GDP. Only China had a growing economy in the second quarter of the year. While, at the same time, the Euro area shrunk at an annualized rate of over 40% and the US by almost 33%. Ouch! Take another look at the chart … and check out the consumer price — inflation — numbers. At present, Germany, Greece, Italy and Spain are experiencing deflation. Big ouch.
In light of these facts, how can I make the bold prediction that by the years end, US 2020 GDP growth will be either “flat” or moderately positive? I have a number of economic reasons, but I’ll discuss just three (3) here today: New and existing home sales, the surprising US savings rate, and an interesting Citibank metric.
New homes are selling in unprecedented numbers. Frankly, I find this fascinating and quite surprising. Quoting one well-known economist, this outcome is “basically not just V-shaped recovery, but blowing through the pre-pandemic trend.” Housing sales are a very solid economic indicator. New home construction is responsible for about 8% of US GDP. And in the aggregate, considering all the knock-on effects from housing activities such as home improvement, renovation, commissions, durable goods sales (Home Depot), etc., the number can be as large as 20% of US GDP. Keep this in mind as you consider the chart below:
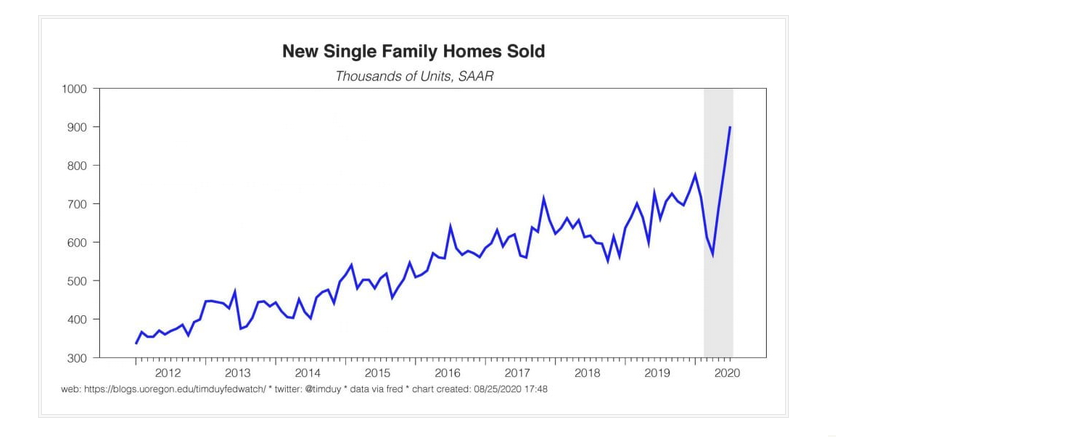
Wow! New homes are flying off the shelf. In fact, according to data just released by the US Census Bureau, new home sales soared 13.9% in July, to the highest level of new home sales since 2006. This outcome would be surprising under any circumstances, but is very unusual at the beginning of a recession. Extremely rare. When did we see it last? The answer is before the last sighting of Halley’s Comet — we have to go back in time to the 11-month recession that began in December of 1969, more than 50 years ago. It’s worth noting that we’re seeing the same extraordinary activity in ‘existing home sales.’ According to the National Association of Realtors, existing home sales climbed “a record 20.7%” in June. Staggering.
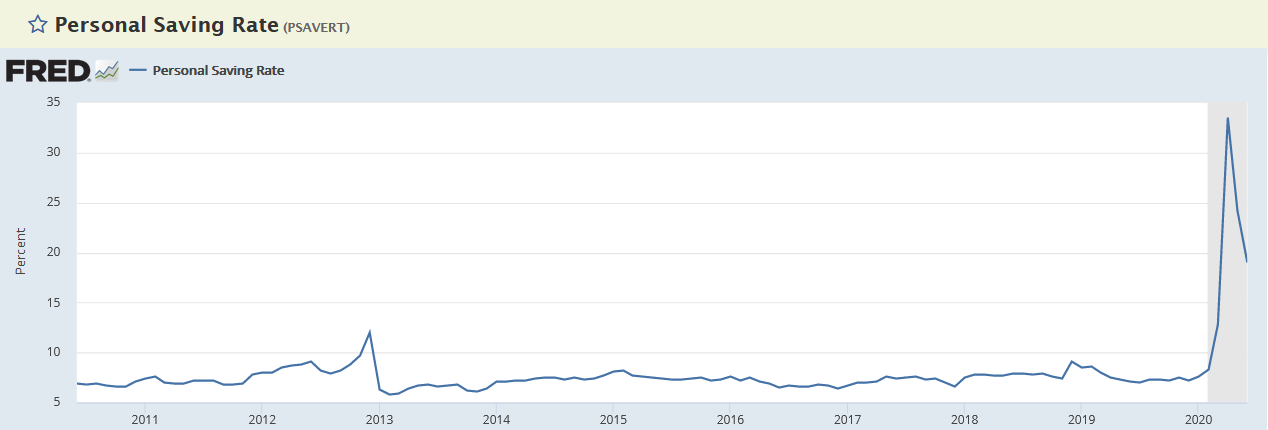
And then we have the ‘personal savings rate’ anomaly. According to the Federal Reserve Bank of St Louis, where they track this sort of stuff, the savings rate shot up in the past few months. So, at the same time millions of folks lost their jobs, becoming unemployed, personal savings jumped to unprecedented levels. This was surprising! What is “personal savings” you ask? According to the BEA:
“The U.S. personal saving rate is personal saving as a percentage of disposable personal income. In other words, it’s the percentage of people’s incomes left after they pay taxes and spend money.”
There you go. The largest percentage within the past 10-years was back in December of 2012, when the savings rate was 12%. Here are the personal savings rates in the past 4 months, again courtesy of the St Louis FED:
-
- March:12.8%
- April: 33.5%
- May: 24.2%
- June: 19%
All four are the highest savings rates recorded in the past 40 years.
Bizarre, right? How can folks be saving money while unemployed? The answer: Federal government stimulus payments. Here’s the chart:
OK, clearly, the increases in savings percentages are absolutely staggering. Let’s convert the “rate” into dollars. Using the most recent ‘personal savings’ data provided by the BEA, after completing a little math, here is the number of dollars Americans saved during:
- March: $173 billion
- April: $502 billion
- May: $343 billion
- June: $281 billion
Total it up and we see that Americans saved almost $1.3 trillion in the past 4 months, predominantly from federal stimulus payments. Consider the fact that consumer spending, also known as “personal consumption expenditures” at the BEA, has regained some ground and is now trending at an annualized rate of just under $14 trillion, it seems likely that personal savings will support consumer spending going forward.
Permit me a quick tangent: As you know, the White House and the Senate are at loggerheads on additional stimulus payments to needy Americans. The Trump administration did authorize FEMA to implement a new program, called the “Lost Wages Assistance” program, designed to “replace” the expired $600 per week federal unemployment supplement with a FEMA-emergency measure of $300 per week. Will it work?
No. Unfortunately, the ‘Lost Wages Assistance’ program has very limited funding. The comment below was taken from the program website:
“To ease the economic burden for those struggling with lost wages due to the coronavirus (COVID-19) pandemic, President Donald J. Trump authorized FEMA to expend up to $44 billion from the Disaster Relief Fund for lost wage payments.”
$44 billion? How long will that last? Well, let’s divide the number by $300, as that’s the weekly benefit maximum. The result is $146 million. Next, so far FEMA has approved only 30 states to join the program. So, while the US currently has 16.3 million unemployed, no more than about 60% are eligible at present, which equals about 10 million folks. 146 divided by 10 is 14.6. So, in theory, at present, about 60% of those unemployed might receive $300 per week — one half of the prior federal stimulus payment — for up to 14.6 weeks, or just shy of 3 months. Hmmm…not long at all. And if the recipient pool grows, the duration shrinks. Let’s keep our collective fingers crossed for additional federal stimulus support.
Finally, take a look at this image, courtesy of Citibank:
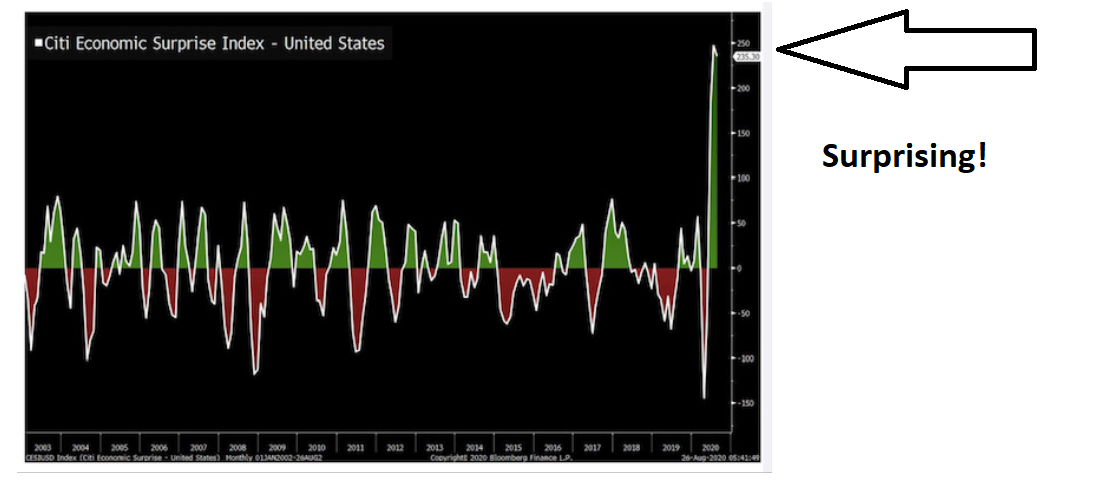
Known as the “Citigroup U.S Economic Surprise Index,” this represents this institution’s attempt to measure actual economic results against prior forecasts. This index is now at the highest level ever. Yes, ever. The “surprise” index has never been higher than today. Meaning that actual economic results are exceptionally surprising to the economists tracking, and forecasting, the data.
Surprise! Of course, as the actual data improves, economists will continue to offer improving revised forecasts, reflecting increased optimism, thereby reducing future surprises. Which is why the index jumps from red to green quite frequently. But wow … given the pandemic lockdowns and resulting massive unemployment levels, the economic results we’ve been seeing lately have been quite unexpected.
As we all know, the pandemic continues to create massive disruptions and human misery across the globe. But the US economy might be one spot where resilience is greater than most people expected. For the reasons I discuss above, and quite a few more unmentioned today due to time limitations, I believe US GDP will be flat or positive for 2020 when the dust settles. We’ll see!
– Terry Liebman


