SHI 8.19.26 – Thin Air

SHI 8.12.25 – The Flipside of Inflation
August 13, 2026
SHI 9.17.26 — Central Banks
September 17, 2026
No Mount Whitney hiker can deny it’s hard to breathe up there.
At a bit over 14,500 feet, Whitney is the highest peak in the contiguous US. At the top, the air is cold, thin and breathing is labored. I can only imagine how much worse it would be at the top of Everest – which is about 2X the height of Whitney. I’ll pass on that hike. Whitney and Everest are solid metaphors for growing mountains of debt I’ll discuss in detail below.
The first mountain, of course, is the US Treasury debt which crossed the $40 trillion mark earlier today. Clearly, that’s Mt Everest.
The other mountain of debt, more akin to Mount Whitney by comparative size, has been working feverishly to catch up. We will call that mountain “Big Mama” – big because, well, it’s big. And because that debt pile is a compilation of both the of on- and off-balance sheet liabilities of four companies: Microsoft, Alphabet, Meta, and Amazon. That’s Mama. BIG Mama.
.
“
Meet ‘Big Mama’ “
“
Meet ‘Big Mama’ “
In fact, Big Mama is SO big that the BIS – the Bank for International Settlements – discussed the issue at length in the just released “Annual Economic Report.” You may recall that the BIS is the central bank for central banks. They focus on global macroeconomic issues. Big Mama is one of those. Let’s dig in.
Welcome to this week’s Steak House Index update.
If you are new to my blog, or you need a refresher on the SHI10, or its objective and methodology, I suggest you open and read the original BLOG: https://www.steakhouseindex.com/move-over-big-mac-index-here-comes-the-steak-house-index/
Why You Should Care: The US economy and US dollar are the bedrock of the world’s economy. But is the US economy expanding or contracting?
Expanding … according the ‘advanced’ reading just released by the BEA, Q4, 2025 GDP grew — in ‘current-dollar‘ terms — at the annual rate of 5.1%.
The ‘real’ growth rate — the number most often touted in the mainstream media — was 1.40%. In current dollar terms, 2025 US annual economic output reached almost $31.50 trillion.
According to the IMF, the world’s annual GDP will expand to over $126 trillion in 2026. Of that amount, the US makes up over 25% — expected to reach $32.4 trillion by the end of 2026. Further, IMF expects global GDP to reach almost $135 trillion by 2028 — an increase of more than 28% in just 5 years.
America’s GDP remains around 25% of all global GDP. Just four countries—the United States, China, Germany, and Japan—generate roughly half of all economic activity worldwide. Collectively, the US, the European Common Market, and China generate about 65% of the global economic output. These are the 3 big, global players. They bear close scrutiny.
The objective of this blog is singular.
It attempts to predict the direction of our GDP ahead of official economic releases. Historically, ‘personal consumption expenditures,’ or PCE, has been the largest component of US GDP growth — typically about 2/3 of all GDP growth. In fact, the majority of all GDP increases (or declines) usually results from (increases or decreases in) consumer spending. Consumer spending is clearly a critical financial metric. In all likelihood, the most important financial metric. The Steak House Index focuses right here … on the “consumer spending” metric. I intend the SHI10 is to be predictive, anticipating where the economy is going – not where it’s been.
Taking action: Keep up with this weekly BLOG update. Not only will we cover the SHI and SHI10, but we’ll explore “fun” items of economic importance. Hopefully you find the discussion fun, too.
If the SHI10 index moves appreciably -– either showing massive improvement or significant declines –- indicating growing economic strength or a potential recession, we’ll discuss possible actions at that time.
The Blog:
The Wall Street Journal published a great investigative article on the growing mountain of debt – both on and off the balance sheets – at Meta, Amazon, Microsoft, and Alphabet. Their summary is presented in a great image of Big Mama. Here she is.
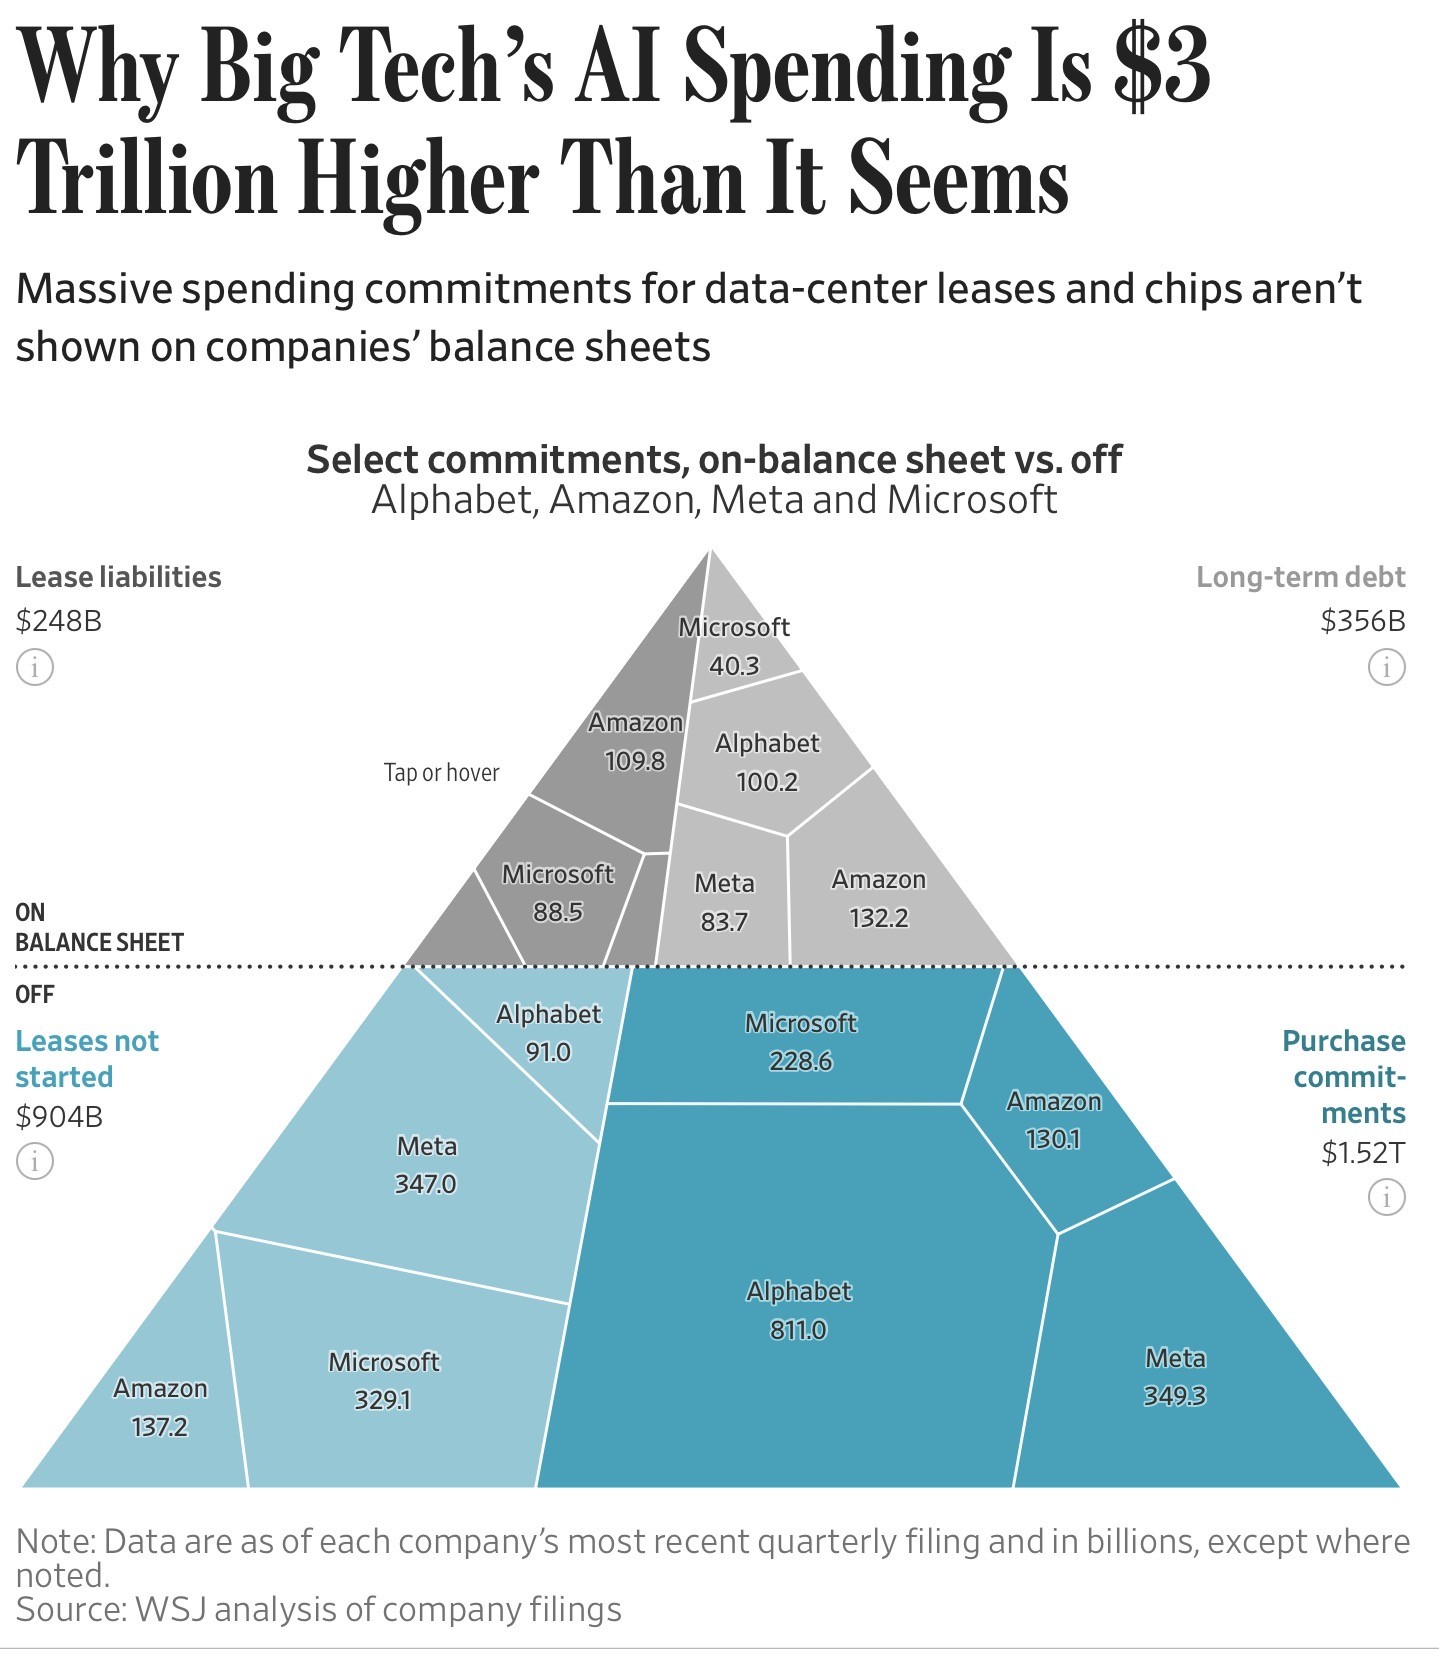
The headline pretty much says it all: AI spending is $3 trillion higher, in theory, than the trillion or two Big Mama has acknowledged in the public media. By their math, the spend on AI infrastructure investment is closer to $5 trillion than the one or two trillion previously disclosed in the public media.
The job of a gripping media headline is to sell newspapers, or in this case, entice someone to buy a digital subscription. So while the $3 trillion image of Big Mama in the WSJ article is certainly compelling, it’s not completely accurate. I fact checked the data – with the help of an AI LLM of course – and the numbers themselves are accurate. What is not accurate is how the Wall Street Journal presents the monolithic $3 trillion number to the reader. The numbers are right, the implication is inaccurate. In fact, the reality is far more complex and nuanced than that.
For example, let’s first discuss the “Leases not started” component in the “off” balance sheet section. The $904 billion is the sum of all the lease payments due over the entire life of those signed-but-not-yet-started leases. If one of our Big Mama companies signed a 15-year data center lease, the sum total of the 180 monthly payments is included in the mountain. Compare this to an announcement by Alphabet that they plan to spend $195 billion in 2026 on AI infrastructure. In this instance, they are spending that $190 billion this year. In the previous lease discussion, their payments will be made over the next 15 years. These are not the same.
Then we have the $1.52 trillion of off-balance sheet “purchase commitments.” I have verified the amounts in our Big Mama image with help from my other good buddy, Anthropic’s ‘Claude,’ to pull public records for Big Mama as validation. And once again, the numbers line up. And I find the underlying story both complex and fascinating:
Alphabet expects to spend the bulk of its $811 billion in commitments by 2030. About one quarter of this total – about $200 billion – meaning due within roughly a year. But this is not the full picture. Embedded within the “deals” are “energy service agreements” that total run far longer, from 2 years to 26 years. These agreements bind Alphabet all the way out to 2054. Even more staggering to me, the earlier quarterly report put that figure at $475 billion. So, in just one calendar quarter, Alphabet kicked that collective figure up to the $811 billion we show here. The rate of change is extraordinary.
I was unable to obtain this kind of detail on the terms of the Microsoft purchase agreements, however, I believe they too extend over many years. I know they have a 20-year agreement with Constellation Energy to restart Three Mile Island nuclear reactor.
Meta and Amazon do a much better job obfuscating detail. For example, their public reports show small near-term payments and another column on the chart is called “Thereafter” column — meaning Amazon’s disclosed maturity schedule, like Meta’s and Alphabet’s, is heavily back-loaded rather than evenly spread. “Thereafter” feels pretty vague to me.
Now let’s drill down a bit. How much new debt has Big Mama sold in the past year or so?
Alphabet’s long-term debt roughly doubled in about six months — from $46.5 billion at year-end 2025 to $98.2 billion by June 30, 2026 — driven almost entirely by new issuance. And they tapped global bond markets issuing debt in dollar, sterling, and Swiss francs. Finally, the sold one segment in 100-year bonds.
Meta raised roughly $55 billion across two bond sales in under a year. Amazon’s 2026 debt issuance exceeds $106 billion.
Interestingly, Microsoft’s debt is shrinking. Microsoft’s recorded long-term debt fell from roughly $40 billion to roughly $31–36 billion over the same period, Unlike the other Mama companies, their expansion is being financed mostly by free cash flow and long-term property leases instead. Their lease liabilities climbed to roughly $67 billion in the last calendar quarter.
OK, that’s enough of crawling through the financial weeds. Suffice it to say that a deep dive suggests the data in the WSJ article does not completely support the $3 trillion headline. That said, the article is directionally accurate. The AI infrastructure build-out cost is far higher than previously disclosed.
Let’s discuss why this is important.
About 20 years ago, FED Chairman Ben Bernanke commented that the world was awash in excess capital. In 2005 he said, “Over the past decade a combination of diverse forces has created a significant increase in the global supply of saving — a global saving glut.”
Bernanke argued that a surge of saving had transformed net ‘borrowers’ into large net ‘lenders’ in the international capital markets. Further, this capital was flowing into liquid U.S. assets, primarily Treasuries. That massive capital inflow pushed Treasury yields down.
Today, that glut is gone. That was then. This is now. The massive 2007 global financial crisis and 2020 world-wide pandemic later, that surplus has been fully spent.
Today, excess capital is hard to find. Debt issuance has been massive. I believe total US debt – which included all intradepartmental liabilities and debt owed to the public – crossed the $40 trillion mark today. That’s right: $40 trillion. And Big Mama’s debt surge is large enough to add supply pressure, putting upward pressure on interest rates.
Big Mama and friends are competing against US Treasuries for buyers. The five largest hyperscalers issued roughly $121 billion in bonds in 2025, and another $159 billion by mid-2026.
As I’ll discuss in detail below, some of these companies carry better credit ratings than the U.S. government — so when a Treasury auction and a hyperscaler bond sale compete for the same pool of capital in the same week, some investors are choosing the hyperscaler debt instead of US Treasuries, pushing up yields on long-duration Treasuries.
And this is not just an American phenomenon. This is global. Capital is scarce everywhere. And when capital is scarce, bond buyers can be pickier. “Pay me more and I’ll buy your bond,” they seem to be saying. A higher yield, attracts greater demand.
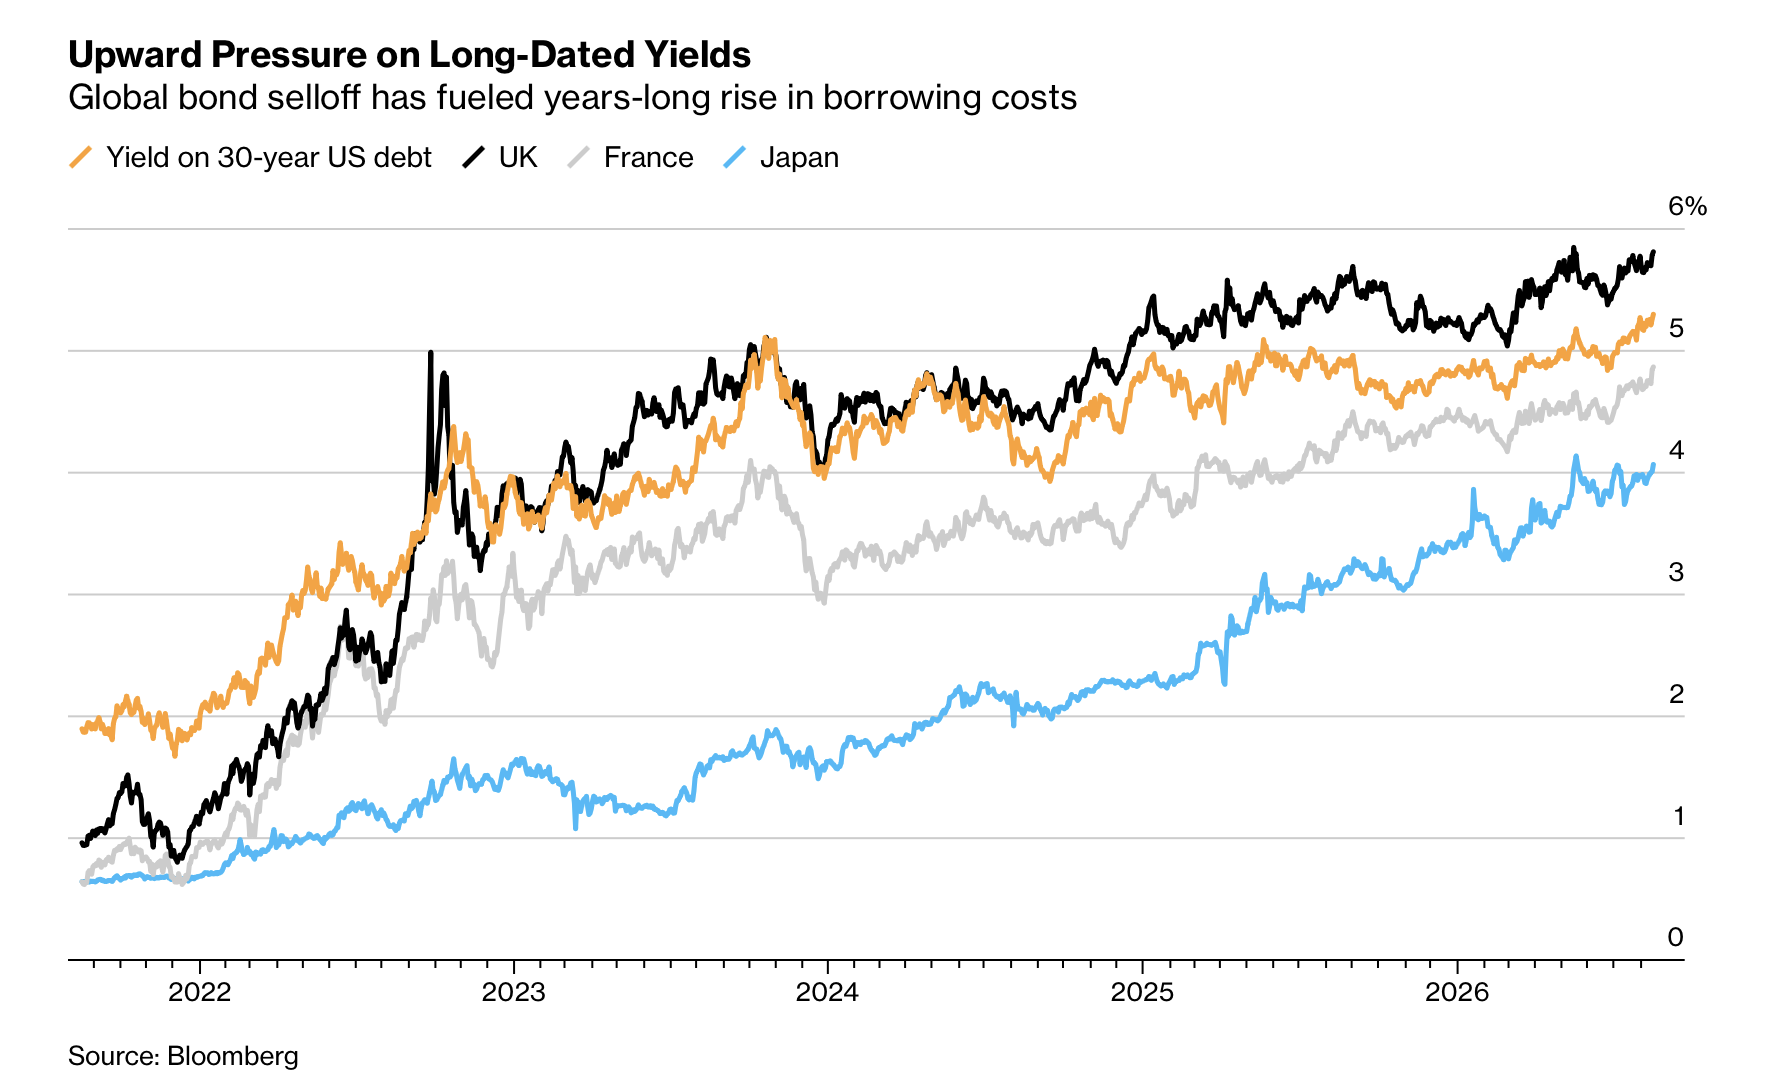
Clearly, yields are up globally. And something else is happening concurrently: The US Treasury yield curve has flipped.
My long-term readers may recall how for years we discussed the inverted yield curve in US Treasury debt. For years, long-term bonds had lower yields than shorter-term bonds. Historically, this is unusual and economic experts opined that the inverted yield curve was a sure-fire indicator of a US recession just around the corner. Of course, as I predicted for years, than never happened.
The yield curve is no longer inverted. In fact, the yield curve is now quite steep. Below I have an image showing the rate trends on the 2-year and 30-year bonds. In 2022 the relationship between the two shifted. You may recall this was when the FED triggered their monetary tightening regime by lifting the Federal Funds rate from about zero up to 5.5%:
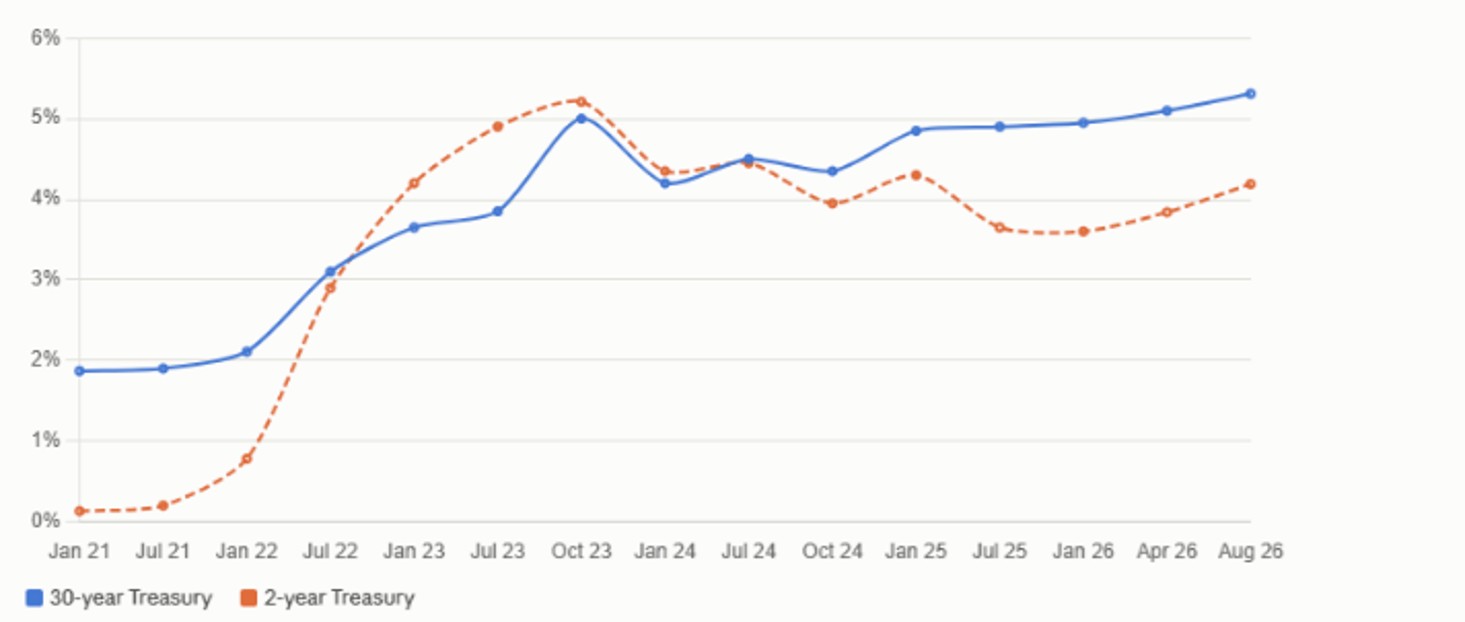
Today, the yield curve is very “normal” in that short-term yields are lower than long-term yields. In fact, it’s growing quite steep. The negative curve is a thing of the past.
In October 2023, the 2-year yield was 5.2% while the 30-year was just 5%. The spread was a negative 0.20%. Today was have a 2-year at about 4.2% and a 30-year yield of 5.3% giving us a positive spread of 1.10%. That is an enormous 130 basis-point tightening of the curve.
So what’s the bottom line?
Essentially this: As I’ve commented in numerous prior blogs, the strongest economic relationship is that between the supply of something and the demand for it. The relationship between supply and demand holds true in the global financial markets.
When the supply of credit instruments – Treasury bonds, investment grade bonds, etc – is relatively static, and the demand is has grown significantly, then demand for far surpasses supply and yields fall. In 2005, Bernanke pointed out this imbalance: Demand far outstripped supply. Yields fell. That imbalance lasted for 15 years.
Sovereign and corporate bond rates plunged during the 2015 – 2020 period. You may recall I wrote a number of blogs about “negative” interest rates that popped up around the world. Do you remember the negative interest rate mortgages I reported on up in the Scandinavian countries? Homeowners were actually paid to borrow money? That was just nuts.
Well, the era of cheap capital is over for now.
The pendulum has swung over to the other side: Today, we have far more bonds for sale than we have buyers. The US is selling more Treasuries than ever. So is just about every other developed nation. And now Big Mama has entered the market, already adding a few hundred billion of mid- and long-term investment grade bonds into an already oversupplied marketplace. In this environment, where the supply of bonds exceeds global demand, over time, interest rates go only one direction: Up.
Here’s an interesting twist. Investment experts can even debate which bond – a US Treasury or a Big Mama bond – is a “better” or safer investment. Consider this: Microsoft has a better credit rating than the US government! So, in theory, a 30-year corporate bond issued by Microsoft is “safer” than a 30-year Treasury bond. 🙂
Alphabet’s credit rating is identical to that of the US. Both the US Treasury and Alphabet have an S&P long-term rating of “AA+” – one notch lower than Microsoft’s AAA rating. This suggests a US Treasury bond and an Alphabet bond have an identical probability of full repayment. In theory, they should pay the investor the same yield. In theory, they should pay the same interest rate.
But they do not. Alphabet 30-year senior notes yield about 1% more than the same duration Treasury. Which means, in some cases, investors might find the Alphabet bond more desirable. And if not just for a higher yield, a diversification strategy suggests an investor might want to trade out of US debt and into something of equivalent credit quality and similar (if not higher) yields.
Big Mama is competing with Uncle Sam for your investment dollars.
One additional factor is also fueling higher rates. The US economy – in fact, the entire developed world economy – is firing on all cylinders. That steepening yield curve I mentioned above is one indicator. Remember, if an inverted yield curve is indicative of a coming recession, a positive and steep yield curve must be the opposite – an indication of economic expansion.
Which seems to be the case. The Atlanta GDPNow is forecasting an annualized 4% growth rate for Q3 GDP. Yes this is a forecast. And it will change. But that is the “real” GDP, not the current-dollar figure. You recall that last quarter the current-dollar GDP growth rate was an annualized 7.9%, right? That’s because in Q2 the BEA determined the “GDP deflator” was an annualized 6.3%. That amount of growth is subtracted from the current-dollar figure to get the real GDP growth rate. If the actual Q3 figure does end up around 4%, and the GDP deflator remains around 6%, that means the US economy could grow by 10% in Q3! Wow.
This is what happens when Big Mama (and friends) spend (in the aggregate, over a few years) $3- to $5 trillion around the globe. These are staggering sums that are spent many times over as they permeate the economies of the world.
Here’s today’s summary: Big Mama is competing with Uncle Sam for your bond investment dollars. The hyperscalers are spending and borrowing incredible amounts of money. The US economy is absolutely on fire.
Let’s see if the grills at the steakhouses are equally hot.
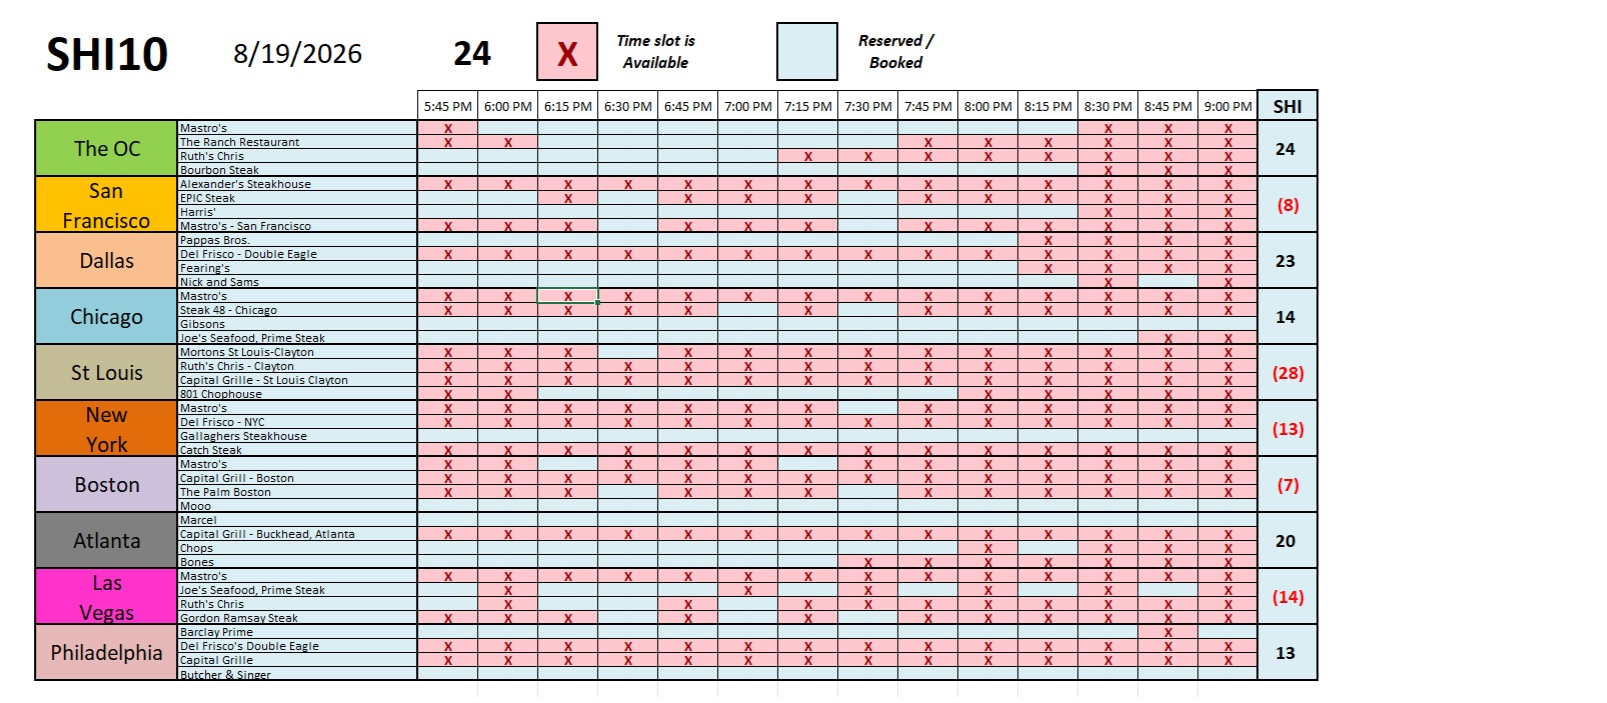
Well, last week and today are close to mirror images of each other. SHI40 demand looks strong … but there’s not much to say beyond that.
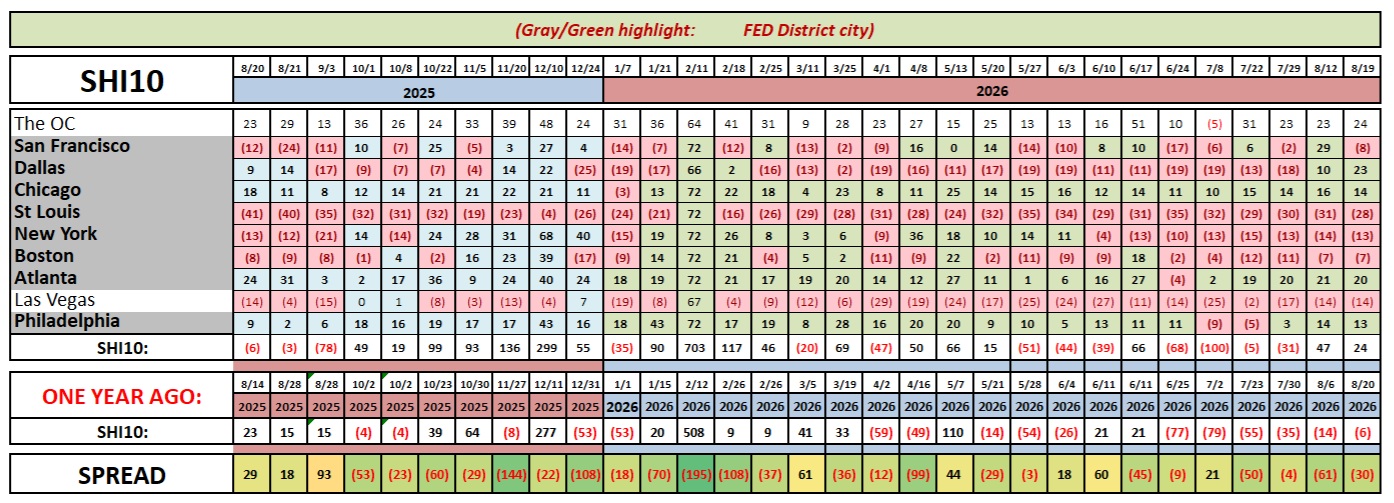
Remember the economic pendulum is always in motion. As hot as the US economy is today, things change. If the real GDP numbers grow too big, and CPI inflation remains elevated, the FED could begin another Federal Funds interest rate increase cycle. This has the effect of dampening US economic activity.
It’s worth noting that the 2026 BIS Annual Report suggested we could have an even bigger problem out there somewhere on the horizon.
The BIS report suggests today’s AI infrastructure boom has four historical precedents — “canal mania” back in the1830s, British railway mania (1840s), the “roaring 20s” electrification boom, and the dotcom boom. They noted all four shared one trait: a genuine technological breakthrough that attracted capital far beyond what commercial returns could ultimately justify. Of course, before that fact was known, investors piled into investment opportunities with reckless abandon. I asked my good buddy ChatGPT to compare and contrast the post-bust experience for investors in the various stock markets at the time. Take a look:
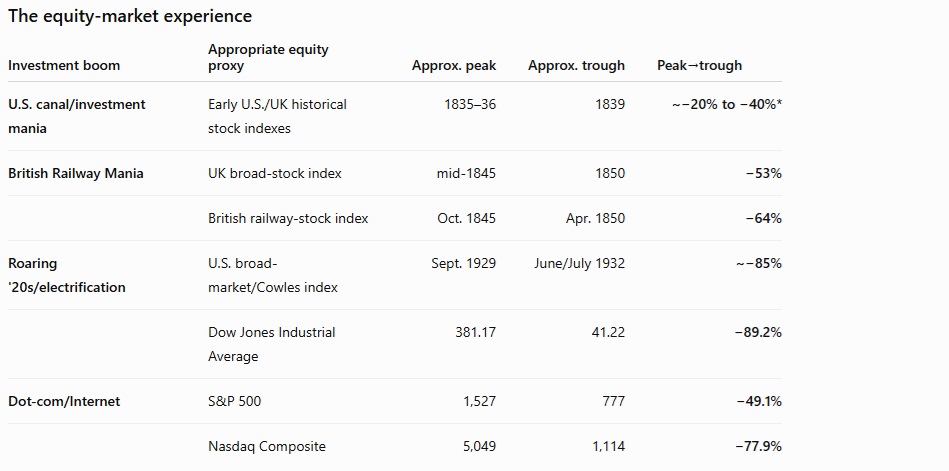
Of course, today we know that all four episodes ended badly. And all 4 triggered economy-wide recessions; ironically the dotcom bust triggered only a short recession. GDP barely declined at all. Perhaps this is a more “modern” response?
The companies directly associated with each of these investment booms suffered much larger declines than the overall market.
The BIS report claims the scale and pace of the current AI boom “bear resemblance to these precedents, highlighting potential downside risks in the near term.”
But will the story end in the same spectacular crash? It’s impossible to say today. I believe we know AI is transformational. But we don’t know if the world needs only $3 trillion of AI infrastructure while we build $5 trillion. If the near-term economics only support $3 trillion, we have a problem. The debate isn’t whether AI works. It’s whether the marginal $100 billion of AI infrastructure spend will earn the requisite return.
Ultimately, as with just about everything else in the economic world, this comes down to supply and demand. When the dust settles, if supply outstrips demand we have a problem. And, unfortunately, history suggests this is a likely outcome. Unfortunately.
But it might be a few years before we get that answer. While we wait, know this: The US economy is absolutely cranking. Paraphrasing FDR, we have nothing to fear but fear itself. Right. 🙂
< Terry Liebman aka ‘Biter Llama’ >