
SHI 9.15.21 – Beware the Big Dog

SHI 9.8.21 – The Next Big Scare
September 8, 2021
SHI 9.22.21 – I Gotta Buy Crypto!
September 22, 2021
The big dog? That would be the Federal Reserve. They may not have a more accurate crystal ball, but they have their fingers on the pulse of one heck of a lot of data. And they move markets with trillions of dollars at their fingertips; when they ‘bark,’ we listen.
“
What is the FED forecasting?“
“What is the FED forecasting?“
Let’s take a look.
Welcome to this week’s somewhat abbreviated Steak House Index update.
If you are new to my blog, or you need a refresher on the SHI10, or its objective and methodology, I suggest you open and read the original BLOG: https://www.steakhouseindex.com/move-over-big-mac-index-here-comes-the-steak-house-index/
Why You Should Care: The US economy and US dollar are the bedrock of the world’s economy.
But is the US economy expanding or contracting?
The short answer? Expanding. By a staggering measure. In fact, during Q1 and Q2, annualized 2021 ‘real’ growth averaged about 6.4%. In nominal terms, our US economy averaged almost 12% growth — adding $1.245 trillion of economic activity during the first half of the year. Forever more, COVID-19 will be mentioned concurrently with any discussion about 2020 GDP. Collectively, the world’s annual GDP was about $85 trillion by the end of 2020. But I am confident all 2021 GDP discussions will start with a nod to the blowout 1st quarter GDP growth number, because our ‘current dollar’ GDP grew at the annual rate of 10.7%! Annualized, America’s GDP blew past $22 trillion during the quarter, settling in at $22.72 trillion. The US, the euro zone, and China continue to generate about 70% of the global economic output.
The objective of this blog is singular.
It attempts to predict the direction of our GDP ahead of official economic releases. Historically, ‘personal consumption expenditures,’ or PCE, has been the largest component of US GDP growth — typically about 2/3 of all GDP growth. In fact, the majority of all GDP increases (or declines) usually results from (increases or decreases in) consumer spending. Consumer spending is clearly a critical financial metric. In all likelihood, the most important financial metric. The Steak House Index focuses right here … on the “consumer spending” metric. I intend the SHI10 is to be predictive, anticipating where the economy is going – not where it’s been.
Taking action: Keep up with this weekly BLOG update. Not only will we cover the SHI and SHI10, but we’ll explore related items of economic importance.
If the SHI10 index moves appreciably -– either showing massive improvement or significant declines –- indicating growing economic strength or a potential recession, we’ll discuss possible actions at that time.
The Blog:
It’s not whether the FED forecast is right or wrong. No, that matters little … as the FED, like most fortune tellers, is more likely to be wrong than right. Far more important are the directional indicators of the forecast itself. With more than 22,000 employees, the FED is the largest financial researcher in the world. And they have an unlimited line of credit. So when they bark, we listen.
While a bit dated, this chart from mid-June offers a lot of insight into the FEDs expectations about this year, 2022, 2023 and “the Longer run.”
What is the longer run, you ask? You know, it’s …
OUT THERE
… somewhere. OK, ok, that is awfully vague. Let me be a bit more precise: While the term is not defined, clearly it begins in 2024 and heads toward the horizon. The Congressional Budget Office typically offers 10-year forecasts … so I suspect the FEDs window is probably similar. Take a look at the following graphic and pay particular attention to the longer run forecasts for PCE inflation and the ‘Change in real GDP’:
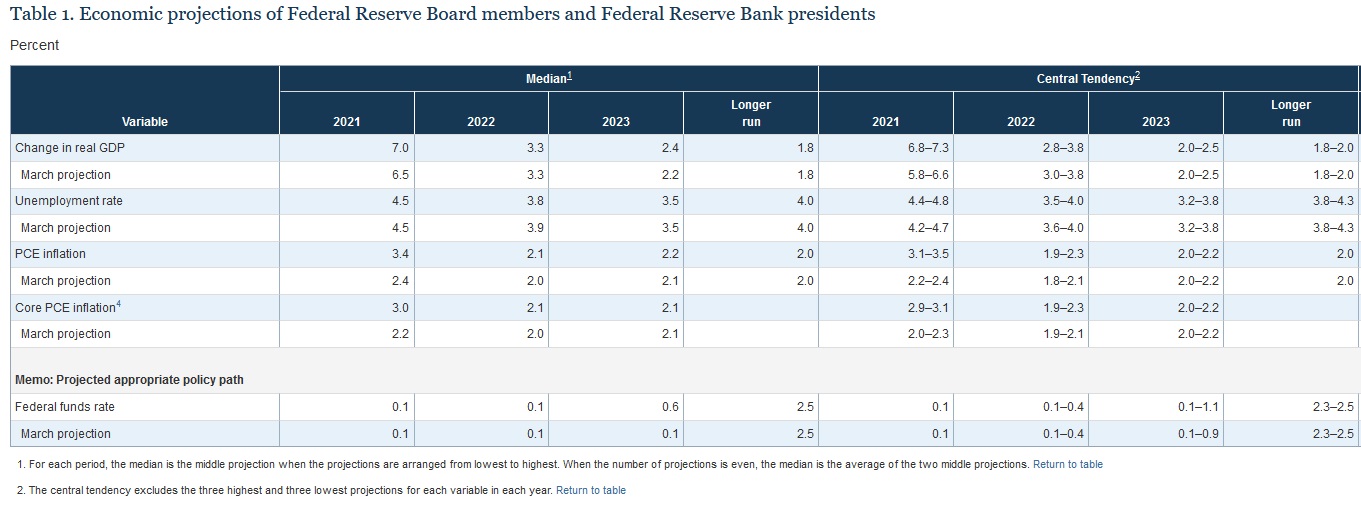
GDP growth in 2021, 2022 and 2023 are expected to be “hot” in comparison to the longer run. I find it fascinating that the FED believes “normal” long-term growth in GDP will hover around 1.8%. Ouch. That’s not much annual growth. Considering all we know today about demographics, productivity, sovereign and corporate debt levels, interest rates, etc., this forecast doesn’t surprise me much. Clearly the FED feels the massive government stimulus, much like the pig thru the python, will be a thing of the past by 2024, without any lingering or longer term economic benefits. This is a debatable point, but it’s clearly their conclusion. I’ll come back to this in future blogs.
And they feel inflation will retrench and fall back to its 2% level by then as well. We’ll talk a lot more about this, too, over time.
OK, I’ve got to cut this short. I’m heading to the airport … so I’m afraid there will be no SHI10 today. Be sure to check in next week … when the SHI10 returns!
<|> Terry Liebman


