
SHI 9.22.21 – I Gotta Buy Crypto!

SHI 9.15.21 – Beware the Big Dog
September 15, 2021
SHI 10.6.21 – Change is the Only Constant
October 6, 2021
The pull is SOOOOOOO strong! Crypto is sexy … and clearly everyone’s doin’ it! Are NFTs calling your name too? After all, Art Blocks may soon pass $1 billion in value and CryptoPunks has already passed this milestone!
“
Is it time to take the plunge?“
“Is it time to take the plunge?“
Wow … I don’t know … there is so much opportunity to make a killing, right? Or, maybe, we should take it slow? Perhaps we should just dip our ‘big toe’ into the pool? Whadda ya say? Ready?
Welcome to this week’s Steak House Index update.
If you are new to my blog, or you need a refresher on the SHI10, or its objective and methodology, I suggest you open and read the original BLOG: https://www.steakhouseindex.com/move-over-big-mac-index-here-comes-the-steak-house-index/
Why You Should Care: The US economy and US dollar are the bedrock of the world’s economy.
But is the US economy expanding or contracting?
The short answer? Expanding. By a staggering measure. In fact, during Q1 and Q2, annualized 2021 ‘real’ growth averaged about 6.4%. In nominal terms, our US economy averaged almost 12% growth — adding $1.245 trillion of economic activity during the first half of the year. Forever more, COVID-19 will be mentioned concurrently with any discussion about 2020 GDP. Collectively, the world’s annual GDP was about $85 trillion by the end of 2020. But I am confident all 2021 GDP discussions will start with a nod to the blowout 1st quarter GDP growth number, because our ‘current dollar’ GDP grew at the annual rate of 10.7%! Annualized, America’s GDP blew past $22 trillion during the quarter, settling in at $22.72 trillion. Collectively, the US, the euro zone, and China generate about 70% of the global economic output. These are your big players.
The objective of this blog is singular.
It attempts to predict the direction of our GDP ahead of official economic releases.
Historically, ‘personal consumption expenditures,’ or PCE, has been the largest component of US GDP growth — typically about 2/3 of all GDP growth. In fact, the majority of all GDP increases (or declines) usually results from (increases or decreases in) consumer spending. Consumer spending is clearly a critical financial metric. In all likelihood, the most important financial metric. The Steak House Index focuses right here … on the “consumer spending” metric. I intend the SHI10 is to be predictive, anticipating where the economy is going – not where it’s been.
Taking action: Keep up with this weekly BLOG update. Not only will we cover the SHI and SHI10, but we’ll explore “fun” items of economic importance. Hopefully you find the discussion fun, too.
If the SHI10 index moves appreciably -– either showing massive improvement or significant declines –- indicating growing economic strength or a potential recession, we’ll discuss possible actions at that time.
The Blog:
Look, I get it. The attraction is almost irresistible. Day after day, we watch as young, know-nothing, crypto-punks make millions while we slave away at our day jobs. It isn’t fair! It isn’t FAIR! Indeed. Is “it” supposed to be fair? 🙂
Are you wondering about the blog image above?

It’s a clip of the splash webpage for “THE BORED APE YACHT CLUB.” And what is the Bored Ape Yacht Club, or BAYC for short, you ask? Well, at present, it’s the third most valuable NFT collection listed at ‘CoinMarketCap,’ a site dedicated to tracking this stuff. Per the CoinMarketCap site, at present, the ‘collection net worth’ for BAYC is almost $600 million. Yes, that’s right, $600 million. Entering the site for the BAYC and we see the splash page. Take a look and look closely. Did you notice the string of flashing lights and the neon sign in the window?
No? Look again. It’s right above the alligator in the swamp. See it?
That’s right. That flashing neon sign says: “FOMO.” Fear of missing out.
Scroll down toward the bottom and you’ll see this description of their club:
“A limited NFT collection where the token itself doubles as your membership to a swamp club for apes.”
Damn, count ME in! I love apes! And swamps! Who doesn’t love swamps?
Could there be a better reason to join their club? You don’t want to miss out! Once you join, you can join a pending auction to potentially purchase NFTs that look like: 
Yep, he’s a beaut, right? Damn, that is one bored ape. He looks half asleep to me…but handsome and rugged nonetheless. What do you think? Interested?
Well, get in line. Because the last bid for this guy — known as #6297 — is pretty steep: It was 36.5 WETH. That’s right — 36.5. But if absolutely must have this prince of an ape, the “buy now” price is 39.75 WETH. Oh … did you want to know the price in US dollars? OK, sure, no problem.
39.95 WETH is equal to $120,558.57 at this moment.
Are you wondering what a WETH is? So was I. Here’s the on-line definition:
“Wrapped ETH, or WETH, refers to an ERC-20 compatible version of ether. ERC-20 is a technical standard developed after the release of ETH that allow tokens created on the Ethereum blockchain, such as ZRX, to interact with each other.”
Wow. I have no idea what that even means. LOL.
But I do know what $122,558.57 is. That’s a lot of money. In fact, I believe it’s enough money to purchase an entry-level Porsche 911S. So now I have to make the choice … would I rather have a brand new Porsche 911S, or that bored ape NFT? I’m gonna struggle with this one for a long time.
Please don’t miss the site’s disclaimer:
“Bored Ape Yacht Club is a collection of digital artworks (NFTs) running on the Ethereum network. This website is only an interface allowing participants to exchange digital collectibles. Users are entirely responsible for the safety and management of their own private Ethereum wallets and validating all transactions and contracts generated by this website before approval. Furthermore, as the Bored Ape Yacht Club smart contract runs on the Ethereum network, there is no ability to undo, reverse, or restore any transactions.”
Got it. Caveat emptor. ‘Let the buyer beware.’ We’ve been warned.
Are you ready to join the club? You don’t want to miss out!
Just kidding. I think I’ll pass. I know, I know, I’m gonna miss out. I’ll be sitting outside the club, probably hangin’ with the alligator in the swamp, while you far-hipper, much smarter folks are inside living it up. With the apes.
Because here’s my concern. Open this link in another tab:
https://coinmarketcap.com/nft/collections/
Open? Take a look up at the top left …. got it? That’s right, as I write this blog, CoinMarketCap is tracking 12,053 cryptocurrencies. But here’s the more fascinating bit: I began writing the blog on Monday afternoon. Then, the site was tracking 11,972 cryptocurrencies. In just two days, the number of CCs selling thru exchanges increased by 81.
In-just-2-days!
This isn’t a marketplace … this IS a swamp. A swamp with a market cap of almost $2 trillion. Unbelievable.
But if you still want to dive in, and hang with the cool kids — I know, is that even possible? — consider joining “Decentraland,” described in the Economist magazine as:
“…a virtual-reality platform built on the Ethereum blockchain, also known as a “metaverse”, where virtual shops sell digital collectables and tokens.”
Uhhh….OK. That does sound pretty cool. A VR platform where I can go shopping for NFTs! That sounds much better than an ape club! 🙂
The Economist magazine continues with this comment:
“Talk of blockchains, DAOs and metaverses sounds so utterly bewildering and far-fetched that it might be tempting to give up listening to the DeFi crowd. The success of this nascent technology is, indeed, far from guaranteed. But piece by piece a new kind of economy is being built through applications on various blockchains. Each addition makes it more likely that the whole will amount to something meaningful and powerfully disruptive.”
No doubt. I completely agree. But this rabbit hole is too deep and we have limited time here. So et me finish this segment with this:
BE CAREFUL OUT THERE!
This stuff is complex, dense, and ubiquitous. And FOMO is everpresent. In time, as the rule-of-law replaces the today’s Wild West, I have no doubt people will make money in this space. But until that day, I fear many more will lose. Yeah, I’m just an old fuddy-dud. That’s me. Me and Mr. Alligator will just sit here and share a ‘Hurricane’ and a few small bites. Moving on. 🙂
What do ‘car rental rates’ have to do with the Delta variant? Quite a lot as it turns out. Take a look at this graphic:
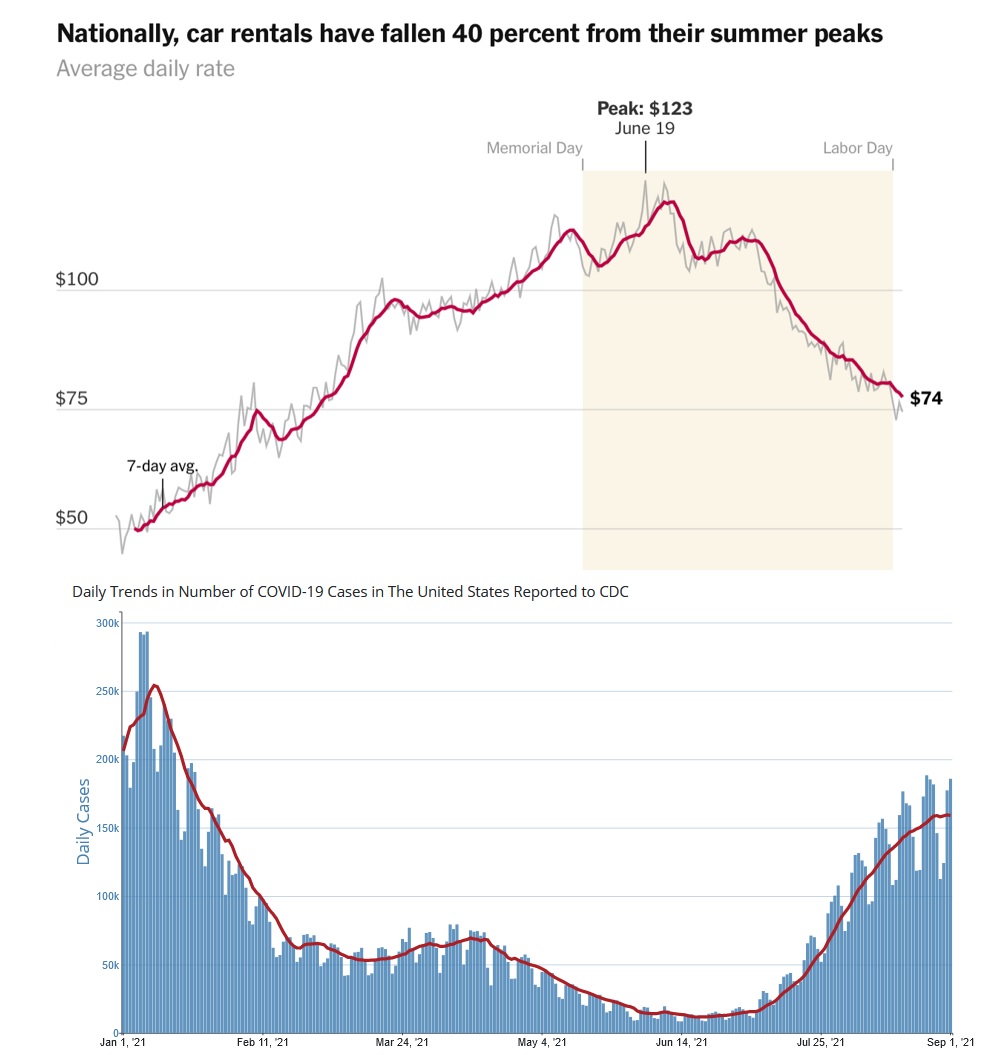
While the images do not overlap perfectly, I think we can all clearly see the near-perfect inverse correlation.
But causation and correlation, as we’ve discussed numerous times, are not necessarily aligned. But I believe they are in this case. Further, I am confident the early-July rise of Delta directly and adversely impacted more than just car rental rates. But the impact was unevenly distributed. Over all, however, Delta definitely took some steam out of the economy. Consumer spending, in the aggregate, did increase each month from April thru July, 2021, but not by as much as we earlier expected pre-Delta.
Like the SHI, car rental statistics are an ‘alternative economic indicator.’ An AEI does not precisely measure an economic outcome; it’s more indicative. And, in my view, more entertaining. Consider these alternative economic indicators and what they measure:
<> The hemline index – expansion or contraction of the economy
<> The men’s underwear index – Alan Greenspan’s theory on discretionary spending
<> The lipstick index – economic prosperity
<> The Christmas price index – inflation
<> The Champagne index – the size of US shipments align with economic growth.
… and finally …
<> The cardboard box index – the greater the number of boxes, the better the economy. Yes, it’s a thing. In fact, the St Louis FED actually tracks this one. Take a look at the graphic below:
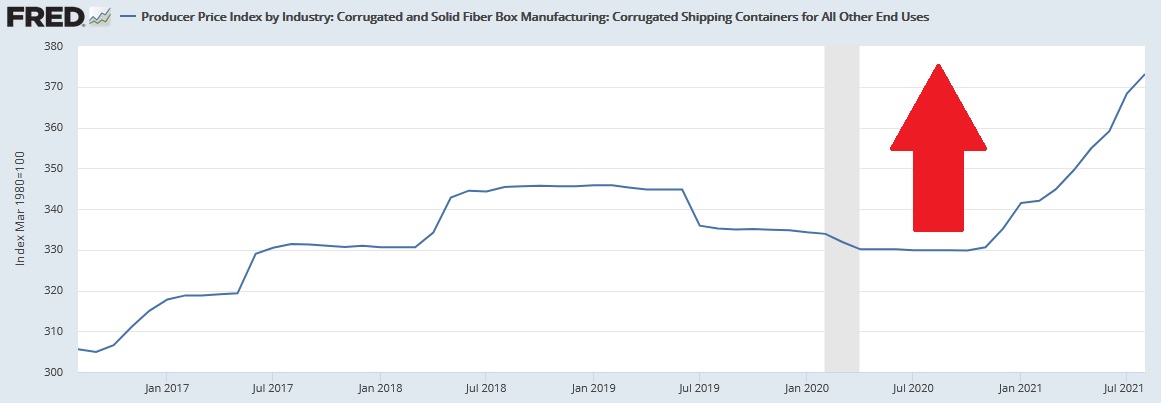
If we ask cardboard boxes, the economy is on a tear! 🙂
Yes, pun intended. Clearly by this metric, consumer spending continues to rise … which bodes well for the overall economy.
I found this interesting: The use of alternative metrics is not limited to economics. Apple is also planning to use non-traditional, alternative metrics, as reported on Tuesday in the Wall Street Journal.
Apple is working on technology to help diagnose depression and cognitive decline.
“The data that may be used includes analysis of participants’ facial expressions, how they speak, the pace and frequency of their walks, sleep patterns, and heart and respiration rates. They may also measure the speed of their typing, frequency of their typos and content of what they type, among other data points, according to the people familiar with the research and the documents.”
Facial expressions? Typing speed? As a measure of cognitive decline? Sure. Why not. After all, we use expensive steak sales to measure the consumer economy. Who are we to judge? 🙂
Speaking of which, let’s head to the steakhouses and see how steaks are selling this week. Quite well, it appears! Here’s the long-term grid:
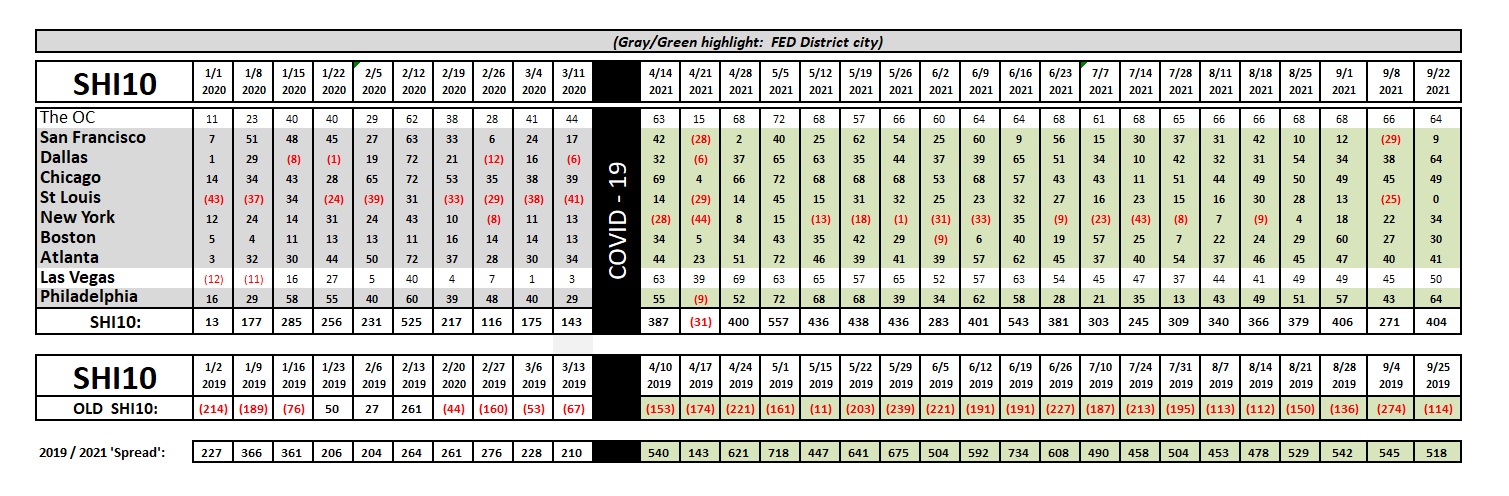
It’s interesting to note a few things. First, once again this week all of our SHI cities are back in the black. As you can see above, cities that start with the letter “S” are struggling a bit. Correlation? Definitely. Causation? Nope. Reservation demand here in the OC remains robust, as it does in Dallas, and Philly. Demand is strong in Chicago, Atlanta, ‘Vegas, and even NYC.
Second, consider this: Rental car demand fell precipitously beginning in early June. It would be logical to assume that expensive eatery demand in ‘Vegas — a city with exceptionally high transient demand — would have followed the same trend. It did not. As you see above, from 6/2 thru today, high-priced steaks have been flying off the grill in ‘Vegas every single week. Reservation demand has ebbed and flowed, but overall it has remained fairly consistent. Why? Why didn’t ‘Vegas experience the same demand destruction we saw in car rentals?
My 2 cents: I think the car rental statistics are more reflective of American consumer behavior in the aggregate. I believe ‘Vegas-lovers are a younger subset, and by definition are far less risk averse than Americans on the whole. “Vegas folks” are gamblers by nature … and apparently they are more willing than “the average” American to “gamble” on their personal health while doing the same with their finances. Again, my 2 cents. 🙂
Here’s this weeks chart:
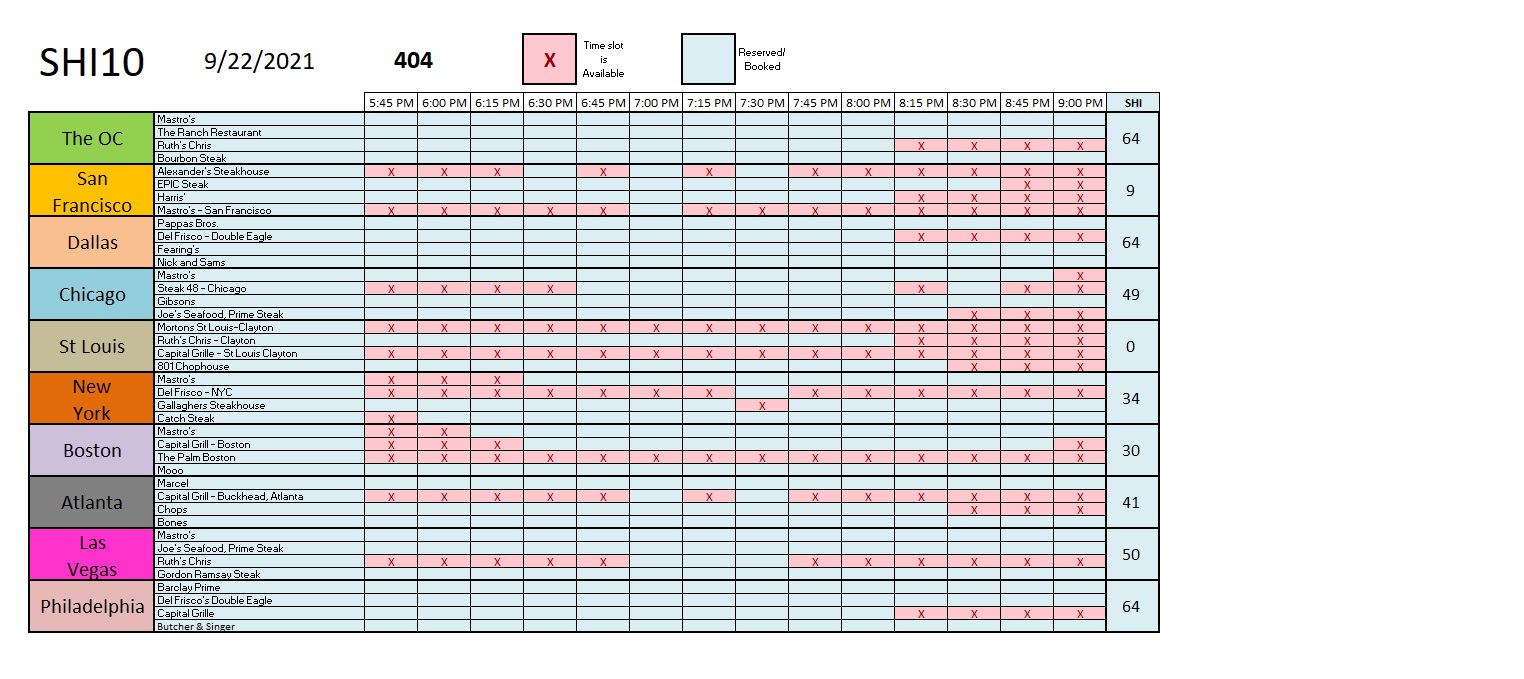
Interesting, right? I can come to only one meaningful conclusion from this chart: Do not invest in the St Louis Morton’s. Week after week, on Wednesday at 11 am the entire slate of Saturday evening reservations slots appear to be wide open. Ouch. 🙂
OK … that’s a wrap for today. In closing, let me say:
Here today, Gone to Maui!
I’m heading to Hawaii tomorrow. So next Wednesday, you get a break from my bad jokes and I get a break from writing them. 🙂
Aloha!
<:> Terry Liebman


