
SHI Update 12/7/16: Steaks are Heating UP!

US Labor Markets: Update 12/3/16
December 3, 2016
Balance of Trade, Globalization and Protectionism
December 11, 2016
The US economy has been growing for years. Slowly, but growing nonetheless. That might be changing.
One thing that has definitely changed is the rhetoric coming out of Washington DC. Trump: “I believe in free trade … but I don’t believe in stupid trade.” Hmmm….
Not yet in the Oval Office, Trump is already molding the American business landscape – and the stock market is loving it! After a shove by the Trump administration, Carrier decided to keep an Indiana manufacturing plant open and operating. As you know, Carrier makes air conditioners. Cool.
But the Trump administration intervention, according to Larry Summers is not cool. In the boxing match – Trump vs. Carrier – Summers believes American capitalism is the loser. Steven Pearlstein disagrees. Take a look at these two Washington Post articles:
https://www.washingtonpost.com/news/wonk/wp/2016/12/02/why-trumps-carrier-deal-is-bad-for-america/?utm_term=.fa6325f91793
https://www.washingtonpost.com/news/wonk/wp/2016/12/02/give-him-credit-trump-carrier-deal-puts-shareholder-obsessed-ceos-on-notice/?utm_term=.ada59d88d2d9
Summers: Capitalism permanently damaged? Pearlstein: American capitalism saved? Who’s right? An interesting debate, to be sure. Me? I’m more concerned about the unintended consequences. 🙂
Welcome to this week’s Steak House Index update.
As always, if you need a refresher on the SHI, or its objective and methodology, I suggest you open and read the original BLOG: https://terryliebman.wordpress.com/2016/03/02/move-over-big-mac-index-here-comes-the-steak-house-index/)
Why You Should Care: The US economy towers over all others: our GDP is over $18.5 trillion a year. Is it growing or shrinking?
The objective of the SHI is simple: To predict the direction of this behemoth. But while the objective is simple, the task is not.
BEA publishes GDP figures the instant they’re available. Unfortunately, it is a trailing index. The data is old news; it’s a lagging indicator. We know how the economy is doing in advance of the GDP release.
Personal consumption expenditures, or PCE, is the single largest component of the GDP. In fact, the majority of all GDP increases (or declines) usually result from consumer spending. Thus, this is clearly an important metric to track.
I intend the SHI is to be predictive, anticipating where the economy is going – not where it’s been. Thereby giving us the ability to take action early. Not when it’s too late.
Taking action: Keep up with this weekly BLOG update. If the SHI index moves appreciably – either showing massive improvement or significant declines – indicating expanding economic strength or a potential recession, we’ll discuss possible actions at that time.
The BLOG: Call Carrier: It looks like things are heating up!
But wait … let’s not get ahead of ourselves. Sure, financial and economic metrics are showing renewed strength …
- The DOW and S&P are way UP;
- The US dollar is UP;
- Corporate profits are finally rising again;
- Productivity is UP;
- Long-term rates are UP; and
- The labor market is tightening.
… and while the US stock markets are soaring, the underlying economy is not. It does seem to be improving … but not soaring. Taken together, what do these facts suggest about potential FED rate increases and inflation? Grab your knife and fork and let’s dig in.
Reservations at our pricey eateries are soaring! You have a hankering for a Mastros filet? Well, unless you’re good with 9:45 reservations this Saturday, you’d better reconsider. How about dinner at the Capital Grille? 🙂
Today the SHI has popped to a positive 13! Here are the charts:

Yes, Mastros is booked. And this week, Ruth’s Chris is in close second – more than 1/2 their tables are booked between 5:45 and 9:00 pm. Impressive. Morton’s, too, is showing strong consumer demand. Take a look at our trend report:

We haven’t seen demand this strong since the end of June. And we haven’t seen two consecutive double-digit SHI readings ever. High-dollar steaks are on fire! 🙂
And is our ‘Steak House Composite Index’ warming up too? Yep. Not only is the labor market clearly firming, but the yield curve is definitely steepening. Let’s take a look.
Remember, our SHCI is a more comprehensive measure of the US economy. Beyond the SHI, which is designed to measure consumer spending, the SHCI weighs 3 components using a rigid, consistent methodology:
- The SHI, as it taps directly into consumer spending, is weighted at 60%.
- The LMCI, our labor market health barometer, is weighted at 20%.
- The ’10/3 spread’ – a barometer of bond market confidence – will also be weighted at 20%. (However, to ‘right size’ the value in relation to the SHI and the LMCI, we will multiply a positive reading by 10X and a negative reading by 20X.)
As I said in the July 13th BLOG (https://terryliebman.wordpress.com/2016/07/13/steak-house-index-shci-update-7132016/) if all three of our metrics simultaneously achieved floor or peak values, the SHCI can range from a low of negative 22.1 to a positive 104. Let’s see where we are today:
- UST 10 Year/3 Month ‘spread’: Tracking the data, weekly ending Tuesday, our latest FRED reading (yesterday) is 1.89%. The spread has increased almost 1/2% since our last SHCI. A huge increase.
- Labor Market Conditions Index: The LMCI released on Monday was a positive 1.5 — and follows five months of positive readings! This is quite an improvement and a very positive trend:

Remember, the reported data changes as current, more accurate information becomes available. You may recall from my October 12th blog (https://terryliebman.wordpress.com/2016/10/12/steak-house-index-shi-update-october-12-2016/) the June, August and September LMCI readings were negative.
No longer. Now, the LMCI is rather positive. Remember: The FED tells us, “the LMCI is derived from a dynamic factor model that extracts the primary common variation from 19 labor market indicators.” Thus, along with the official unemployment rate from the BLS, this is an important barometer in the FEDs toolbox.
Still, this reading is tame by historic perspective. Here’s an LMCI chart since the index was created:

It’s easy to see our current LMCI readings are still historically low. November’s index reading was positive, but a lukewarm 1.5. January of 2012, by comparison, was 12.5. Significantly better.
The yield curve is also showing strength and improvement:
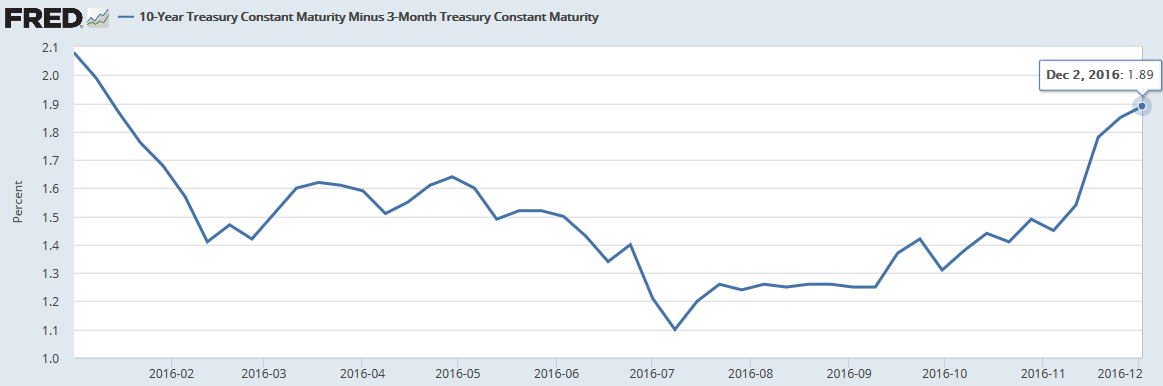
Since dipping in July, the spread between the 10-year CMT and the 3-month has been widening. You’ll recall this, too, is an indicator of a stronger, more robust economy.
This month our SHCI reading is UP to 11.42. This is a fairly significant increase from the prior two readings of 7.68 and 6.56.
Summarizing, it seems pretty clear to me UP is the word of the day: Consumer spending … stock markets … corporate profitability … employment …. Yes, today the US economy definitely appears to be on sounder footing.
Will the US GDP follow suit? How about the inflation rate? Perhaps. But I’m not yet convinced. Serious drags remain. We’ll talk more on these topics in next week’s SHI Update.
Finally, the FED December meeting begins in about a week. There is no doubt in my mind they will raise the funds rate by .25%. Any other outcome would shock me.
- Terry Liebman


2 Comments
A good read, Terry. Not surprised the SHI is up, given the month! 😉
You should take part in a contest for one of the best blogs on the web. I will recommend this site!