
‘Steak House Index’ / SHCI Update 7/13/2016
Nowcasting Update: July 1, 2106
July 1, 2016July 15 2016 Nowcast Update
July 15, 2016Great news! I’m back from France…and back at the computer, blogging away! Well, this is great news if you missed my witty, scintillating blog; if not, I guess this news is pretty, well, boring. 🙂
Interestingly enough, the French folks I met on my trip were neither ‘revolting’ nor were they financially depressed. Said another way, if the labor strikes or unrest in the news were still active, I saw no sign. None. Nor did their > 10% unemployment rate seem to affect spending. People were working…spending money at restaurants, etc….everything looked quite normal. Fascinating.
OK…let’s move on to a mouthwatering SHI and SHCI update. (Recall we’ll update the SHCI once a month, in the blog immediately following the release of the non-farm payroll numbers. Which occurs on the first Friday of every calendar month.)
And, as always, if you need a quick refresher, take a look at the original blog: https://terryliebman.wordpress.com/2016/03/02/move-over-big-mac-index-here-comes-the-steak-house-index/
The same holds true on the ‘Labor Market Conditions Index’. Here are the links:
The Labor Market Conditions Index
Why you should care: The US Department of Commerce ‘Bureau of Economic Analysis’ publishes the most recent GDP figures the instant they’re available.
Here’s the problem: GDP numbers are not proactive … we seem them months after economic events have occurred. Which means we can’t make financial/investment choices – personal or business – before the economy turns sour … only after.
Not good. We want advance notice of an economic decline. The SHI may help give you that. Our objective with the SHI is to be predictive, to anticipate when the economy is going to ‘turn’ and give you the ability to take action early – not when changes are too late.
Taking action: Just keep up with the weekly column. If the index changes appreciably – either showing massive improvement or significant declines – indicating expanding economic strength or a potential recession, we’ll discuss possible actions at that time. Trending is very important…and we’ll watch the trend.
THE BLOG:
The latest LMCI was released on July 11th – just 2 days ago. As you can see on the graph below, the June reading was a negative (-1.9):
(click to enlarge)

I’ve modified the graph. I’ve added red lines where (1) the LMCI moved from a positive to a negative trend AND subsequently the economy entered a recession; and, (2) black arrows where the LMCI moved from a positive to a negative trend but did NOT precede a recession. 5 red lines…3 black arrows.
The June reading continues the 2016 trend: Every month this year the LMCI has reflected a negative value – the longest continuous decline since 2009 – the end of the Great Recession. Could this trend indicate a recession is coming soon?
I don’t think so. The June reading, at -1.9 is actually an improvement over the negative May reading of -3.6 (revised and improved slightly from last month). Let’s continue to watch.
What is the yield spread telling us? You’ll recall that almost every time the 10Y CMT/3M CMT spread goes negative, our US GDP goes negative. See the red lines below:
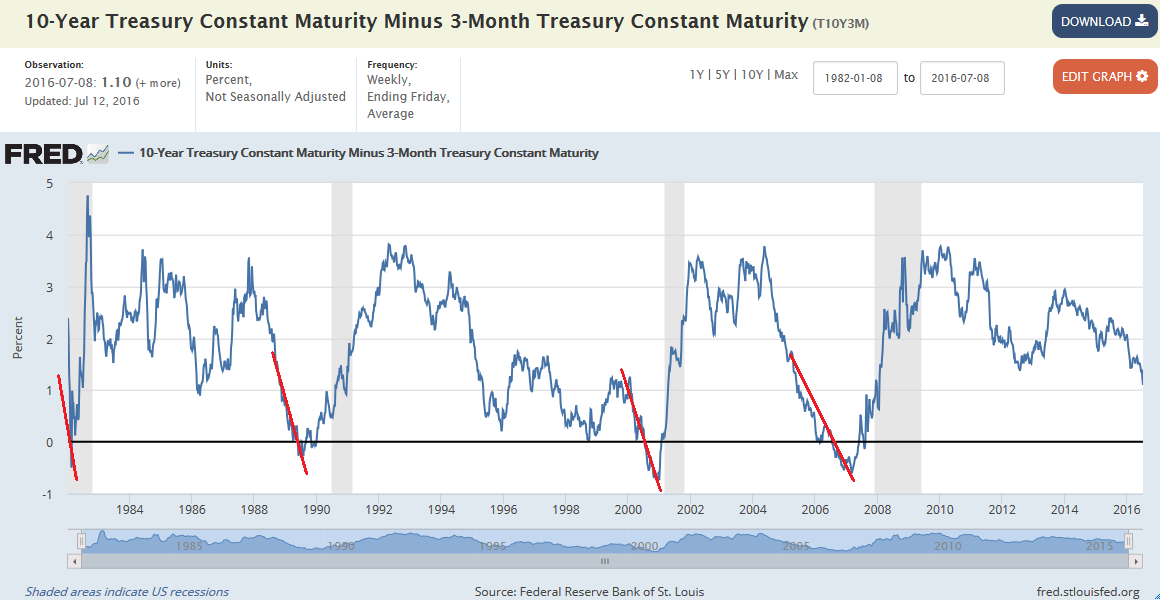
Well, good news. Today’s spread remains quite positive. 1.10%. Sure, the spread is smaller by historic perspective, but I feel this is more a reflection that ALL interest rates are lower today than an indicator of economic weakness.
All this blogging has made me hungry! Let’s go to the steakhouse!
Be still my heart! The Capital Grille is unavailable at 7:00 pm this week! Wow…that is new! Of course, what’s not new…Mastro’s is fully booked, once again, until 9:00 pm. Ruth’s Chris, on the other hand, has a ‘swiss cheese‘ sporadic availability until 7:30 pm.
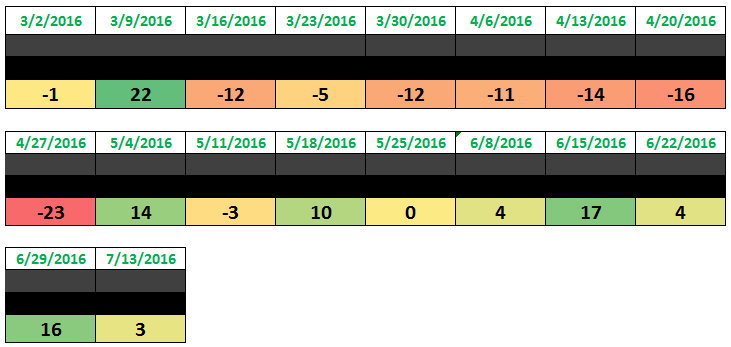
Here are this week’s results: 
Thus our SHI reading is a positive 3. A solid reading…but not too high nor too low. Right in the middle. Here’s the trend since we began tracking the index:
Consumers appear to remain confident. By this metric, consumer spending (and the economy as a whole) appear firm.
Let’s now do a ‘Steak House Composite Index’ calculation. Recall the SHCI is intended to be a multidimensional view of US economic strength. As we’ve discussed, it brings together the SHI, the LMCI and the 10Y/3M yield spread.
Today’s LMCI reading is (-1.9). The 10Y/3M today is 1.10%. And our SHI is a -3.
The SHCI combines and weighs the 3 using a consistent methodology:
- The SHI – our ‘consumer spending’ barometer – will be weighted at 60%.
- The LMCI, our labor market health barometer, will be weighted at 20%.
- The ’10/3 spread’ – a barometer of bond market confidence – will also be weighted at 20%. (However, to ‘right size’ the value in relation to the SHI and the LMCI, we will multiply a positive reading by 10X and a negative reading by 20X.)
Doing the math, today’s SHCI reading is 6.82. Our 3 metrics, the 10Y/3M spread, the LMCI and the SHI, are weighted at 6.6, (-.38), and .6, respectively.
This reflects a slight decline from our first index reading of 11.44. Is this decline meaningful? Not overly. Let’s continue to follow the trend.
In the last SHI update, I commented SHCI readings could range from a negative (38), or even a bit more, to a high of a positive 58. Checking my math, I find I miscalculated. The actual range is from a negative 22.1 to a positive 104. At 6.82, we’re slightly positive but still demure.
All in all, both the SHI and the SHCI seem to indicate our economy remains steady, firm, but in no way ‘overheating’. Steady as she goes.
- Terry Liebman


3 Comments
I wonder how Steakhouses are doing in Houston compared to Orange County. How would that effect your index? Maybe you should throw in one from down there.
[…] I said in the July 13th update (https://terryliebman.wordpress.com/2016/07/13/steak-house-index-shci-update-7132016/) if all three of our metrics reached their peak values – simultaneously – the SHCI can range […]
[…] I said in the July 13th BLOG (https://terryliebman.wordpress.com/2016/07/13/steak-house-index-shci-update-7132016/) if all three of our metrics simultaneously achieved floor or peak values, the SHCI can range from […]