
The Rise of the Central Bank
SHI: Steak House Index UPDATE 9/14/16
September 14, 2016The Steak House Update 9/21/16
September 21, 2016In economically advanced nations, all across the global, unusual financial events continue to unfold.
It’s as though we’ve stumbled across a new, bizarre species in an Amazon rain forest. Many economic experts believes this new species is the creation of the major central banks, or more specifically, the result of massive central bank asset growth. And those same experts share concern this beast at some future time may destroy the economies of these developed nations.
What is this frightening new species? An out-of-control asset bubble.
Where expert opinions diverge is on the issue of whether this unique creature will save our economies or ultimately kill them. Although lately, more are in the ‘kill’ camp.
Who’s right?
First a brief history. Since the time the FED was established in 1913, with few exceptions, the FEDs asset level has been fairly stable:
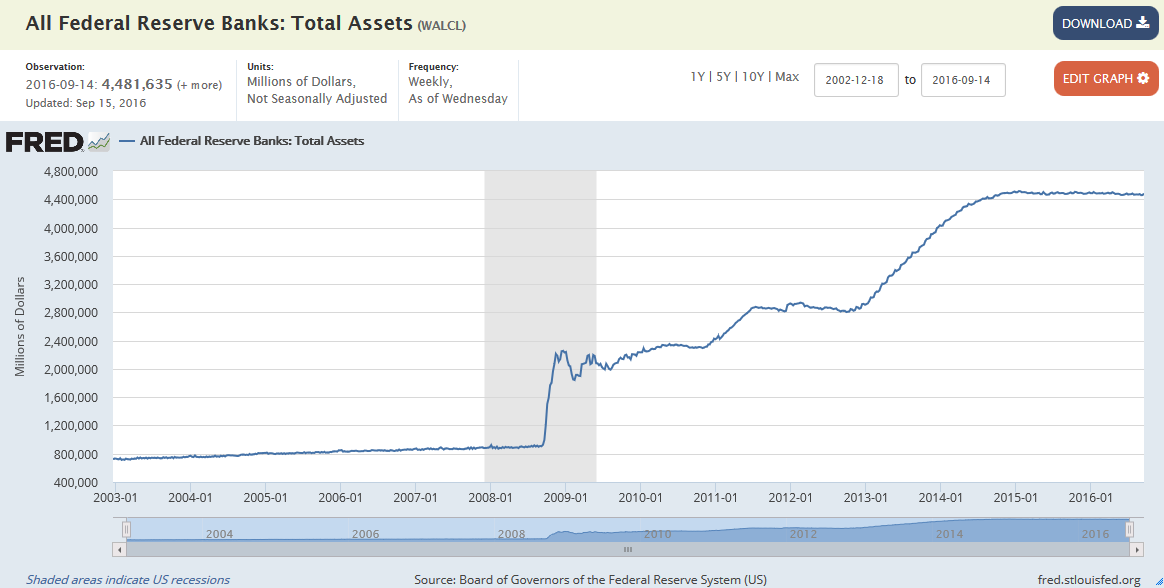
Until 2008. Quantitative Easing had begun. The FED purchased US debt instruments using cash it created electronically.
And every other major central bank followed suit. They really had no choice: As the largest economy on the planet the US set the agenda: Any country’s failure to match FED QE pari passu would have made their country’s currency more valuable (compared to the USD), their exports harder to sell, and their economies weaker. Pretty soon, United States QE was exported to the economies of every developed nation.
With the ‘Great Recession‘ just barely in our rear-view mirror, the FEDs plan was laser-focused: They sought to lower interest rates and inspire greater investment in ‘risk’ assets which, they believed, eventually would rekindle and more rapidly grow US GDP. Other central banks had the same expectation for their economies.
Today, we find ourselves here (graph courtesy of Dr. Edward Yardeni):
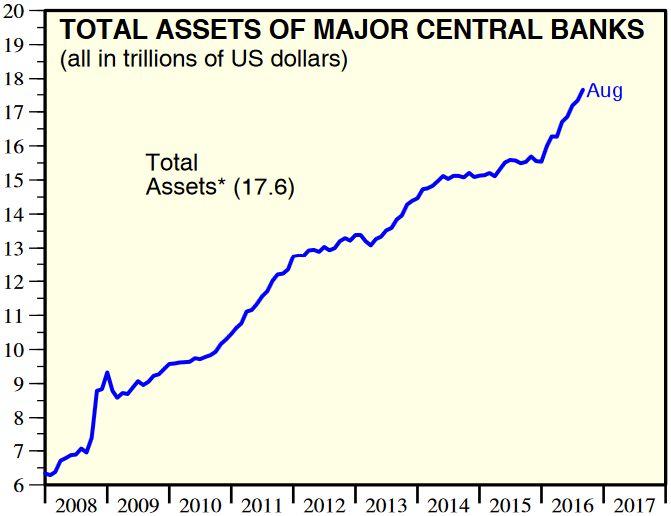
(This is worth a look. Here is Dr. Yardeni’s piece on Central Bank Balance Sheets: http://www.yardeni.com/pub/peacockfedecbassets.pdf)
We see major central bank assets have increased more than $11 trillion dollars since 2008. In the aggregate, they’ve almost tripled. That’s a lot.
Today, many experts now believe the result of the massive QE, and resulting decline in rates, has led to an equally massive increase in asset values here in the US and abroad. Many believe there is a direct link between the two.
Here’s a chart from the most recent FED Z.1 “Financial Accounts of the United States”, published on September 16:
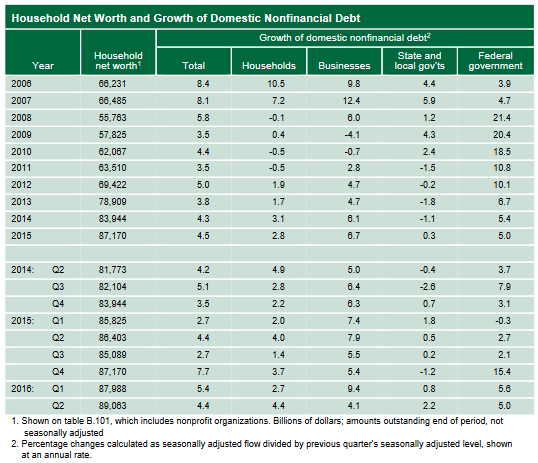
Of course it’s no surprise to see the huge drop in household net worth between 2006 and 2008. Housing values, and the value of many other assets, plummeted nationally.
Notice that drop, too, is about $11 trillion. But today, household net worth has eclypsed $89 trillion – an over $33 trillion increase! An increase of more than 58%!
Clearly, the net worth of US households has risen significantly in recent years.
If the experts are right, then, we would expect to see an identical asset value increase across all other major developed nations who experienced similar increases in central bank assets, right?
Well, expect it or not, that didn’t happen.
Let’s take a look at China. Since 2008, the assets of the Peoples Bank of China (PBOC) grew in lock-step with the FED:
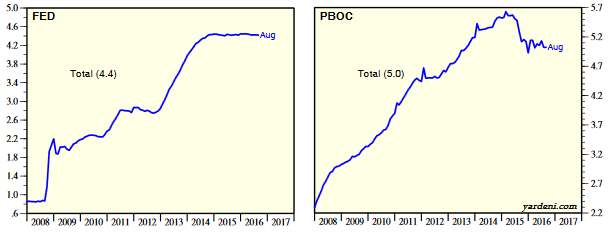
While the FED balance sheet has increased to where they have about $4.4 trillion in assets today, the PBOC has closer to $5 trillion – more than the US!
And, yes, China has seen a MASSIVE increase in asset values as reflected in their ‘net national wealth’ (NNW) growth: Between 2000 and 2o15, their NNW increased from $4.6 trillion to $22.8 trillion. Staggering.
But the story is very different in Japan.
Today Japan’s interest rates are sub-zero and it’s central bank debt has climbed more than in any other country. Yet, between 2000 and 2015, the ‘net national wealth’ of their citizens increased insignificantly (in USD): from about $19.3 trillion to about $19.8 trillion.
In these two time-aligned charts below, it’s easy to see the correlation, and likely causation, between interest rates and the BOJ asset levels:
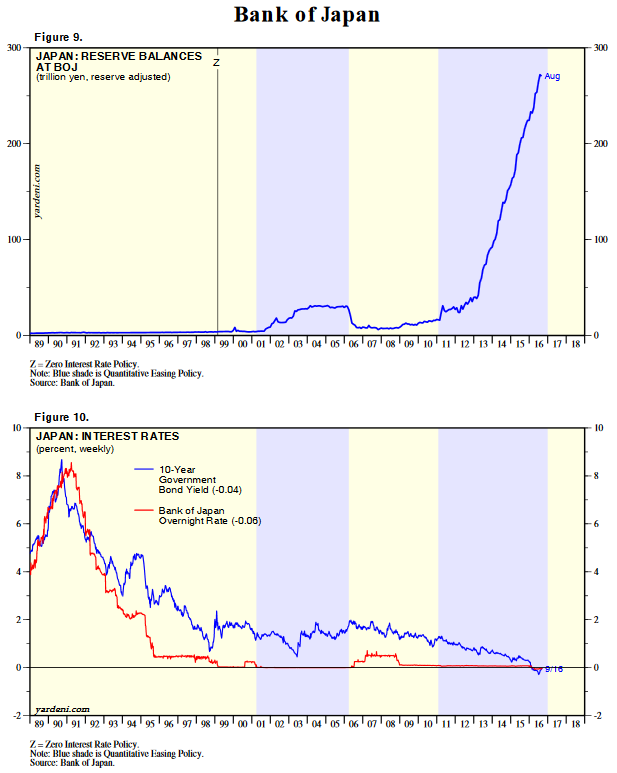
Yet the value of their citizen’s net worth has remained almost unchanged.
Which begs the question: While QE may be correlated with the growth in asset value, is it caused by QE? Remember, correlation and causation are two very different things.
If QE is the cause of unexpected and unintended asset inflation, we would expect the identical experience cross all developed countries. But this is not the case.
The Japanese central bank (BOJ) has inflated its balance sheet more rapidly than any other developed nation, yet as you can see below, the change in their ‘Net National Worth’ (NNW) during this same time frame is almost negligible. How have other developed nations fared?
Let’s take a look. Here is a cross-section, in order from the largest NNW increase (between 2000 and 2015) to the smallest:

(The data is courtesy of Credit Suisse. Here’s the entire data set: http://publications.credit-suisse.com/tasks/render/file/index.cfm?fileid=C26E3824-E868-56E0-CCA04D4BB9B9ADD5)
Since 2008, FED assets have increased over 5X. Compare this to the growth in Chinese central bank (PBOC) assets during the same time period: about 2.2X. So, as a percentage of 2008 assets, US central bank assets have grown more than twice as much as the assets of China’s central bank.
Yet between 2000 and 2015, while the NNW of the US grew about 100%, while China saw an almost 390% lift! And between 2010 and 2015, the US/China numbers for NNW growth are about 50% and 30%, respectively.
Clearly the equation is more complex than a tenuous link between central bank asset growth and NNW. So what’s really at work here?
It appears to me we have a bit of a chicken and egg conundrum here.
The missing ingredient here is the rate of GDP growth. Where QE proved successful in spurring increased rates of GDP growth, or where GDP growth rates were already strong, NNW growth rates were also strong. Let’s add a column to the chart above:

Now this is making more sense. Countries with stronger GDP growth rates experienced greater lifts in NNW. Regardless of whether or not higher GDP growth rates were organic or the result of QE, in most cases the greater the growth rate in GDP, the greater the growth rate in NNW.
The problem, it seems, is the fact that QE itself is not always able to spur higher GDP growth rates. We’ve seen this play out in Japan…and more recently, in Europe.
But does QE alone spur asset bubbles? It appears the answer is no. Not in Japan … not in the EU. Both are recipients of massive QE. Between 2010 and 2015, net national wealth declined in both.
Many experts are also concerned by the fact that the current level of central bank assets is unprecedented. But this is not the case.
The most recent round of QE in the US ended in 2014. Around that time the St. Louis FED wrote an interesting paper related to this topic … and while the data is a bit dated, it remains applicable today, with some minor adjustment.
(For the full release: https://www.stlouisfed.org/~/media/Files/PDFs/publications/pub_assets/pdf/re/2014/a/balance_sheet.pdf)
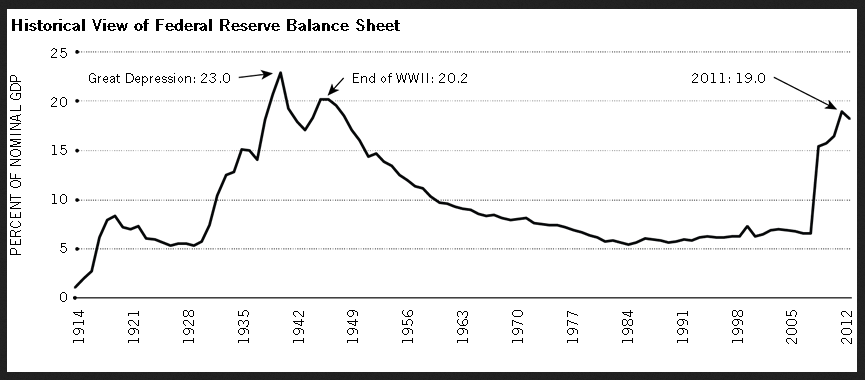
As a percent of nominal GDP, the FED’s assets are lower than they were after the Great Depression. And many experts would argue the FED didn’t inject enough liquidity into the economy in the 1930s:
Here is a chart comparing the recent US QE experience (and the FED) – again as a percent of nominal GDP – against the QE experience at the ECB, BOJ and BOE:
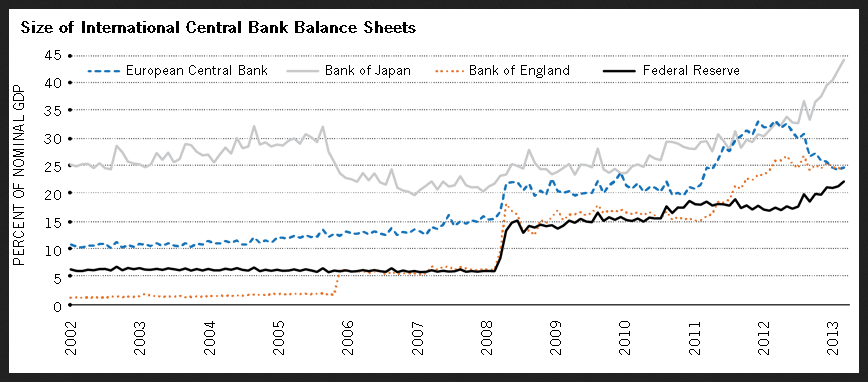
As we can see above, with the exception of Japan, QE finished around 22-25% of nominal GDP by the end of 2013. Today, the US remains near 24% while continued QE by the ECB has lifted the ECB assets above 30% of nominal EU GDP at the end of 2015!
Yet only the US and UK experienced significant asset value increases.
Let me summarize.
Many experts believe the recent QE “experiment” portends impending disaster on some future date. Not far from here. Perhaps. This may very well be true. I have some concerns as well.
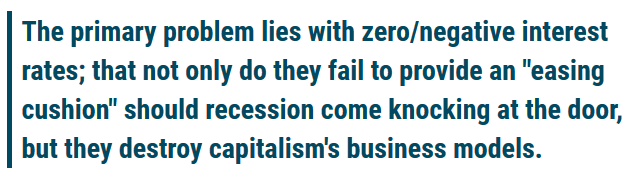
There is no doubt that across the globe QE has certainly produced very low interest rates, and have possibly reset future rates at lower levels than ever before. In his latest BLOG, Bill Gross suggests:
(Here’s his entire blog: https://www.janus.com/insights/bill-gross-investment-outlook)
Again, perhaps. But if Schumpeter’s ‘creative destruction’ premise is alive and well today, as Mr. Gross suggests in his blog, current circumstances may simply be another example of that theory at work.
Obviously, time will tell. And while we’ll be watching carefully, make no mistake, the future is not yet written. Asset bubbles are not necessarily being created … and Capitalism is not yet dead.
- Terry Liebman


3 Comments
Well said. Very informative.
[…] Of course, the central banks can impact this condition. If they choose to. Remember, they hold about $18 trillion in assets today, up about $11 trillion since 2008. (Here’s my blog on this topic: https://terryliebman.wordpress.com/2016/09/18/the-rise-of-the-central-bank/). […]
Thank you for sharing superb informations. Your web site is very cool. I am impressed by the details that you’ve on this site. It reveals how nicely you perceive this subject. Bookmarked this website page, will come back for extra articles. You, my friend, ROCK! I found simply the information I already searched all over the place and simply could not come across. What an ideal site.