According the the ‘Urban Dictionary’, if you’ve said, “Do you want fries with that?,” you probably work at McDonalds and are at the pinnacle of your career. Perhaps. But one thing I know for certain: In 2017, if you live on your social security income, you won’t be getting fries with your COLA. You can’t afford it. Let alone a steak at Mastros.
Happy Wednesday! Welcome back to the steakhouse!
As always, if you need a refresher on the SHI, or its objective and methodology, I suggest you open and read the original BLOG: https://terryliebman.wordpress.com/2016/03/02/move-over-big-mac-index-here-comes-the-steak-house-index/)
Why You Should Care: The US BEA publishes GDP figures the instant they’re available. Unfortunately, it is a trailing index. The data is old news; it’s a lagging indicator. I’d sure like to know how the economy is doing in advance of the GDP release, wouldn’t you?
Personal consumption expenditures, or PCE, is the largest component of the GDP. In fact, the majority of all GDP increases (or declines) usually result from consumer spending. Clearly this is an important metric to track.
It’s my hope the SHI can help. I intend the SHI is to be predictive, anticipating where the economy is going – not where it’s been. Thereby giving us the ability to take action early. Not when it’s too late.
Taking action: Keep up with this weekly BLOG update. If the index moves appreciably – either showing massive improvement or significant declines – indicating expanding economic strength or a potential recession, we’ll discuss possible actions at that time.
The BLOG: The price of Mastro’s 22-oz Bone-in Ribeye is pretty darn high.
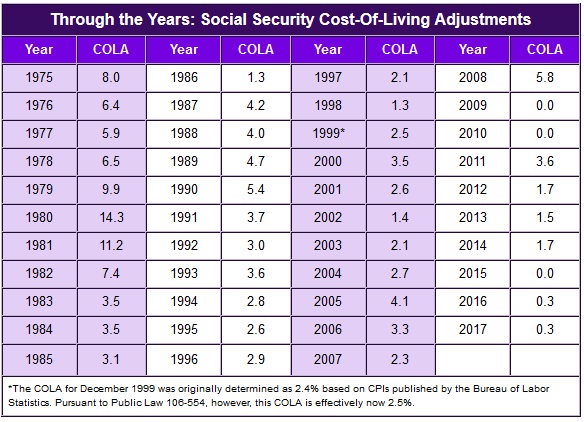
And if you’re living on Social Security, your 2017 ‘cost-of-living-adjustment‘ or COLA isn’t going to help much. According to the federal government, 65 million Americans will see their monthly benefit increase a whopping 0.3% next year. The average check will increase by about 5 bucks each month. This follows an identical increase in 2016. And a zero (zip, nada) increase in 2015:
No, these 65 million Americans probably won’t get fries with their COLA. They can barely afford the Big Mac. I suspect they’re also holding their collective breath … hoping inflation stays dormant.
The question retirees are asking, of course, is just that: Is inflation tamed?
Well, the jury is out. The IMF tracks commodity prices, and thereby potentially budding inflation, each month. A few weeks ago, they published this report: http://www.imf.org/external/np/res/commod/pdf/monthly/101116.pdf
Here’s a great graphic from the report:

OK, it’s easy to see why COLA increases in 2015 and 2016 were muted. Energy (the green line) – as we all know – led the way with a massive price decline from 2014 to the beginning of 2016. But things changed a bit early in 2016. Per the report:
“For the first nine months of 2016 commodity prices climbed 13%, led by a 23 percent surge in crude oil prices, followed by increases in metals and agriculture prices of 13% and 7%, respectively.”
Here’s a more detailed chart. As you can see, “Primary Commodities” declined from an index reading of 183.3 (2013) to 102.2 today. This staggering decline is responsible, to a large extent, for the global deflation fears over the past two or three years.

Q1:2016 was the bottom for most items on the list. Today, they’re moving in the other direction. Up. Ironically, in the macro, primarily driven by oil. Since February, other commodities have trended up too: Metals are UP 12% and agricultural commodities are UP 9%.
At question, however, is whether the latest up move in commodities is a trend or if its just another short-term peak within a trading range. I suspect we can easily answer the question for ‘energy’: We’re in a trading range. Demand, while growing, is fairly consistent. Supply is highly elastic – meaning, it will ebb and flow as the price-per-barrel increases and decreases.
Will other commodities do the same? While the answer to this question varies somewhat by the specific commodity, in the macro, once again, demand is fairly consistent today. Supply (production capacity) continues to exceed demand. As such, I suspect we will remain in a ‘peak and valley’ range for the foreseeable future. Prices will move down, production will diminish, prices will move up, production will increase. And repeat.
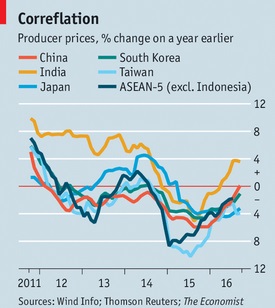
Producer prices (PP) in Asia have deflated fairly consistently since 2012. Take a look at the graphic below showing YOY price changes. (Below the red line indicates a price/cost decline from the prior year.) Early in 2016, however, PP in India began to head up. China has been the engine of both commodity price surges and the most recent decline. After 54 months of consecutive declines, producer prices in September increased slightly over the prior year – by 0.1%. Minuscule, but an increase nonetheless. With the exception of India, PP in other Asian countries probably remain in a deflationary cycle.
Again, at question, however, is whether the latest up move is a trend or if its just another short-term peak within a trading range. Meaning, are ASEAN-5 PP trending upward … or will they simply continue to ‘peak and valley’ between about 2% and negative -6% over time?
Let me summarize: These movements do not – by themselves – suggest that inflation is a concern. (Retirees can rejoice!) But they may suggest deflation fears, if any remain, can probably be put to rest. We’ll keep a close eye on these trends.
And we’ll keep a close eye on our dinner! Because “meat” – at least as an index reading – remains at about the same price as a year ago. Inexpensive really. Until, of course, it arrives at a Mastros steakhouse and, shortly thereafter, on your warm, beautiful plate. By then it is really expensive! Let’s see if these beauties are still flying off the shelf – or at least, the grill.
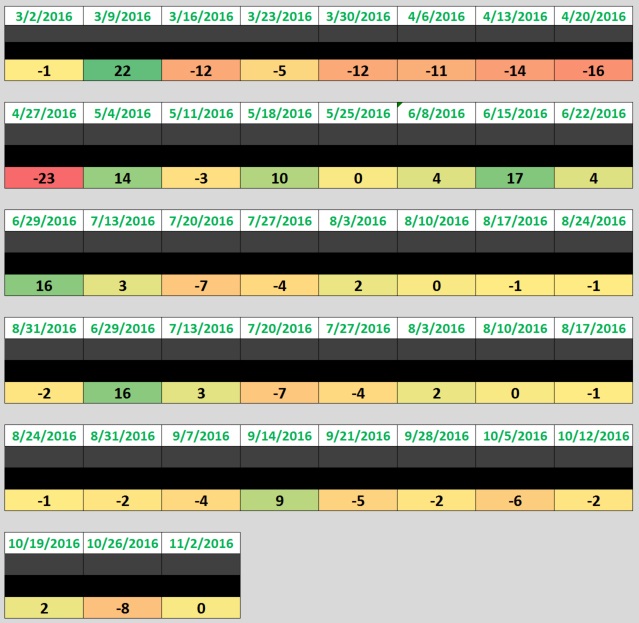
Which brings us back to the steakhouse! Here’s the grid update:

Today, OpenTable.com tells us no table for 4 is available this Saturday at Mastros within 2-1/2 hours of 7:00 pm. None. Zip. Nada. But tables at our other venues are open. Numerically, this week’s SHI reading has rebound – up to zero from last week’s reading of a negative (-8) this week. This is a reversal of the weakening consumer spending trend reflected in the past 6-8 SHI readings. Interesting.
Here’s our trend grid from SHI inception:
Needless to say, we have yet to see the full ‘spill-over’ effect where consumers, when denied a Saturday dinner opportunity at Mastros, begin to fill Ruth’s Chris and Mortons, and – god forbid! – tables at The Capital Grille. Booked tables at Morton’s suggests spill-over is in play, but not yet exceedingly robust.
Thus, our prognosis this week, once again, is consumer consumption behavior remains consistent, indicating GDP growth keeps chugging along, slow and steady, probably within the 1.5% to 2.0% annual range.


