
This is Quite Interesting
Who am I to Disagree with Jamie Dimon?
April 9, 2016Why You Should Care About Gas
April 13, 2016Coal is known to be a massive polluter. Which explains the global effort to move away from coal toward cleaner energy sources. So it might surprise you that the global use of coal, as a ‘source’ of energy, has actually increased over the past 4 decades. (It’s worth noting, coal use in OECD countries has declined from 22.6% to 19.3% during this period.)
What might surprise you even more, however, is that the use of another major global energy source has shrunk – significantly!
According to the International Energy Agency, in a publication entitled “Key World Energy Statistics 2015“, by 2013 the use of oil – as a percentage of the ‘Total Primary Energy Supply’ or TPES – had fallen significantly. Take a look at the numbers:

Here are the ‘pie’ graphs from the EIA report, the source for my calculation of the numbers above:
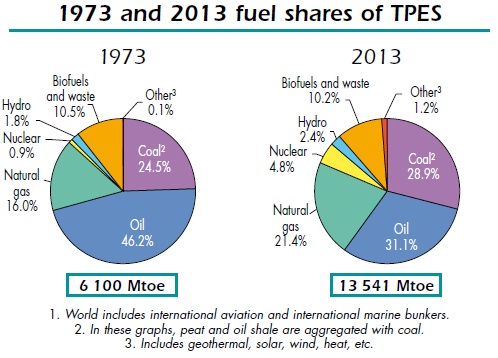
It’s important to note we’re talking percentages above – not the amount of oil used. That number has grown, on the average, by about 1.33% per year since the year 2000. Even after factoring in a 3.3% decline in demand in 2009.
Said another way, in 2000, the world ‘consumed’ 76,928 barrels of oil per day (BPD); in 2013 that number was 91,253 BPD. And it’s grown since: by the end of this year, demand is estimated to be at 96,740 BPD – a 6% increase over 2013.

What a fascinating trend. Think about this for a minute: Over the last 40 years, as a percentage of total energy ‘consumed’ by the world, oil use has declined. Yet every year (since 2000), the global demand for oil – in absolute numbers – has increased. By 1.33% per year.
Suppose oil demand in 2016 had remained at the 1973 TPES percentage of 46.2%? What would that percentage translate to in BPD? If in 2016, oil still contributed to 46.2% of total global energy consumed, the BPD required would exceed 135,500!
Which means something else has filled that void. Yes, coal use has increased. But I suspect the globe will continue to move away from coal use. For many reasons.
The other big increase is in natural gas. Natural gas production from shale – at least since 2007 – has exploded. Primarily here in the US. As a percentage of total, shale ‘dry gas production’ in the US has increased from only about 2% of total in 2000 to about 56% of all US natural gas production in 2015:

Even more staggering are the regional shale production numbers, shown in this chart:

In 2007, production from the Barnett shale formation spiked. Then, in 2009 and 2010 shale natural gas production from Haynesville and Marcellus exploded. Where are these formation? Take a look:

Measured in ‘Billion Cubic Feet’ shale natural gas production numbers – in total – are staggering. Here’s a visual from the EIA:
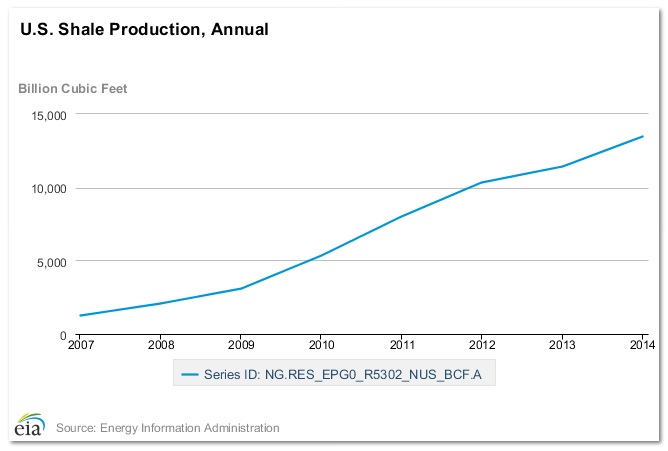
The numbers? Here you go: From 1,293 billion cubic feet in 2007 to 13,440 billion cubic feet in 2014 – an over 1000% increase in 7 years.
Which would explain why the ‘spot price’ for natural gas – from 2007 to today – has actually fallen more than the price of oil. Check out this graph:
(Note this is an ‘index’ graph – meaning the start point (on the left) is equal to 100. Every other reading is some percentage of 100.)
The gray area on the left side is the ‘Great Recession’ that ended mid-2009. That ‘dip’ in early 2012 hit a low of 27.4% – in dollars, $1.95 per million ‘British Thermal Units’ (mBTU). (Said another way, the price in December of 2007 was about $7.11 per mBTU.)
OK…this may be digging a bit too deep (no pun intended) … but it’s important to note these facts:
- While oil – as a percentage of global energy production – is trending down, shale natural gas is trending up – way up.
- Natural gas, and by extension, shale natural gas, have become almost as critical to global energy production as oil.
And despite today’s very low spot price – about $2 per mBTU – exploration continues.
Not here in the US…but in China. About 10 days ago – on March 31st – British Petroleum issued a press release saying:
“BP and China National Petroleum Corporation (CNPC) today signed a production sharing contract (PSC) for shale gas exploration, development and production in the Sichuan Basin, China. The contract is BP’s first shale gas PSC in China and covers an area of approximately 1,500 square kilometres.”
Finally, the press release opined:
“BP expects that by 2035 shale gas will account for a quarter of the total gas produced globally and China will become the world’s largest contributor to growth in shale gas production.” The world’s largest contributor? Hmmm…..
If interested, you can read the entire release here:
http://www.bp.com/en/global/corporate/press/press-releases/bp-and-china-national-petroleum-corporation-sign-shale-contract.html
And while this move into China isn’t the beginning of the global shale gas explosion, we’re very early in the game. The US EIA and USGS, back in 2013, put together this global map, showing existing and potential sources for shale natural gas:

Let me wrap up this post with these comments.
It’s clear natural gas is a critical piece of the global energy picture. The explosion of shale natural gas extraction here in the US – and the technology required for that extraction – is now spreading over the globe.
Some geographies won’t capitalize on the opportunity now. Prices are simply too low. Others – like China – who are huge energy ‘importers’ will push forward with exploration as a national strategic initiative. In spite of the low price.
Which means, most likely, today’s very low prices for natural gas are likely to remain for quite a while. And finally, by extension, energy costs are likely to remain constrained for the foreseeable future due not to limited demand, but to extensive supply.
What does this mean for future US inflation and US interest rate movement? I’ll save this for a future blog.
- Terry Liebman


0 Comments
My family members continue to suggest that harnessing the volumes of natural gas that I create would run a small country.
Willie Rosoff Best Practice Chair
714.501.4481 • mobile 949.673.3447 • immobile willie.rosoff@vistagechair.com http://www.vistage.com • ocvistage.com/willie-rosoff
Vistage International, Inc. 2626 Cove Street Corona del Mar CA 92625
This e-mail is a private communication and may contain confidential information. If you are not the intended recipient, please note that any disclosure, copying, distribution or use of the information contained in or attached to this e-mail is strictly prohibited. Please notify the sender of the delivery error by replying to this message and then delete this e-mail. Thank you.
>
I’ve heard you possess that admirable trait!
– T
[…] ← This is Quite Interesting […]