
SHI 07.08.26 – To Infinity and Beyond!

SHI 06 . 24 . 25 – The USA vs. The World
June 24, 2026
This is a macro-economic blog.
I don’t look closely at small things; they don’t interest me much. I attempt to embrace a much larger, much broader, much longer-duration trends and viewpoints when discussing the foundational economic and financial data that powers my blog posts. In my opinion, this approach lends itself perfectly to long-term decision and investment strategies. These are the outcomes that are important to me. I hope they are equally important to you.
“
We are macro-economists.“
“
We are macro-economists.“
For example, a few months back I dug into the effects of Japan’s exceptionally low fertility rate and the resulting demographic impacts. Not only is their population shrinking but it is also rapidly aging. And at the same time, younger Japanese folks are choosing to live in the bigger cities over suburban or rural living. This trend began decades ago and, if unchecked, will continue for decades more.
The current impacts on housing values and GDP growth within Japan are measurable. Unabated, over the much longer term this trend will have even more sweeping debilitative economic impacts on Japan – speaking from an investment perspective. Future home values in many areas will plummet; some will even become valueless.
But it will be years – perhaps even decades – before these results are realized. Things can change. And they might. But investment decisions must be made now. So these macro-economic data must become our framework for making those decisions today.
Thru that lens, today we begin with a chart, courtesy of Dr. Ed Yardeni, and consider the current and future implications on the US capital markets and GDP growth. Ready?
Welcome to this week’s Steak House Index update.
If you are new to my blog, or you need a refresher on the SHI10, or its objective and methodology, I suggest you open and read the original BLOG: https://www.steakhouseindex.com/move-over-big-mac-index-here-comes-the-steak-house-index/
Why You Should Care: The US economy and US dollar are the bedrock of the world’s economy. But is the US economy expanding or contracting?
Expanding … according the ‘advanced’ reading just released by the BEA, Q4, 2025 GDP grew — in ‘current-dollar‘ terms — at the annual rate of 5.1%.
The ‘real’ growth rate — the number most often touted in the mainstream media — was 1.40%. In current dollar terms, 2025 US annual economic output reached almost $31.50 trillion.
According to the IMF, the world’s annual GDP will expand to over $126 trillion in 2026. Of that amount, the US makes up over 25% — expected to reach $32.4 trillion by the end of 2026. Further, IMF expects global GDP to reach almost $135 trillion by 2028 — an increase of more than 28% in just 5 years.
America’s GDP remains around 25% of all global GDP. Just four countries—the United States, China, Germany, and Japan—generate roughly half of all economic activity worldwide. Collectively, the US, the European Common Market, and China generate about 70% of the global economic output. These are the 3 big, global players. They bear close scrutiny.
The objective of this blog is singular.
It attempts to predict the direction of our GDP ahead of official economic releases. Historically, ‘personal consumption expenditures,’ or PCE, has been the largest component of US GDP growth — typically about 2/3 of all GDP growth. In fact, the majority of all GDP increases (or declines) usually results from (increases or decreases in) consumer spending. Consumer spending is clearly a critical financial metric. In all likelihood, the most important financial metric. The Steak House Index focuses right here … on the “consumer spending” metric. I intend the SHI10 is to be predictive, anticipating where the economy is going – not where it’s been.
Taking action: Keep up with this weekly BLOG update. Not only will we cover the SHI and SHI10, but we’ll explore “fun” items of economic importance. Hopefully you find the discussion fun, too.
If the SHI10 index moves appreciably -– either showing massive improvement or significant declines –- indicating growing economic strength or a potential recession, we’ll discuss possible actions at that time.
The Blog:
A couple month ago, I wrote this blog:
SHI 5.10.26 — Should YOU Build a Data Center?
Open it up and take another look at the South Korean stock market graphic.
And then take a look at the red line in the one below, again courtesy of Dr. Ed Yardeni
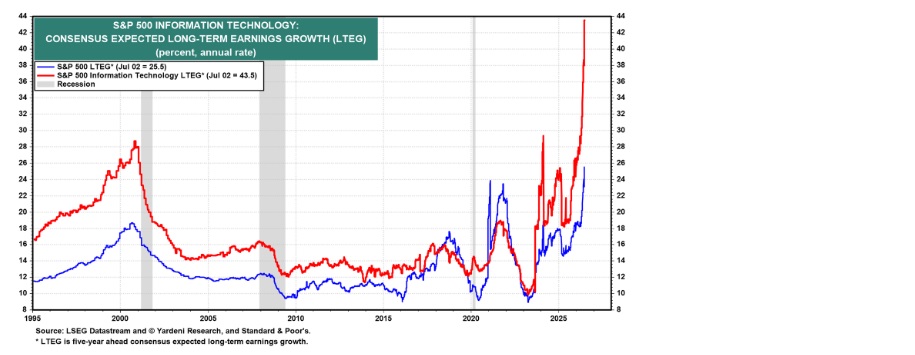
Not too much different, right? Consider these graphs from a directional perspective only. They are tracking different data, although “earnings” play into both.
Corporate earnings. I’ve talked about this concept a number of times before. Because corporate earnings and GDP growth are highly correlated. Even better, there is causation within the numbers, too. Consider the red and blue lines above. Let’s dig in.
The IBES (Institutional Brokers’ Estimate System), now owned by the London Stock Exchange, produces an analyst consensus database. It is called the “LSEG Datastream” and this is the source for the Yardeni chart and data above.
The IBES continuously collects estimates from more than 19,000 analysts from over 950 firms covering 90+ developed and emerging markets across the globe. This group includes every major Wall Street equity analyst (Goldman Sachs, Morgan Stanley, etc.) and thousands more. In other words, this is a very, very broad sampling containing a massive amount of research. Mind you, that doesn’t mean it’s conclusions are “right” … it simply suggests the data set is very comprehensive.
From that data, they compute a variety of consensus statistics, including “long-term earnings growth” forecast (LTEG). Data suggests as many as 23,000 companies are ‘covered’ by this research. Users like Yardeni access the data through products such as LSEG Workspace, Bloomberg, or FactSet.
OK, let’s jump back to the Yardeni chart.
First, note the date: July 2nd. Even though the data set is continuously updated – and likely evolved further in the past week – Yardeni’s data is less than a week old. So, restating the consensus conclusion, as of July 2nd the analysts believed that the LTEG for the “information Technology” sector of the S&P500 has exploded to 43.5% per year – compounded annually for the next 3-5 years! That is staggering.
Perhaps even more impressive, the growth consensus for the entire S&P500 earnings is an annual 25.5% — again compounded annually for 3-5 years. Doing the math, essentially the consensus opinion is telling us that the earnings for the 500 companies in the S&P500 will essentially double in the next 3 years. Further, the 43.5% figure suggests the Information Technology company earnings will triple in that same period.
Again, staggering. Are the analysts right? Almost certainly they are not. In the immortal words of Yogi Berra, “It’s tough to make predictions, especially about the future.”
I love that quote. 🙂
I suspect Yogi’s admonition will hold true here as well. The prediction is likely wrong. But is it too high or too low? Regardless, the consensus opinion itself is amazing.
Thru my macro-economic lens, if these consensus data prove true – or even close – the implications for the equity markets and US GDP growth are also massive.
Remember: The equity markets are essentially a pricing mechanism for corporate earnings. You can debate the multiple, but assuming it remains about where it is – say 20X earnings – if earnings double in the next 3 years, so will the S&P500 index. But if this happens – or anything close – does this have an adverse effect on the consumer? Remember, about 70% of all GDP activity here in the US is generated by consumer spending. Does increased corporate earnings translate to reduced consumer income and spending? Is this essentially a zero-sum game? In other words, if corporate earnings increase, will their increase come at the expense of the consumer? Either in higher consumer prices or lower disposable income, effectively counterbalancing any gains at the corporate level?
I think the answer is no. I believe corporate earnings, disposable income and GDP can all grow in lock-step. Historically, thru prior industrial and technological booms, that relationship has held true. So, no, I don’t think we’re in a zero-sum game this time.
My take is overall labor productivity, powered by the adoption of AI resources, will grow significantly thereby triggering significant above trend GDP growth. And when this dynamic plays out, the GDP growth rate will far exceed the growth rates of both the US population and the labor force. When that happens, I expect we will see a HUGE jump in GDP per capita. When that happens, in the macro, “everyone” wins.
Well, sort of. The US economy as a whole wins, but it will probably feel like a zero-sum for some specific groups of people. If the earnings forecast proves true and it is the result of substituting capital (AI and automation) for labor (human workers), our GDP growth will look amazing, and corporate profits will soar. However, worker displacement is a real concern. This could cause a painful transition period.
This tangent is a actually a much longer conversation, as there will be clear ‘winners’ on one side of the ledger and the ‘displaced’ or ‘disadvantaged’ on the other. There is no doubt in my mind this process will be extremely beneficial for the economy overall, but the dispersion of benefit will not be equally distributed.
To repeat, history and research suggests a massive spike in corporate earnings will not destroy the consumer because wealth and economic growth are not a zero-sum game. History has proven time and time again that the US economy is not a “fixed size,” like a big apple pie — where if an S&P500 company takes a bigger slice of profit, the consumer must get a smaller slice of income. In reality, that US economic pie itself can, and will, expand due to expanding productivity.
The concept of productivity can take us down another rabbit hole, so I’ll make this simple statement and then we can more on: Since the industrial revolution, each new “invention” helped increase “labor output” over time. Essentially, the same amount of labor produced an increasing amount of economic benefit. I believe the same will happen now, as AI tools are more widely adopted. And when this happens, I expect to see that jump in GDP per capita I discuss above.
Let me get back to those astonishing earnings numbers for a moment, and then we’ll move on to the Steakhouses where an interesting conflict appears to be developing! (Nice teaser, right?)
Doing a bit of “back-of-the-napkin” math, I wanted to see how the LSEG Datastream forecast projects the “normal” companies in the S&P500 will perform in that same 3-5 year time frame. In other words, I wanted to extract the impact of the “Information Technology” (IT) sector of the S&P500 in order to understand how companies like Coca-Cola, P&G, and Cummings are expected to perform. Subtracting the IT companies, we have 433 “normal” companies from the other 10 S&P500 sectors. Due to weighting, these make up about 68% of the value of the index. Here’s the point: The math tells us analysts, in the aggregate, expect those other 10 sectors to grow at an annualized, compound rate of about 17%. Meaning that in the next 3 years, the analysts believe the earnings for those “normal” companies will increase by 60%!
How does this forecasted growth rate compare to historic growth numbers? Historically, this group realizes 6-8% in annual earnings growth. 17% is a massive gain. It bears repeating that this is a massive forecast. And it’s not from one or two fringe analysts. It’s from all of them. In the aggregate.
What do these earnings forecasts imply for the potential value growth of the S&P500 index in the next 3 years?
The math there is easy. If the PE ratio stays around 20X, I’ll leave the math to you. 🙂
Summarizing, if we split the S&P500 apart to glimpse into the 3-5 year corporate earnings growth forecast from the global analyst community, we see a collective belief that Information Technology company earnings will increase by 3X; the S&P500, in the aggregate, will increase 2X; and, finally, the 10 other sectors will realize a 60% growth in earnings in the next 3 years. Extraordinary.
To the steakhouses!
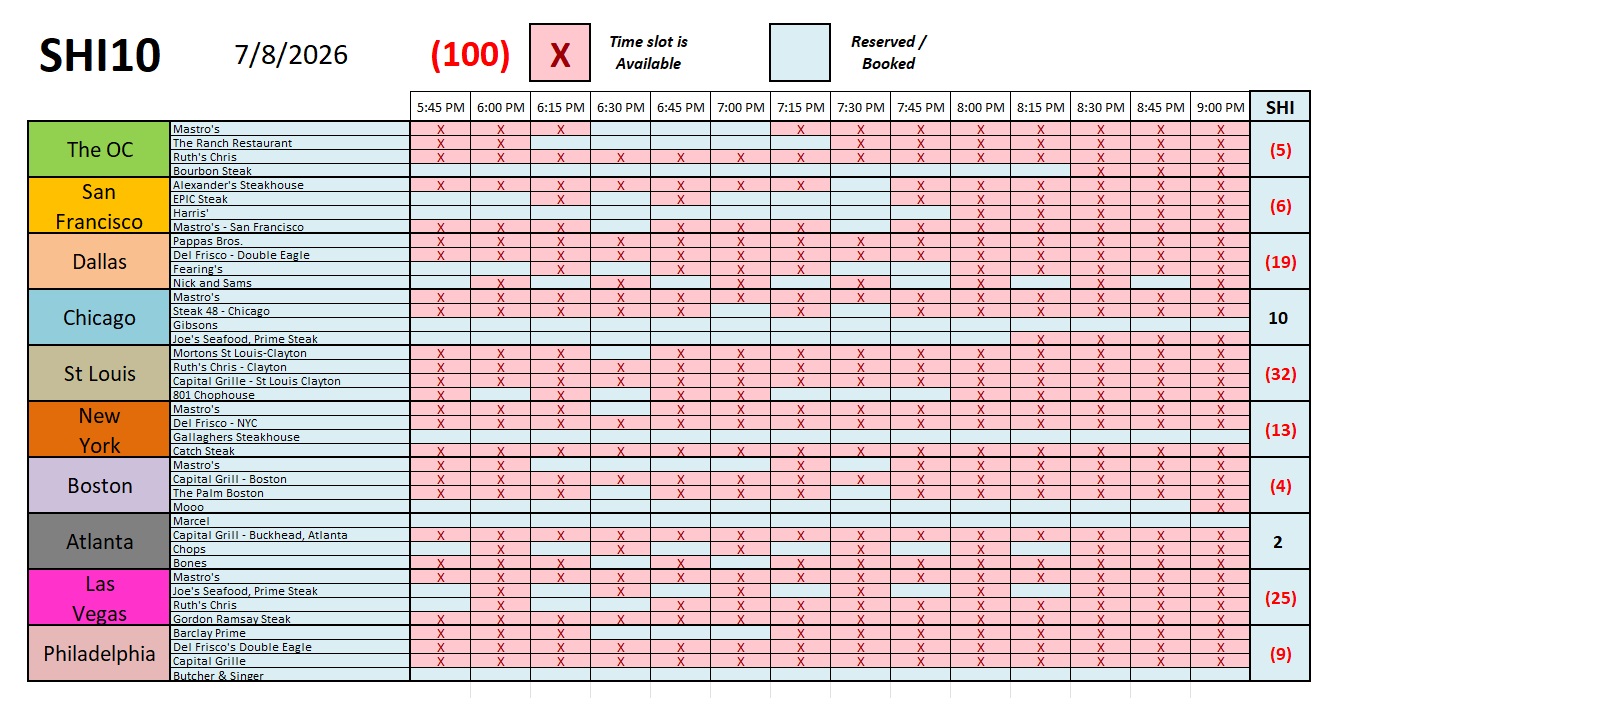
Interestingly enough, the red ink in the weekly chart above is ubiquitous. Obtaining a reservation on Wednesday for a 4-top at our expensive eateries this coming Saturday was pretty easy. Other than “Gibsons” in Chicago, Gallaghers in NYC, Marcel in Atlanta, and Butcher and Singer in Philly, the number of open tables is huge.
The grid below shows the longer term trend. Take a look:
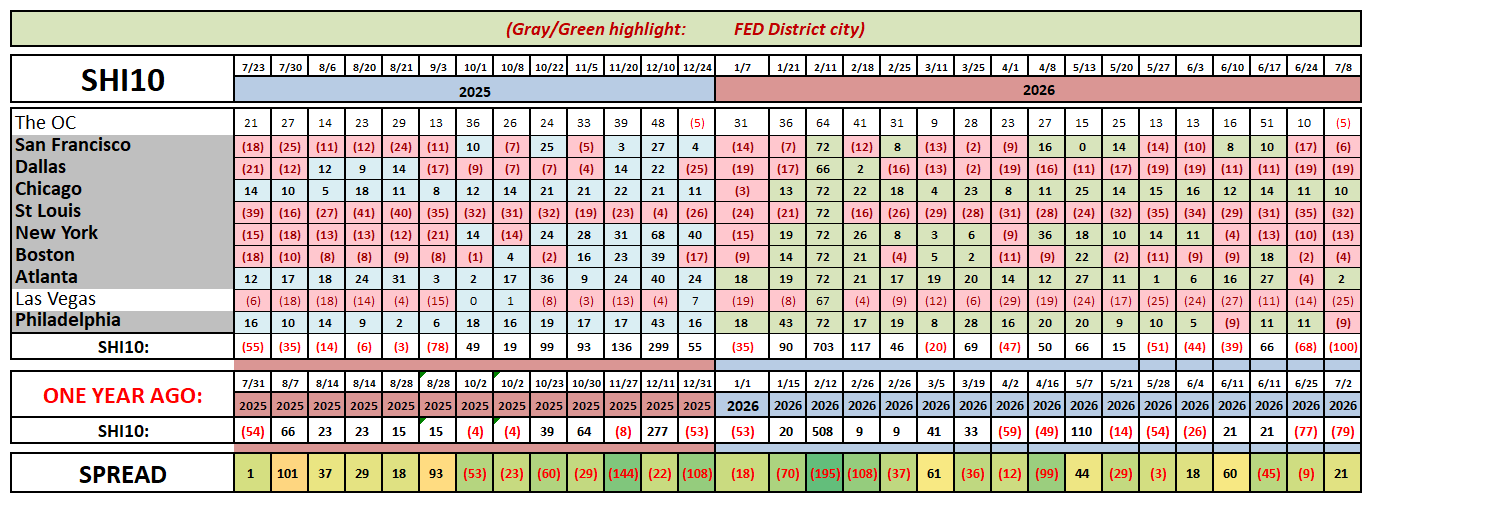
Arguably, these results aren’t dismal. But they are not good. And they are trending poorly.
Which is ironic when we compare these results to my comments above around earnings growth forecasts. Is the developing SHI weakness simply frictional? Or are wealthier, thick-walleted (is that even a word?) consumers somehow already feeling the impact of AI adoption and income/earnings rotations? Might this data suggest the idea this whole thing might be more of a zero-sum game than I attribute above? Perhaps. Its hard to say right now. But we will be watching this conflict closely.
One final observation around GDP that I feel is worth sharing.
You may recall this GDP discussion in prior blogs. The quarterly and annual GDP calculation is a simple formula adding four components:
GDP = C + I + G + (X – M)
Where:
C = Consumer Spending (Consumption). This number is the sum of household spending on goods and services. Things like groceries, healthcare, cars, restaurant meals, vacations.
I = Investment. This metric can be thought of as the sum of business spending on Capex for things like data centers, chips, equipment, software, factories, and inventories. It includes the construction of new homes. Excluded are “financial investments” in things like stocks and bonds.
G = Government Spending. Here we tally the federal, state, and local government purchases of goods and services.
X = Exports. ‘Goods’ and ‘services’ produced within the US and sold abroad increase GDP.
M = Imports. On the other hand, goods and services produced abroad, but purchased for importation into the US are subtracted because they are already included in ”consumption”, meaning business investment, or government spending. These goods and services were not produced within the US borders.
Imports can really move the needle here. Often in ways that might seem counterintuitive. Consider this: As we all know, the ‘megacap’ companies, in the aggregate, plan to spend more than $700 billion in 2026 on data center projects. Many of those projects have been or will be built within the US; some will not. Those located here in the US will generally buy land, use American contractors for construction services, buy American concrete, turbines, chips from American companies like Nvidia or Broadcom, high-bandwidth memory from Micron, and so on.
But here’s the rub: Nvidia, Broadcom and Micron are American companies. But they manufacture some portion of their chips overseas in places like Taiwan and South Korea. A large portion, actually.
Those chips must be imported into the US after manufacture. Imagine Amazon buys $1 billion of Nvidia chips for one of its data centers. That $1 billion adds to US GDP as an “I” or investment. But if the chips they buy from Nvidia actually cost Nvidia $250 million, which they paid to TSMC to make them, then that $250 million is subtracted from the GDP because it’s already included in the original $1 billion.
This dynamic will put a sizable drag on what otherwise would be a red-hot second quarter GDP number. According to the most recent Atlanta FED forecast model – known as GDPnow – net exports may have stripped off about 1.3% of annualized GDP in Q2. “Capital goods” imports reached a record high. Reuters reported this is most likely related to a “heavy investment in artificial intelligence.” Yep. Agreed. My research suggests that about 50% of the past quarter’s imports were somehow related to AI infrastructure.
Clearly we’re observing a wild dynamic we’re seeing right now in corporate earnings, AI infrastructure expansion, SHI reservation trends and GDP growth. But when it all shakes out, I remain convinced that over the long-term, when viewed thru a macro-economic lens, we’re on the cusp of a staggering growth in both corporate earnings and per capita GDP.
Of course, getting “there” — wherever there is — will be turbulent. In many, many, many ways. I believe the next decade will prove to be one of the most economically transformative periods in all of human history. Of course, this transformation won’t happen on a straight line, and it won’t benefit everyone equally. But viewed thru a macro-economic lens, I remain convinced we’re witnessing the early stages of an unprecedented expansion in US productivity, corporate earnings, and GDP per capita. Hold on tight; it’s likely to be a bumpy trip.
<Terry Liebman>