SHI 10.14.26 – So What’s Normal?

SHI 9.23.26 – Quarter Point Hike
September 23, 2026
The 10-year Treasury yield is up significantly.
It’s gone up so fast, it’s frightening. As I write this blog, it is hovering around 5.30%. Sovereign bonds of other developed nations are also quite a bit higher than in the recent past. These days, the “talking heads” on CNBC utter the phrases “we are in a rising rate environment” or “rates are at a multi-decade high” many times each day in the past couple of weeks. Of course, you knew that. Interest rates are up. A lot.
“
Long-term rates are UP. “
“
Long-term rates are UP. “
So are we in a rising-rate environment? Will this continue for the foreseeable future … or even <GASP> forever? Is the 7.00% ‘prime rate’ and the ‘average’ 30-year fixed rate mortgage (per FHLMC) of 7.40% the “new normal?” Great questions all.
Welcome to this week’s Steak House Index update.
If you are new to my blog, or you need a refresher on the SHI10, or its objective and methodology, I suggest you open and read the original BLOG: https://www.steakhouseindex.com/move-over-big-mac-index-here-comes-the-steak-house-index/
Why You Should Care: The US economy and US dollar are the bedrock of the world’s economy. But is the US economy expanding or contracting?
Expanding … according the ‘advanced’ reading just released by the BEA, Q2, 2026 GDP grew — in ‘current-dollar‘ terms — at the annual rate of 8.0%.
The ‘real’ growth rate — the number most often touted in the mainstream media — was 1.50%. In current dollar terms, during Q2 the annual economic output reached almost $32.50 trillion.
According to the IMF, the world’s annual GDP will expand to over $126 trillion in 2026. Of that amount, the US makes up over 25% — expected to reach $32.4 trillion by the end of 2026. Further, IMF expects global GDP to reach almost $135 trillion by 2028 — an increase of more than 28% in just 5 years.
America’s GDP remains around 25% of all global GDP. Just four countries—the United States, China, Germany, and Japan—generate roughly half of all economic activity worldwide. Collectively, the US, the European Common Market, and China generate about 65% of the global economic output. These are the 3 big, global players. They bear close scrutiny.
The objective of this blog is singular.
It attempts to predict the direction of our GDP ahead of official economic releases. Historically, ‘personal consumption expenditures,’ or PCE, has been the largest component of US GDP growth — typically about 2/3 of all GDP growth. In fact, the majority of all GDP increases (or declines) usually results from (increases or decreases in) consumer spending. Consumer spending is clearly a critical financial metric. In all likelihood, the most important financial metric. The Steak House Index focuses right here … on the “consumer spending” metric. I intend the SHI10 is to be predictive, anticipating where the economy is going – not where it’s been.
Taking action: Keep up with this weekly BLOG update. Not only will we cover the SHI and SHI10, but we’ll explore “fun” items of economic importance. Hopefully you find the discussion fun, too.
If the SHI10 index moves appreciably -– either showing massive improvement or significant declines –- indicating growing economic strength or a potential recession, we’ll discuss possible actions at that time.
The Blog:
Unfortunately, yet again, the questions are far better than my answers.
Consider this: On February 27th of this year, the 10-year Treasury yield reached a low-point of 3.97%. That’s right. Only 6 or so months ago, the yield was sub-4%. Fast forward to October 5th — less than 2 weeks ago — when the yield hit a (near term) peak of 5.31%. I know the math is simple, but that’s a more than 1.3% increase in the 10-year Treasury yield in a super short time. Here’s another interesting question and perspective: How much has the 10-year yield increased as a percentage of low yield mark? The answer: Almost 33%. The 10-year yield has increased almost 33% over the 2026 low of 3.97%. Wow.
Like most economic issues, this one has many contributing factors and causes. It’s not as simple as blaming “inflation!” or a super-strong economy. Those two factors contribute of course, but as I’ve mentioned in prior blogs, other things like the AI Cap-Ex buildout, the seemingly never-ending US deficit spending, and increasing “term premium” from bond investors, the growing global capital demand, and both FED and consumer expectations also contribute to the upward move.
But let’s get back to the question: What is normal?
At this point in the current economic cycle, what should we expect the 10-year Treasury yield to be? After all, the 10-year Treasury has “been around” since 1962. That’s a long time. More than 60-years. So it should be pretty easy to answer that question, right? What is a “normal” yield?
Unfortunately, we can’t answer the question because we never have a “normal” economy. We’re always bouncing around between expansion and recession and depending on which is imminent, the level of interest rates responds to the proverbial conditions on the ground. I mean consider the crazy one-of-a-kind economic events the US has experienced since 1962. We had the massive military expansion during the Vietnam war which led to run-away inflation in the 1960s and into 1970s. Nixon removed the US from the “gold standard” in 1971 which further fueled the inflationary cycle. Then we had the massive Volcker FED rate hikes during the 1980s with the accompanying recessions. The stock market absolutely crashed in 1987, dropping 22.6% in a single day. Then we had the 1990s dot-com boom and bust cycle — not to be outdone by the mortgage-fraud led economic boom and bust that led to the Great Financial Crisis of 2008.
Surviving that, the developed economies across the globe fell into a “balance sheet recession.” This term, coined by the Japanese economist Richard Koo, encapsulates the business and consumer response to the popping of an asset bubble. Following such a popped bubble, both tend to focus on paying down debt rather than borrowing money or investing capital. A balance sheet recession explains the 2-decade deflationary spiral in Japan; the post-GFC economic doldroms, slow GDP growth, super low inflation, and near-zero interest rates; and, in my opinion, is precisely what is unfolding right now in China. China may be exporting itself out of a recession, but their consumer sector is fully immersed in a deflationary spiral and balance sheet recession. Koo has written a few great books on the topic. Google them if you want to learn more. I recommend it.
Let’s get back to the question about the “normal” 10-year yield. Over the entire history of the FED’s 10-year Treasury yield series, beginning in January 1962, the average yield has been approximately 5.8%. How do I know that? I asked my good friend ‘G’ — ChatGPT! If you were wondering what AI is good at doing, besides possibly killing us all before 2030, my answer would be it is tremendously helpful with technical research.
In this case, I asked G this question: “Over the entire history of the 10-year series, what has the yield averaged?” In seconds I had my answer. But is that answer correct, you ask? Great question. That’s why I also asked my good buddy ‘Gemini 3.6 Flash’ and Anthropic’s Claude ‘Opus 5.5 Medium’ the same question. In all 3 cases, the answer was almost identical. 5.8%. So I feel confident the answer is correct in the macro.
But the question itself is poor. Yes, I know I crafted it and asked it, but the problem is the wild economic swings, from boom to bust and back again, make the “average” and “normal“ anything but. Consider this chart, again courtesy of my buddy G:

Clearly, the 10-year Treasury rate was heavily influenced by the inflationary period of the 1960s, 1970s and 1980s. By the 1980s, 10-year yield was above 8% for much of the decade. Fast forward to the “balance sheet recession” period era and that same yield was frequently below 3% — and post-Covid, the yield reached almost zero. My long term readers may remember my amazement that the US Treasury didn’t sell a TON of 10- and 30-year debt when rates were close to zero. Dumb, dumb, dumb.
Anyway, not deterred by the challenge of the issue, I asked ‘G’ this question:
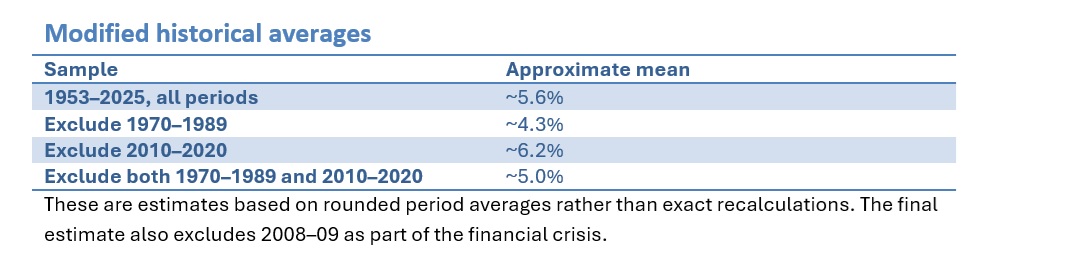
“Of course, it’s hard to separate FED-induced rate influences such as the Volcker episode; however, if we remove the period of exceptional, run-away inflation during the 1960s-1970s, and remove the yield history from what I consider to be a mini “balance sheet recession” following the 2008 Great Recession (perhaps 2010 thru 2020?), what can we glean about the modified average 10-year yield?”
Now we’re getting somewhere. And G responded with this high level observation:
“This asks what the 10-year Treasury yield would have averaged in a more normal monetary environment, excluding both the extraordinary inflation of the 1970s–80s and the extraordinary monetary accommodation following the 2008 financial crisis. There is symmetry: the Volcker era pushed nominal yields to exceptional highs, while the post-2008 period combined weak private-sector credit demand, low inflation, quantitative easing, and unusually low policy rates. Removing both episodes does not necessarily yield a neutral estimate, because the remaining decades had their own inflation trends, Fed policies and structural forces.”
And ChatGPT concluded that if we exclude both the extraordinary inflationary episode battled by Volker and the balance sheet recessionary period post-GFC, the “average” would settle in around the 5.00% mark. Here’s a chart showing the approximate mean calculations:
Interesting right? But I didn’t want to stop there. I wanted to make sure this AI analysis holds up under further scrutiny.
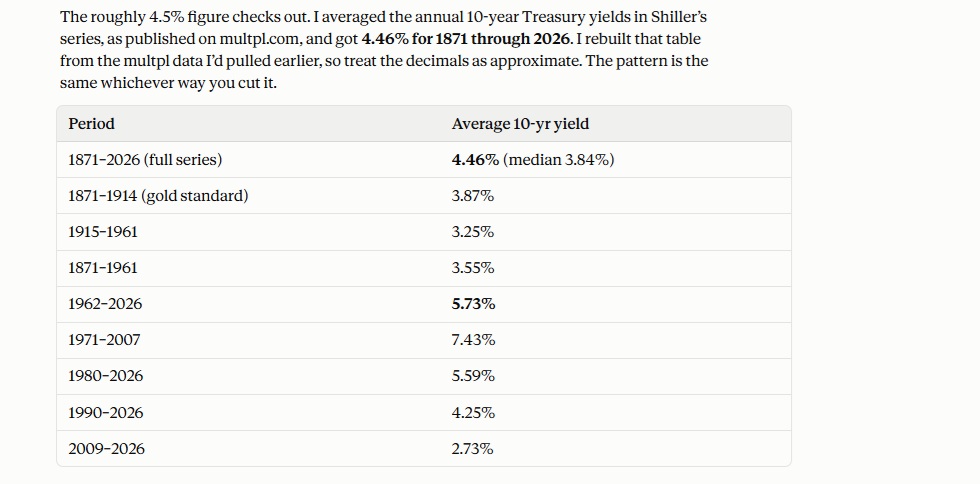
I’m sure you know Robert Shiller, the Yale economics professor? He’s famous for a number of reasons — but mostly for his body of work in the historic interest rate analysis and the creation of the Case-Schiller Index. Dr. Shiller has done some extensive work on very long term historical interest rates. In fact, before we had AI LLMs for research, Dr. Shiller calculated average 10-year interest rates going back to 1871 — even before we had a 10-year Treasury! Shiller concluded the historic 10-year interest rate — including ALL the booms, busts, highs and lows was a lower average of approximately 4.5%.
Courtesy of Claude, here’s a great comment and historic chart:
Shiller’s work is downright amazing. Even more amazing is the fact that he has spent decades on this topic.
My final conclusion? At around 5.3%, the current 10-year Treasury yield is neither high nor low — and in fact, is probably right in line with historical long term averages. So while the 10-year Treasury rate is currently at a “multi-decade high” that fact isn’t as scary as it might sound. Yes, rates are up. Yes, they are at near-term highs. But all things considered, this level of 10-year rates is actually relatively “normal.” 🙂
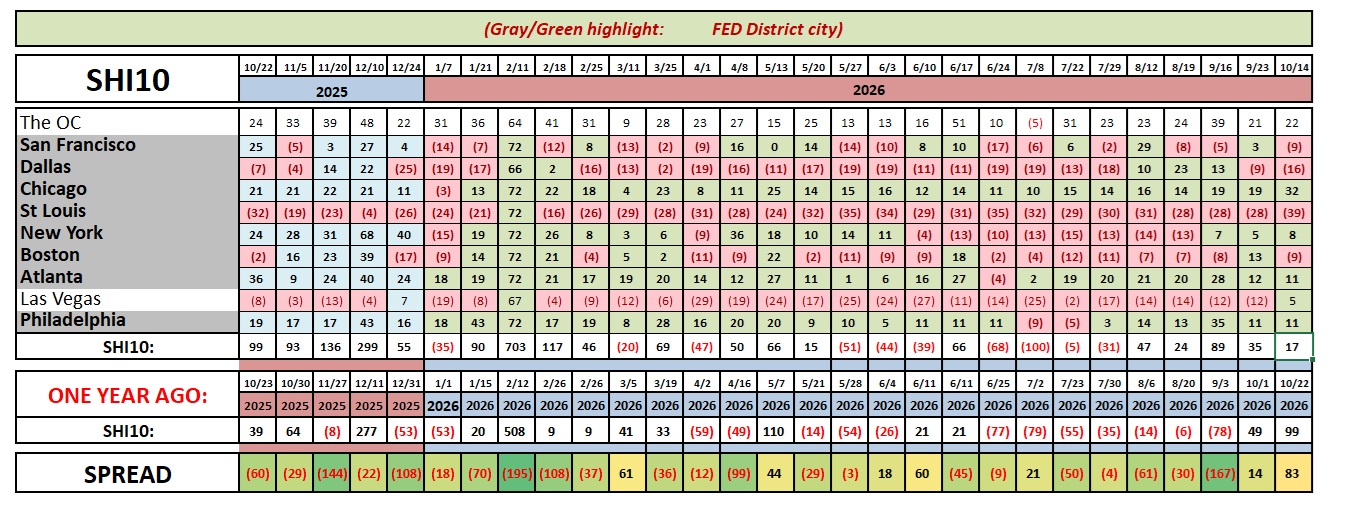
Let’s check in with the steakhouses.
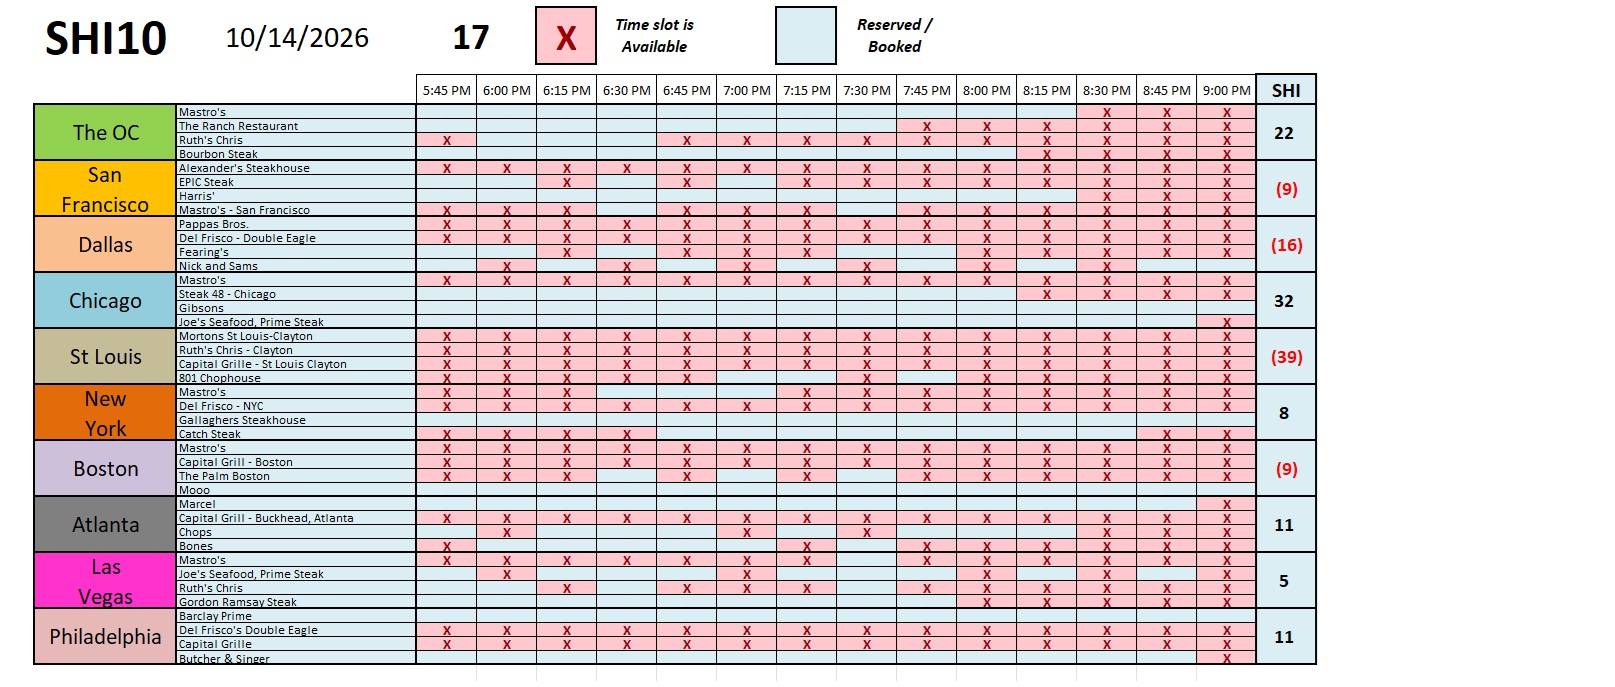
Once again, there are no fireworks or smoking gun here. The only heat is on the 600-degree grills at our expensive eateries. Reservation demand remains consistent and robust and so thru the lens of this metric, the US economy continues to be powerful and steady.