
SHI 9.8.21 – The Next Big Scare

SHI 8.31.21 – Looking for Inflation
September 1, 2021
SHI 9.15.21 – Beware the Big Dog
September 15, 2021
Lurking around the corner, we’re told, is a growing problem. No, I’m not referring to the next Covid variant. This is an economic blog. 🙂
“
Will rising house rents ignite inflation?“
“Will rising house rents ignite inflation?“
Perhaps you’ve seen the articles in the NY Times, the Wall Street Journal, or on CNBC. Home rents are skyrocketing — and as ‘shelter’ represents almost 33% of the CPI — the naysayers tell us that while ‘rent’ was ‘hot’ in July, the longer-term impact is both larger and longer. Should you be worried?
Will rent spikes make the ‘transient’ inflation promised by the FED a thing of the past? Is this where we’ll find the inflation monster?
Welcome to this week’s Steak House Index update.
If you are new to my blog, or you need a refresher on the SHI10, or its objective and methodology, I suggest you open and read the original BLOG: https://www.steakhouseindex.com/move-over-big-mac-index-here-comes-the-steak-house-index/
Why You Should Care: The US economy and US dollar are the bedrock of the world’s economy.
But is the US economy expanding or contracting?
The short answer? Expanding. By a staggering measure. In fact, during Q1 and Q2, annualized 2021 ‘real’ growth averaged about 6.4%. In nominal terms, our US economy averaged almost 12% growth — adding $1.245 trillion of economic activity during the first half of the year. Forever more, COVID-19 will be mentioned concurrently with any discussion about 2020 GDP. Collectively, the world’s annual GDP was about $85 trillion by the end of 2020. But I am confident all 2021 GDP discussions will start with a nod to the blowout 1st quarter GDP growth number, because our ‘current dollar’ GDP grew at the annual rate of 10.7%! Annualized, America’s GDP blew past $22 trillion during the quarter, settling in at $22.72 trillion. The US, the euro zone, and China continue to generate about 70% of the global economic output.
The objective of this blog is singular.
It attempts to predict the direction of our GDP ahead of official economic releases. Historically, ‘personal consumption expenditures,’ or PCE, has been the largest component of US GDP growth — typically about 2/3 of all GDP growth. In fact, the majority of all GDP increases (or declines) usually results from (increases or decreases in) consumer spending. Consumer spending is clearly a critical financial metric. In all likelihood, the most important financial metric. The Steak House Index focuses right here … on the “consumer spending” metric. I intend the SHI10 is to be predictive, anticipating where the economy is going – not where it’s been.
Taking action: Keep up with this weekly BLOG update. Not only will we cover the SHI and SHI10, but we’ll explore related items of economic importance.
If the SHI10 index moves appreciably -– either showing massive improvement or significant declines –- indicating growing economic strength or a potential recession, we’ll discuss possible actions at that time.
The Blog:
Maybe. But I don’t think so. Let me explain.
First, let’s acknowledge that like home prices, rental rates are definitely jumping, post-pandemic:
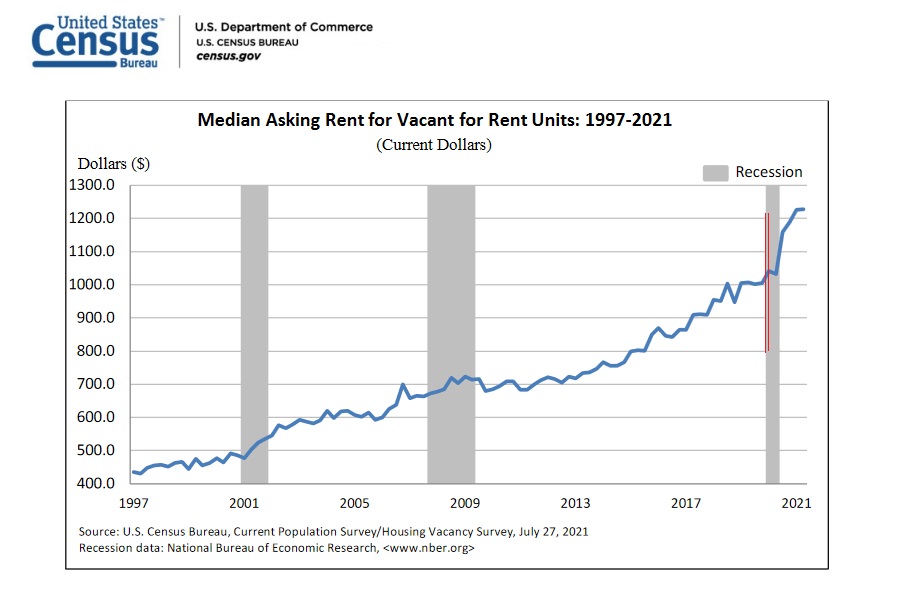
The Census Bureau is a great data source. I added the red lines above to mark the beginning of both Covid and the most recent recession. Rents are up. A lot. Consider this comment from the “Apartment List National Rent Report” posted a few days ago:
“With rents rising virtually everywhere, only a few cities remain cheaper than they were pre-pandemic. And even there, rents are rebounding quickly. In San Francisco, for example, rents are still 12 percent lower than they were in March 2020, but the city has seen prices increase by 20 percent since January of this year. At the other end of the spectrum, many of the mid-sized markets that have seen rents grow rapidly through the pandemic are only continuing to boom — rents in Boise, ID are now up 39 percent since March 2020. Rent growth in 2021 so far is outpacing pre-pandemic averages in 98 of the nation’s 100 largest cities.”
Ouch. And as about 1/3 of the CPI is determined by rent increases, it logically follows that the CPI is headed up. In a big way.
Or does it? Let’s dig in a bit deeper.
I’ve discussed home prices extensively in this blog. Numerous times, for years now, I’ve bemoaned the fact that the supply/demand balance is seriously out of whack. Since the end of the Great Recession of ’08, an insufficient number of new homes have been built, year after year, to meet current and growing demand. Add in persistently low interest rates and viola!, we see a massive spike in home prices across the country:
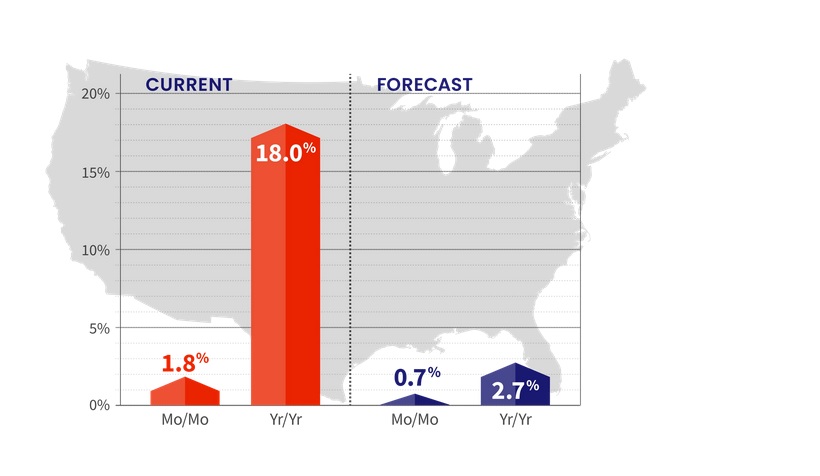
This graphic, courtesy of CoreLogic, came with the following comment:
“Home prices nationwide, including distressed sales, increased year over year by 18% in July 2021 compared with July 2020 and increased month over month by 1.8% in July 2021 compared with June 2021.”
That is a monstrous 1-year increase in value.
Per the Federal Reserve “Z.1 Financial Accounts of the United States” report, the aggregate net worth of all Americans as of April, 2021, was $137 trillion; “households” owned real estate worth $33.8 trillion at the end of Q1, 2021. Using this number to calculate the amount of an 18% increase, we find that in the aggregate …
the value of US homes increased by more than $6 trillion in the past 12 months.
Absolutely staggering. A one-year increase of $6 trillion. That is absolutely unprecedented.
At present, approximately 65% of American households own their own home; suggesting, alternatively, about 35% of households are renters. However, this fact is not overly relevant to the CPI “shelter” cost calculation. You’ll remember that home appreciation, and home values are CPI neutral. Home ownership is not “consumptive.” It is an investment. Rent, on the other hand, is consumption, and thus rent is the “Shelter” component that impacts the calculation of the CPI and the PCE.
The “Shelter” component in the CPI is a summary of two (2) calculations: First, a thing called “Rent of Primary Residence.” And second, “Owners’ equivalent rent of residences.” Said another way, the CPI estimates “rent” for both the 65% group — homeowners — and the 35% group, which are our renters. And the methodology is interesting.
Consider this excerpt from a document entitled “How the CPI Measures Price Change:”
The expenditure weight in the CPI market basket for Owners’ equivalent rent of primary residence (OER) is based on the following question that the Consumer Expenditure Survey asks of consumers who own their primary residence: “If someone were to rent your home today, how much do you think it would rent for monthly, unfurnished and without utilities?”
Interesting right? Tens of thousands of homeowners participate in this monthly survey. I’m not one of them. I suspect neither are you. But if I was called by the Census Bureau and asked “how much do you think your house would rent for?” I suspect I’d have no idea. Would I overestimate? Underestimate? Who knows. Of course, the 35% who rent would know. They know precisely how much they currently pay, and the amount of their last rental increase. And of late, increases have been quite large.
Thus, I would agree that in the near term, the “Shelter” component of CPI will increase at a fairly fast clip. The past 12-month change was 2.8% — I expect that to increase meaningfully every month for the next 6 to 12 months.
But then I expect the increases to slow. Why? Supply and demand.
Just as you cannot sell a Big Mac to someone who has already finished lunch, you cannot “sell” an apartment to someone who occupies their home or already rents an apartment. They don’t need another one. Thus, new home and apartment rental demand, over the longer term, is reliant on household formation. Households occupy housing; individuals do not. So, while rents will probably jump in the short term, over the longer term demand must increase for the price increases to continue. Demand, in this case, would be the result of accelerating household formation. But that’s not what’s happening.
Here are the latest household formation numbers, courtesy of the St Louis FED:
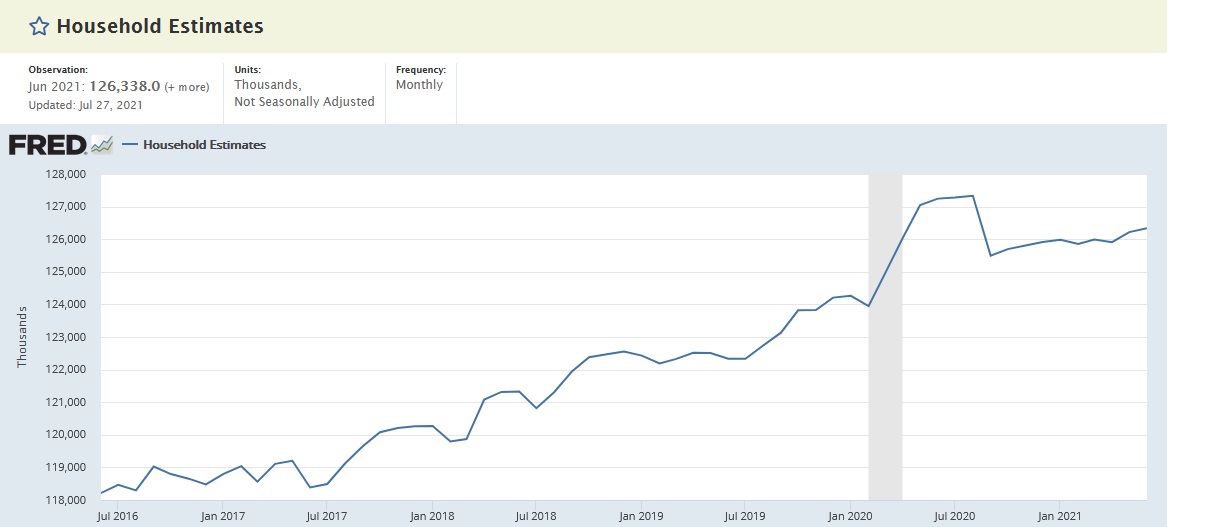
As of about a month ago, US households measured a little over 126 million. But about 1 year ago, US households numbered about 1 million HIGHER — 127.3 million to be precise. The number of US households has shrunk over the past year. Hmmm ….
So what does this mean? Simply this: We will likely see a sizable increase in the “Shelter” component of the CPI in the next 6-12 months, pushing the entire CPI up meaningfully. However, only with increasing demand from newly formed households will rent inflation continue unabated. A declining, or flat, number of households puts a lid on rental rates. And that’s what seems to be happening at present. Household growth is, at best, flat. Thus, over the longer-term, I expect the “Shelter” component of the CPI to revert to more historic norms. I expect this CPI component to be “transient,” its effects disappearing in no more than a year.
My 2 cents. Could I be wrong? Sure … but the data supports a near term CPI bump and then, over time, a longer term flattening in the “Shelter” component of the CPI.
Let’s head to the steak houses and check on the consumer’s appetite and economic health. Here’s this week’s SHI10 grid:
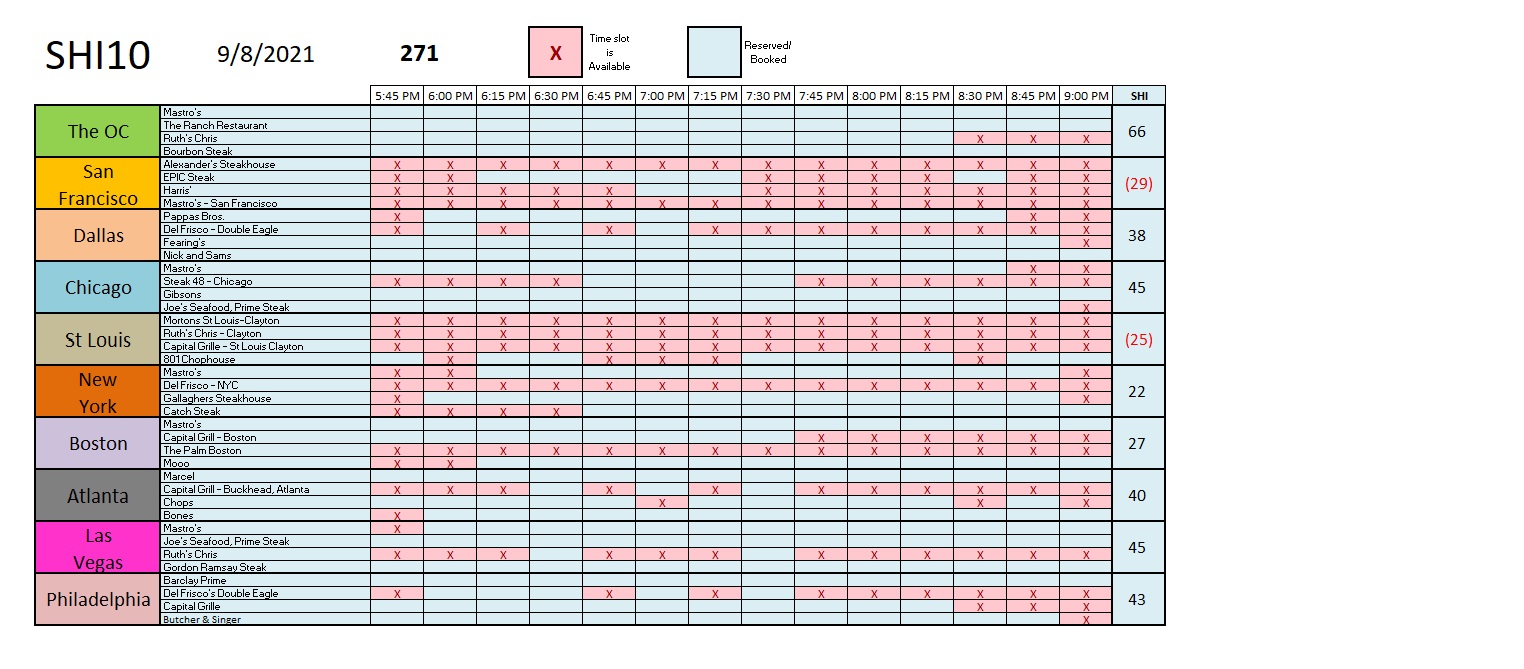
Reservation demand for Saturday is hot, hot, hot! here in the OC … but demand and the grills are quite a bit cooler up north in San Francisco. Perhaps Delta-fears are keeping San Francisco’s well-heeled patrons home this weekend, but regardless of the reason, there are plenty of open reservation slots on Saturday. This week SF has an SHI score of negative <29>, a far cry from their positive score of 12 last week. St Louis has the same challenge this week: Their SHI score has slipped from a positive 13 to a negative <25> — once again, a very large, very negative move in the index. ‘Vegas expensive steak eatery demand, on the other hand is almost unchanged week-over-week. Same in the OC, Dallas, Chicago, and NYC. Philly and Atlanta slipped just slightly. Here’s the longer-term trend grid:
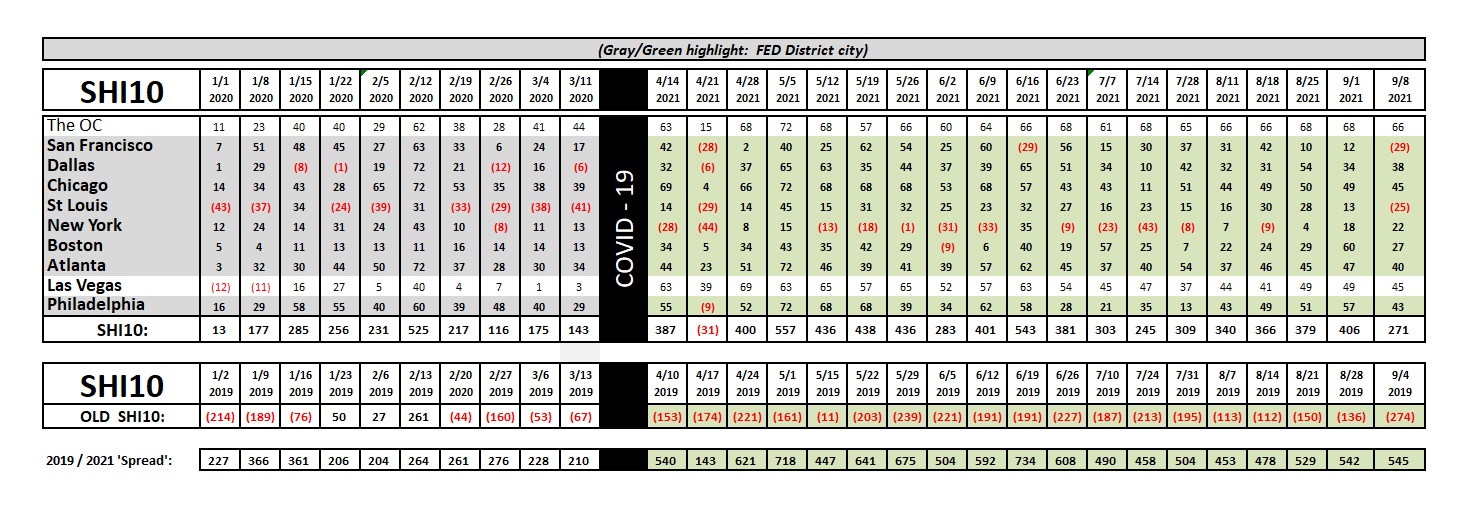
So, with an SHI10 reading of 271, as compared to 406 last week, we have to wonder if the apparent drop-off in reservation demand is indicative of a weakening US economy. Alternatively, the “spread” is almost unchanged week-over-week, suggesting that this same week back in 2019 also saw a significant reduction in reservation demand. So its too soon to assess significance.
Delta is clearly impacting consumer confidence, airline flight demand, movie theater attendance, and a whole host of other consumption areas. But how much and for how long are still unknown.
I feel I can say without equivocation that Delta has put a momentary dent in the economy. Time will tell if the consumer decides to brush it off in the next week or two, or heads to the body shop. I believe they will brush it off.
<:> Terry Liebman


