
SHI 08.29.18 The Amazon Effect and Robot Density

SHI 08.22.18 Open a Restaurant
August 22, 2018
SHI 09.05.18 Investors Agree with Trump
September 5, 2018
“Amazon is about to hit a new milestone and robots are invading Asia.”
Amazon is about to reach a 50% market share of all ‘eCommerce retail sales.’ This is a staggering achievement. One company, controlling 50% of on-line retail sales in the US. Amazing. Amazon.
And ‘robot density’ is rising quickly in Asia. What is robot density, you ask? Its a measurement of the number of industrial robots per 10,000 workers. In 2016, the world average robot density (RD) was 74, according to the International Federation of Robotics. At that time, South Korea had an RD of 631. Singapore, 488. And according the the International Monetary Fund (IMF), the proliferation is accelerating, as you’ll see in the BLOG below.
What does Amazon’s hegemony and robotics have in common? Again, read on …. 🙂
Is Amazon a monopoly? Should it be ‘broken up’ under US antitrust law? What’s the beef here? I guess it depends on your perspective. We have lots to cover before we visit the Steak Houses!
Welcome to this week’s Steak House Index update.
If you are new to my blog, or you need a refresher on the SHI10, or its objective and methodology, I suggest you open and read the original BLOG: https://www.steakhouseindex.com/move-over-big-mac-index-here-comes-the-steak-house-index/
Why You Should Care: The US economy and US dollar are the bedrock of the world’s economy. This has been the case for decades … and will continue to be true for years to come.
Is the US economy expanding or contracting?
According to the IMF (the ‘International Monetary Fund’), the world’s annual GDP is about $80 trillion today. US ‘current dollar’ GDP now exceeds $20.4 trillion. In Q2 of 2018, We remain about 25% of global GDP. Other than China — a distant second at around $11 trillion — the GDP of no other country is close.
The objective of the SHI10 and this blog is simple: To predict US GDP movement ahead of official economic releases — an important objective since BEA (the ‘Bureau of Economic Analysis’) gross domestic product data is outdated the day it’s released. Historically, ‘personal consumption expenditures,’ or PCE, has been the largest component of US GDP growth — typically about 2/3 of all GDP growth. In fact, the majority of all GDP increases (or declines) usually results from (increases or decreases in) consumer spending. Consumer spending is clearly a critical financial metric. In all likelihood, the most important financial metric. The Steak House Index focuses right here … on the “consumer spending” metric. I intend the SHI10 is to be predictive, anticipating where the economy is going – not where it’s been.
Taking action: Keep up with this weekly BLOG update. Not only will we cover the SHI and SHI10, but we’ll explore related items of economic importance.
If the SHI10 index moves appreciably -– either showing massive improvement or significant declines –- indicating growing economic strength or a potential recession, we’ll discuss possible actions at that time.
The BLOG:
As my long-time readers know, at its essence, this BLOG is tasked with (hopefully) accurately forecasting US GDP growth using demand metrics for pricey steakhouse reservations. Steakhouse reservation levels, I feel, is a far more appetizing approach to economic analysis and forecasting than the dense, chewy, tasteless stuff most economists serve up.
A delicious concept, right?
When last measured, the Gross Domestic Product reached $20.402 trillion. Of this total, $13.877 trillion — or just over 68% — were ‘personal consumption expenditures.’ Consumer spending. As you know, this is the metric we attempt to forecast here at The Steak House Index, under the theory that since PCE accounts for more than 2/3s of the total US economy, it bears close scrutiny.
Kinda like Amazon. Chew on this:

Almost 50% of all retail ecommerce sales now come from Amazon. The next 5 players in this space are:
- ebay – 6.6%
- Apple – 3.9%
- Walmart – 3.7%
- Home Depot – 1.6%
- Best Buy – 1.3%
Clearly, Amazon is THE dominant player in this space. Is this a good thing or a bad thing? Well, as I suggested above, it depends on your perspective.
Certainly Amazon believes this is a good thing. Just as Walmart probably feels the opposite. And as Amazon sets their sights on new market segments for expansion, they send shivers down the spines of competitor CEOs. For good reason. Amazon has invested billions in robotics and automation. This strategy has driven their operating costs down so low, improved their operating efficiency so much, that many competitors are having difficulty competing and gaining market share.
The charts below tell the robotics story:
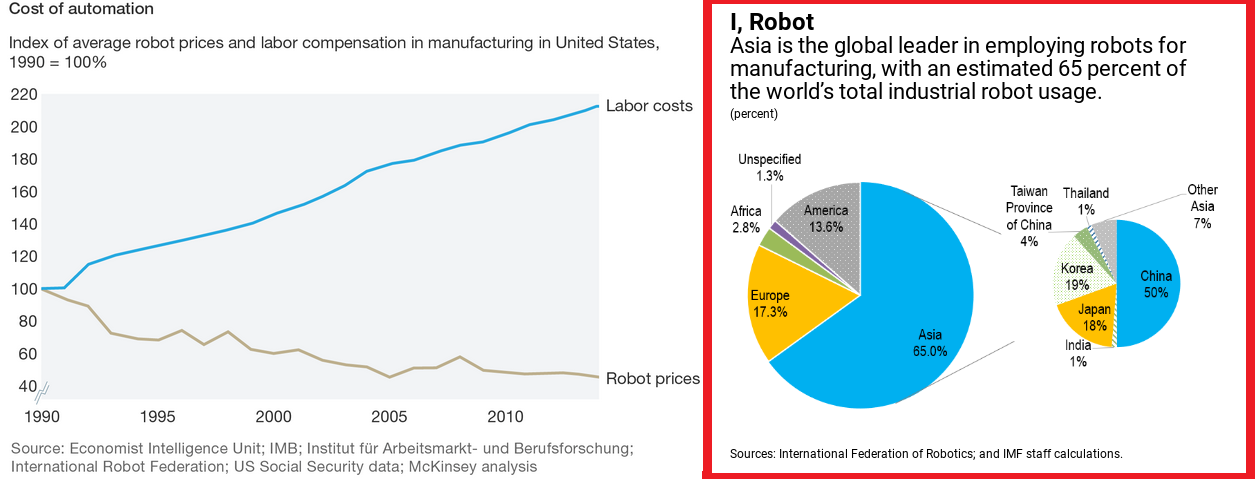
Robot prices continue to fall. While wage costs continue to rise. Whether we like this trend or not, the trend is real … and it’s accelerating … not slowing down. Especially in Asia. Asia now “employs” almost 2/3 of all robots on the planet. To quote a recent IMF blog on the topic:
“This trend could mean trouble for workers in Asia where relatively low-cost and low-skilled labor has been the basis for the region’s role as “the factory to the world.” More robots than humans doing technical work may bring down the cost of business, including labor costs, significantly. As a result, workers are displaced as producers are more likely to employ robots that cost less and perform more effectively, rather than having to pay wages.”
Hmmm …. the implications in a country with 1.4 billion people are far more dire than they are here in the US. This is one problem that should be keeping politicians in both the US and China up at night.
On a side note, The FED really should pay more attention to this trend. It helps explain why in spite of record low unemployment levels, we’ve seen no acceleration in wage growth. I read article after article where the authors wring their hands over the failure of the Phillips Curve to accurately predict wage inflation. I have one word for you guys: Robotics.
But how dominant is Amazon, really? Do they really own this market? Take another look at the graphic. Total US ecommerce retail sales has grown to $252 billion annually. What percentage of total consumer spending is this? Only 1.82%. That’s right. A paltry 1.82% of the total. As you look at the list of ‘personal consumption expenditures’ tracked by the BEA, and included in the GDP measure, we see this group is split into “goods” and “services.”
‘Goods’ includes all the stuff we buy. Like steaks, lobster mashed potatoes and 1990 Chateau Margaux. Well, maybe not the Margaux — it’s an import. ‘Services’ are more intangible and includes items like utilities, health care, and insurance. Amazon plays in both sandboxes.
But, yet, at 50% of the total retail ecommerce market, they control only 0.91% of total PCE. Less than one percent. So, I’ll ask again: Is Amazon a monopoly?
Let’s google the word. (Hmmm…is google a monopoly?) Here’s the definition:
“the exclusive possession or control of the supply or trade in a commodity or service”
Does this description fit Amazon? Naaaaaa. I have no beef with Amazon.
“Amazon is not a monopoly.”
Speaking of the GDP, here’s an interesting graphic from our friends at the Bureau of Economic Analysis (BEA):
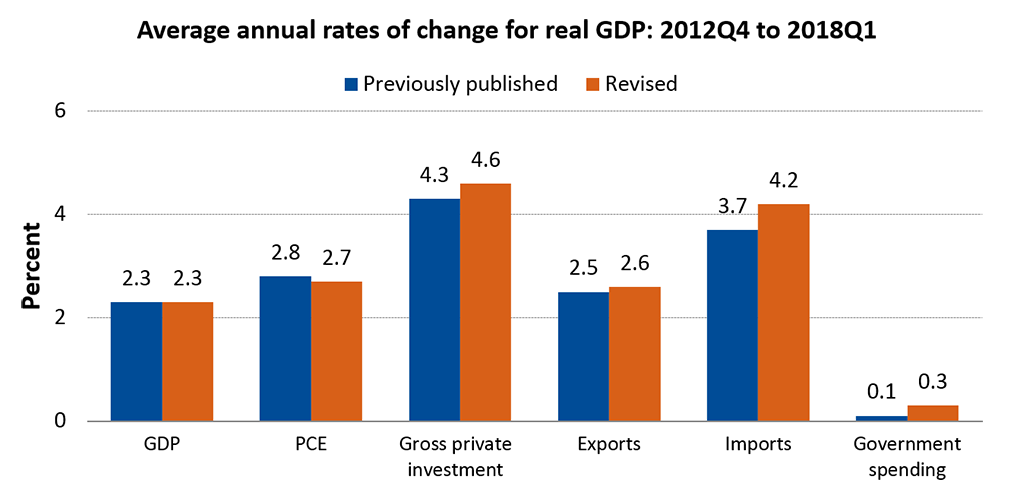
The real “annual rate of change” for our GDP has been revised up to 2.3% per year for the prior 5+ years. It’s worth noting that while the 2.4% annual ‘real’ growth rate is impressive, even more impressive is the nominal growth during this same period. GDP finished 2012 at $16.197 trillion. Thus, the $4.2 trillion nominal GDP increase during this time was almost 26%. That’s a lot more than 2.3% per year.
Your take-away here is this: Remember that GDP figures are almost always quoted as ‘real’ … meaning deflated by an inflation factor. While it’s important to maintain this consistent lens, don’t lose sight of the fact that our GDP has actually grown at a far faster rate than the ‘official’ numbers suggest.
What I find even more impressive is the size of ‘Gross private investment.’ Remember: Over the longer term, investment by companies and individuals into plants, equipment, new commercial real estate, new homes, etc., tends to push up GDP growth. Current consumption helps GDP in the present. Investment helps our GDP grow in the quarters and years to come.
All right … it’s time to head over to our Steak Houses. This week looks like a repeat of last week. Reservation demand in New York improved a bit, but dipped in Philly (presumably street vendors selling steak sandwiches are stealing NY Steak demand in opulent eateries) and St Louis. Here’s the long-term trend chart:
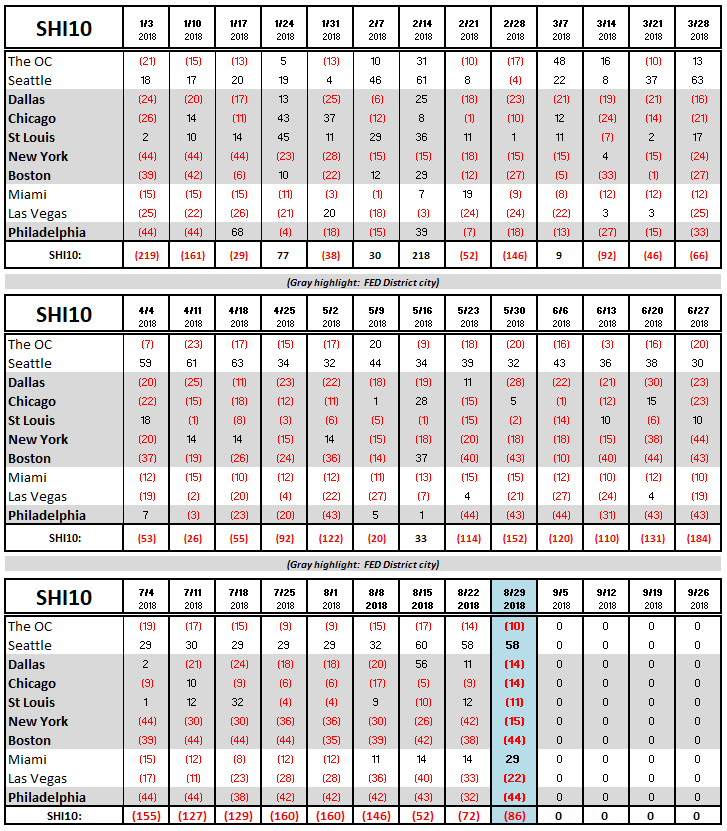
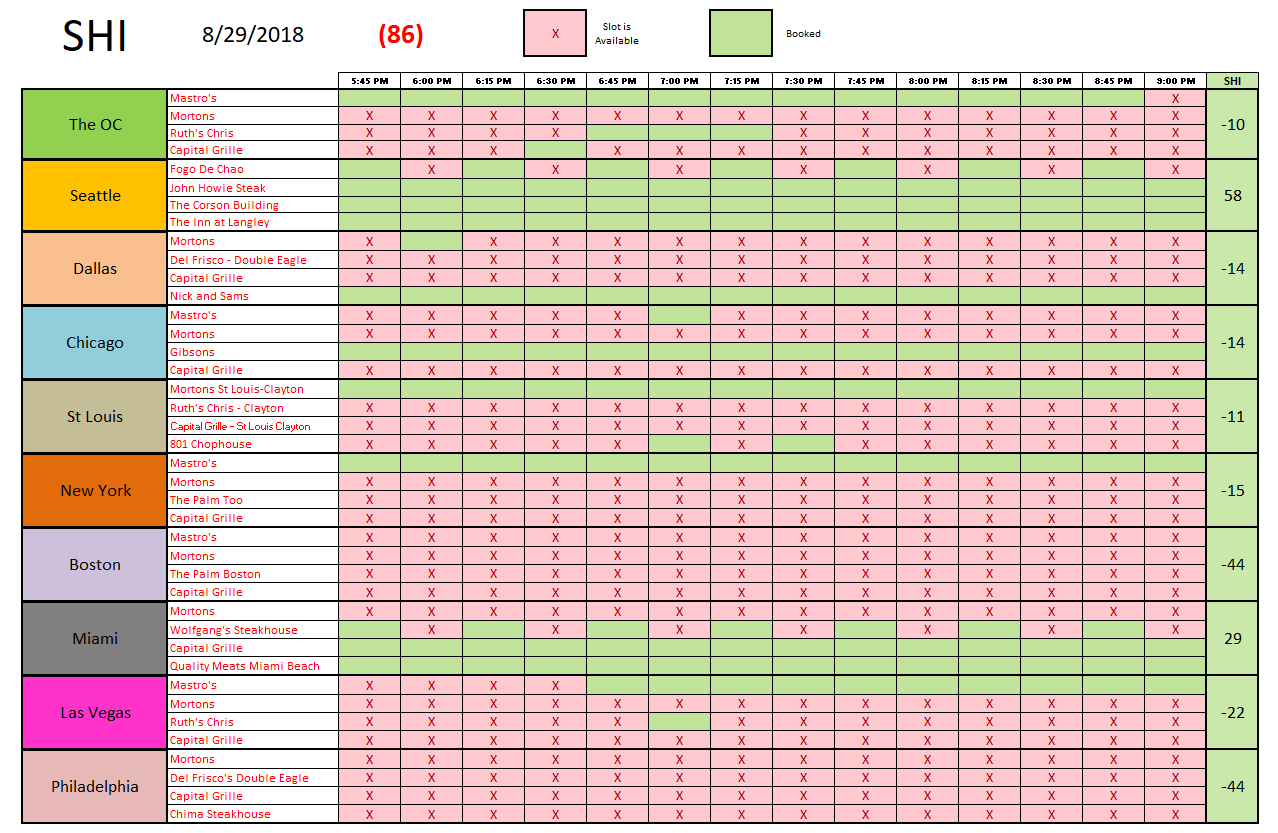
After a super strong showing two weeks ago, pricey steakhouse demand seems to be slipping a bit in Dallas. Miami, on the other hand, has a 4-week trend with positive SHI reading. Their SHI of 29 is their highest reading ever. Here is this week’s SHI10 grid:
Once again, the Atlanta FED ‘GDPNow’ forecast and the NY FED ‘nowcast’ have diverged meaningfully. They now suggest third quarter GDP growth will be 4.6% and 1.96%, respectively. That’s quite a gap…but remember these numbers are quite fluid.
The SHI10, in my opinion, is telling a story much more aligned with the ‘nowcast’ than the Atlanta prediction. But it’s much too early to make that prediction. The only prediction I can make today is this:
“The US economy is on solid footing and will continue to expand in the near term.”
Take that to the bank! Thanks for tuning in.
- Terry Liebman


