
SHI 08.22.18 Open a Restaurant

SHI 08.15.18 This Turkey is No Filet Mignon
August 15, 2018
SHI 08.29.18 The Amazon Effect and Robot Density
August 29, 2018
“The US Census Bureau has a suggestion for you: Open a restaurant.”
I’m not kidding. Take a look … open this link (right click, select “open link in new window”): https://www.census.gov/smallbusiness/html/restaurant-case.html
If this sounds interesting to you, and you do actually open a restaurant, your timing might be very good: According the Bloomberg and the US Department of Commerce, “Americans are Spending Like Crazy at Restaurants.” https://www.bloomberg.com/news/articles/2018-08-15/americans-are-spending-like-crazy-at-restaurants-maybe-too-much
The Commerce department report shows the July 2018 sales at ‘Food services & drinking places’ was up 9.7% over one year ago, while ‘Retail & food services, total’ was up 6.4% year over year. Here’s the actual report, if you’re interested: https://www.census.gov/retail/marts/www/marts_current.pdf
The bottom line?
- The US expansion continues unabated.
- Restaurant spending is clearly an economic barometer.
- The Steak House Index is clearly an appetizing methodology for predicting future economic results.
Welcome to this week’s Steak House Index update.
If you are new to my blog, or you need a refresher on the SHI10, or its objective and methodology, I suggest you open and read the original BLOG: https://www.steakhouseindex.com/move-over-big-mac-index-here-comes-the-steak-house-index/
Why You Should Care: The US economy and US dollar are the bedrock of the world’s economy. This has been the case for decades … and will continue to be true for years to come.
Is the US economy expanding or contracting?
According to the IMF (the ‘International Monetary Fund’), the world’s annual GDP is about $80 trillion today. US ‘current dollar’ GDP now exceeds $20.4 trillion. In Q2 of 2018, We remain about 25% of global GDP. Other than China — a distant second at around $11 trillion — the GDP of no other country is close.
The objective of the SHI10 and this blog is simple: To predict US GDP movement ahead of official economic releases — an important objective since BEA (the ‘Bureau of Economic Analysis’) gross domestic product data is outdated the day it’s released. Historically, ‘personal consumption expenditures,’ or PCE, has been the largest component of US GDP growth — typically about 2/3 of all GDP growth. In fact, the majority of all GDP increases (or declines) usually results from (increases or decreases in) consumer spending. Consumer spending is clearly a critical financial metric. In all likelihood, the most important financial metric. The Steak House Index focuses right here … on the “consumer spending” metric. I intend the SHI10 is to be predictive, anticipating where the economy is going – not where it’s been.
Taking action: Keep up with this weekly BLOG update. Not only will we cover the SHI and SHI10, but we’ll explore related items of economic importance.
If the SHI10 index moves appreciably -– either showing massive improvement or significant declines –- indicating growing economic strength or a potential recession, we’ll discuss possible actions at that time.
The BLOG:
This morning, I find two things very interesting. The first is reflected in this chart:
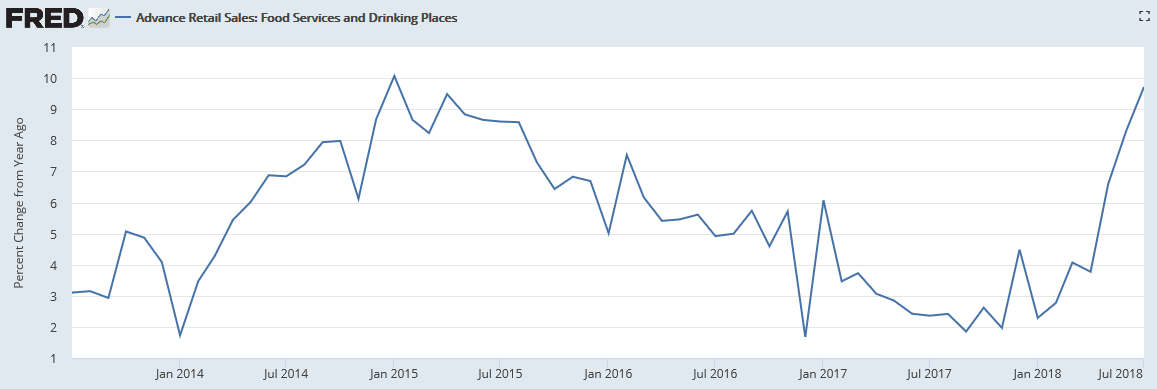
This is a 1-year chart, courtesy of our economic friends at FRED, of ‘Food Services and Drinking Places’ sales. The line shows the % change from one year ago. July’s sales were up 9.7% over July of 2017. But as you can see, July is simply the latest good growth month in an excellent 2018 trend. Food and drink sales have been up significantly each month this year.
The second thing I find very interesting is the fact that the economists over at the St Louis FED, track this kind of minutia! They appear to track just about every economic nugget imaginable. For example, I went to google and typed ‘FRED furniture sales’ and sure enough, the first result is “Retail Sales: Furniture and Home Furnishings Stores.” If there’s something you want to research, I’m guessing you can find it at FRED. Amazing.
Let’s see if this week’s SHI10 results agree with FRED.
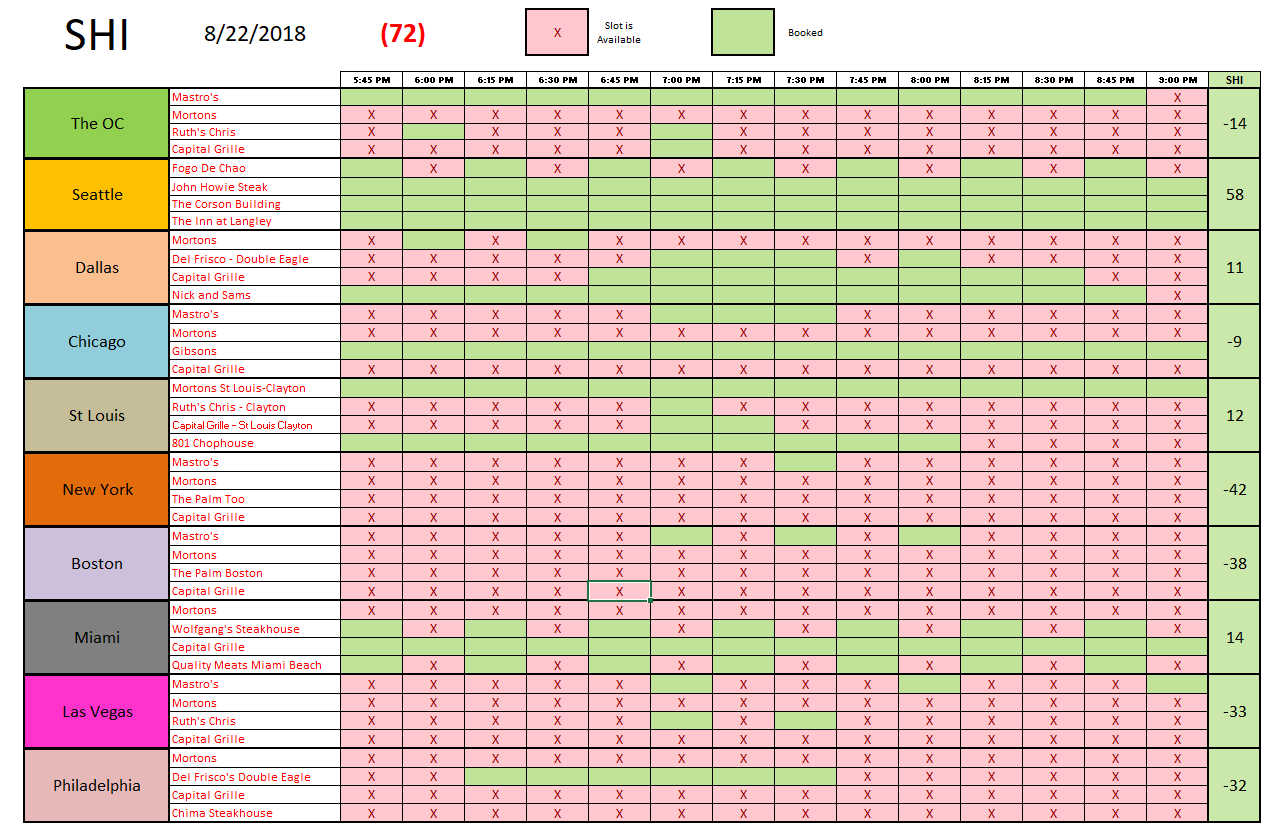
It appears they do. Once again, pricey filets are in high demand this weekend. The folks in Dallas still have their hankerin’ for a thick, juicy T-bone, and the vegetarians have clearly left Miami. When compared to historic SHI results, our expensive eateries are in high demand in both markets. Of course, the prior week Dallas SHI saw an all-time high of 56. Still, at a positive 11 this week, the Dallas SHI remains robust. (Note: Data integrity is important. Please know that two Seattle restaurants and Mortons-Clayton in St Louis were not reporting on Opentable.com. We repeated last week’s data in place of this week’s no-data.)
Here’s our long-term trend matrix:
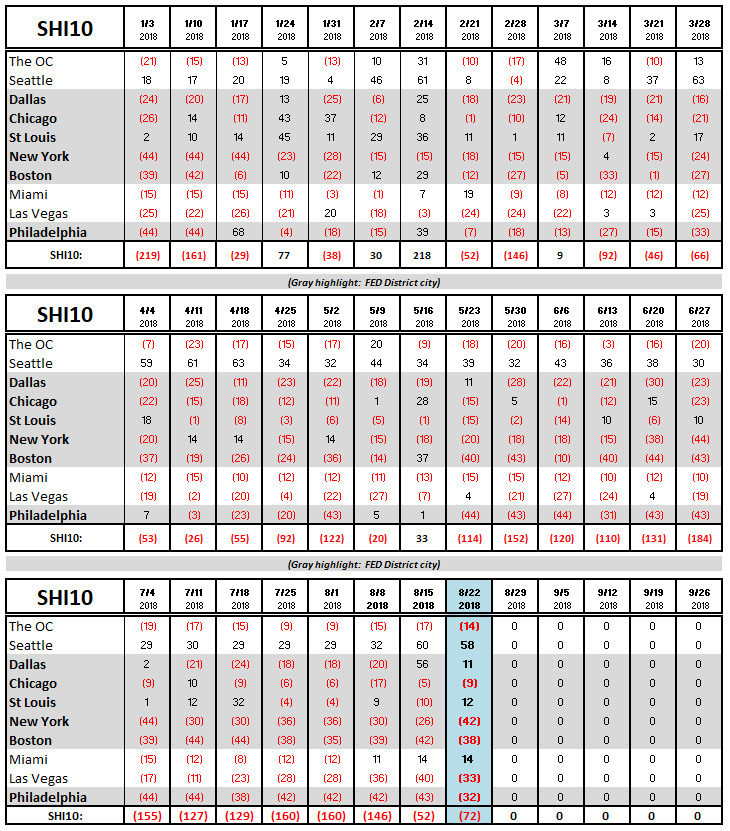
Once again, the SHI10 is predicting strong GDP growth this quarter. Make no mistake: We still have a bumper crop of potential economic challenges that threaten to derail the expansion, including Italy, tariffs, political shenanigans in Washington DC, Turkeys (Erdogan and others), concerns over the longest-ever stock bull market, FED rate hikes, inverted yield curves, and the list goes on.
But for now, anyway, consumers continue to shrug off these concerns, spend money, and have a good time.
- Terry Liebman


