
SHI 1.10.24 – Reservation, Limitation and Automation

SHI 1.3.24 – Economic Dissonance
January 4, 2024
SHI 1.17.24 – The Commercial Real Estate Cliff
January 17, 2024
On a recent phone call, a friend told me he had reservations about the SHI.
“Why?,” I asked.
“You pull your data from OpenTable, right?”
“Yep,” I replied. “I pull data from OT on Wednesdays, each week, at 11 AM, for the identical set of 40 restaurants.”
“Well, you know your data is flawed, right? You know that each restaurant can select the number or percentage of available tables to list on OT? And you know they can adjust this number each and every week? “
“Yep,” I replied again. “I am aware.“
“
SHI data is flawed.”
“SHI data is flawed.”
As my friend seemed quite concerned, and as I am nothing if not a good friend, I suggests we get and discuss his concerns more completely. I asked if he was available to come over this coming Saturday to meet and talk.
“Sure,” he replied. “What time?” “How about 7pm? I asked. “I Does that work?”
“Yes, I’m available at 7. See you then. “
“Great.” I said. “Your 7pm reservation to discuss your reservations is confirmed.“
Welcome to this week’s Steak House Index update.
If you are new to my blog, or you need a refresher on the SHI10, or its objective and methodology, I suggest you open and read the original BLOG: https://www.steakhouseindex.com/move-over-big-mac-index-here-comes-the-steak-house-index/
Why You Should Care: The US economy and US dollar are the bedrock of the world’s economy.
But is the US economy expanding or contracting?
Expanding … FED rate increases notwithstanding! At the end of Q2, 2023, in ‘current-dollar‘ terms, US annual economic output rose to an annualized rate of $26.84 trillion. After enduring the fastest FED rate hike in over 40 years, America’s current-dollar GDP still increased at an annualized rate of 4.7% during the second quarter of 2023. Even the ‘real’ GDP growth rate was strong … clocking in at the annual rate of 2.4% during Q2. No wonder the FED is concerned.
The world’s annual GDP first grew to over $100 trillion in 2022. According to the IMF, in June of this year, current-dollar global GDP eclipsed $105 trillion! IMF forecasts call for global GDP to reach almost $135 trillion by 2028 — an increase of more than 28% in just 5 years.
America’s GDP remains around 25% of all global GDP. Collectively, the US, the European Common Market, and China generate about 70% of the global economic output. These are the 3 big, global players. They bear close scrutiny.
The objective of this blog is singular.
It attempts to predict the direction of our GDP ahead of official economic releases. Historically, ‘personal consumption expenditures,’ or PCE, has been the largest component of US GDP growth — typically about 2/3 of all GDP growth. In fact, the majority of all GDP increases (or declines) usually results from (increases or decreases in) consumer spending. Consumer spending is clearly a critical financial metric. In all likelihood, the most important financial metric. The Steak House Index focuses right here … on the “consumer spending” metric. I intend the SHI10 is to be predictive, anticipating where the economy is going – not where it’s been.
Taking action: Keep up with this weekly BLOG update. Not only will we cover the SHI and SHI10, but we’ll explore “fun” items of economic importance. Hopefully you find the discussion fun, too.
If the SHI10 index moves appreciably -– either showing massive improvement or significant declines –- indicating growing economic strength or a potential recession, we’ll discuss possible actions at that time.
The Blog:
As you can probably guess, I fabricated most of that mythical conversation. 🙂
The friend is real. The reservation-reservation is real. The rest? Not so much.
Yes, the SHI10 measure is inherently flawed. Because the source data from OT is inherently flawed. For example, every December the SHI40 increases significantly. Is this because reservation demand is heightened during the holidays? Absolutely. However, many — if not all — of the expensive eateries we track probably restrict the number of tables available thru the OpenTable app during December. Why? Well, while OT may be free for the consumer to use, the restaurant pays a fee in order to provide that technology to us. The size of that fee is determined by the quantity of reservations made thru the system. It makes perfect sense that in December, the marketing department at Mastros typically limits the maximum number of reservations they will permit during December on the OT system. That’s a smart business move.
So the OT data is flawed. But in the final analysis, you might be shocked to learn that all data sets are inherently flawed. Take the unemployment data released every month by the US government. Economists and pundits typically only discuss the unemployment metric known as U-3 when they report the unemployment rate. But there are six — count ’em — 6 different unemployment measures, each using a slightly different methodology, ranging from U-1 to U-6, that make up the entire unemployment report. Why is the U-3 measure typically the only metric discussed? I couldn’t say. But it is.
U-3 measures “the number of people who are jobless but are actively seeking employment” in the United States. At any moment in time, that could be an enormous number. And, in fact, it is. In December of 2023, the number of unemployed– as determined by the U-3 metric — was 6,268,000. And how did the US Bureau of Labor Statistics calculate this figure? By “contacting 60,000 randomly selected households across the country and recording the employment status of each person 16 years old and older.”
Sixty thousand. The BLS contacts 60,000 households each month and from that data extrapolates the number of unemployed people in the U-3 metric. Clearly this is an inherently flawed metric. There is no way the 6.23 million number can be accurate.
But it would be an impossible task for the BLS to speak with every American, every month, to accurately determine the number of people unemployed. Impossible. And thus, they’ve come up with this system, this methodology. And while we all know it is inherently inaccurate, it is consistent. Every single month, they do the exact same thing.
And for large data sets, consistency is more important than pinpoint accuracy. If for no other reason that pinpoint accuracy is impossible to achieve.
The same holds true for the SHI. While the accuracy is questionable, the consistent methodology gives value to the findings. Here’s this week’s SHI10:
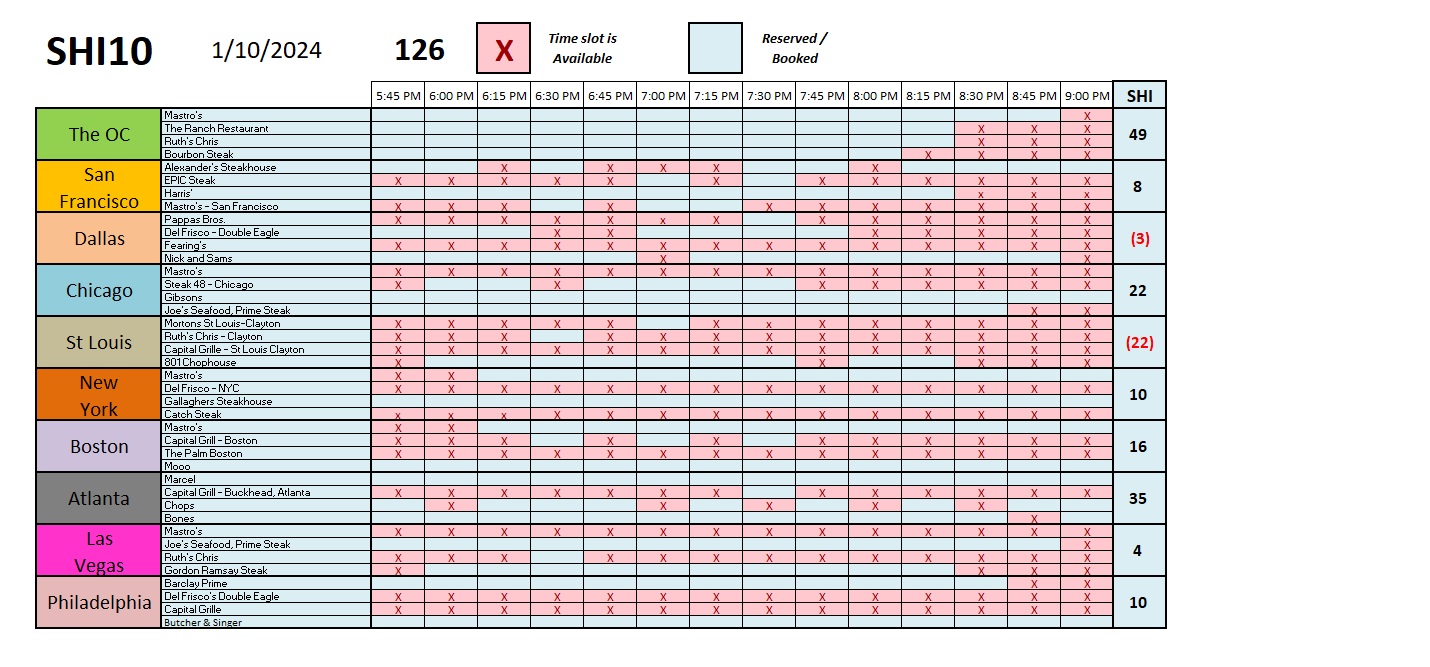
Oh, by the way, the restaurant Bourbon Steak Orange County, does not use OpenTable. I pull their data directly from their website. So that data is accurate! Or is it? 🙂
But the rest of the data from OT? Whether accurate or not, the important thing here is their methodology is consistent. Which means we can easily assess trends over time. It is these trends that make the collection and analysis of the data valuable. If the methodology is consistent, the trend has meaning.
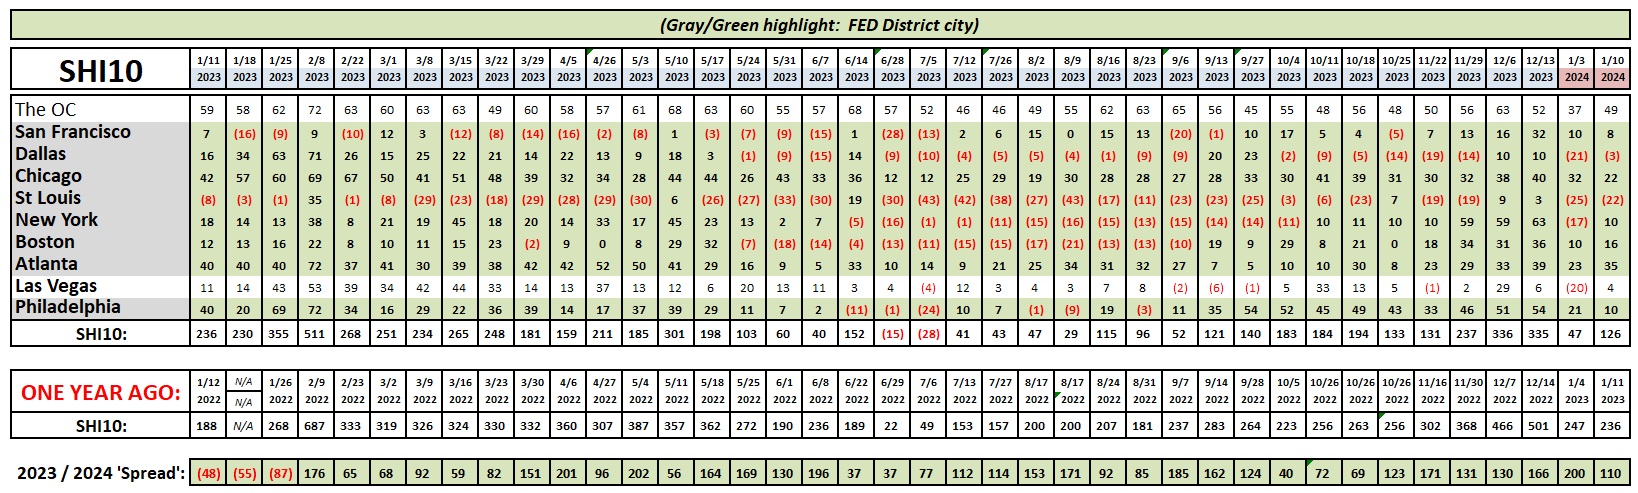
Speaking of consistent, the image you see above will keep its general size and shape in future blog posts. The first column — this week showing data from 1/11/23 — will forever more show data from precisely one year prior. So you can now easily view how strong or weak reservations demand was in each of the ten (10) SHI cities exactly one year before.
I don’t know how much Mastros pays OpenTable to use their technology. What does one reservation cost? I have no idea. The Bourbon Steak – Orange County has an on-line reservation system “Powered by SEVENROOMS.” According to Wikipedia:
SevenRooms is a New York City-based restaurant technology company. It develops a cloud-based data platform used by restaurants, hotels, and other venues to take reservations, manage bookings, and collect guest information.
SevenRooms was founded in 2011. And has been competing with OpenTable ever since.
Can I call Bourbon Steak and make a reservation with a human? Yes. I’ve done that. But I suspect that approach becomes increasingly undesirable for the restaurant as the cost of “human labor” increases and the cost of “machine labor” becomes cheaper. And as AI finds new ways to make humans even more obsolete within the restaurant reservation system, I suspect fewer and fewer reservations will be made by phone, person-to-person. Automation wins this round.
Sorry humans. In the meantime, enjoy your steak. AI has yet to replace that. Except in the movie “The Matrix.”
<:> Terry Liebman


