
SHI 1.17.24 – The Commercial Real Estate Cliff

SHI 1.10.24 – Reservation, Limitation and Automation
January 10, 2024
SHI 1.31.24 – Our Expansion Continues
February 1, 2024
Here’s the headline:
“
CRE Mortgage Maturities & Debt Outstanding:
$2.81 Trillion Coming Due by 2028″
“CRE Mortgage Maturities & Debt Outstanding:
$2.81 Trillion Coming Due by 2028″
That, my friends, is an awfully large number. Large enough to scare the pants off me, frankly.
Because when loans mature, they MUST be repaid. With interest rates today MUCH higher than when most of these loans were originated, this number probably scares the pants off the banks, the GSEs, life insurance companies, and CMBS issuers, too. Because with rates up, commercial property values are at best flat, but more likely lower. And so, in many cases, maturing loans cannot be easily refinanced. This is the commercial real estate cliff.
Welcome to this week’s Steak House Index update.
If you are new to my blog, or you need a refresher on the SHI10, or its objective and methodology, I suggest you open and read the original BLOG: https://www.steakhouseindex.com/move-over-big-mac-index-here-comes-the-steak-house-index/
Why You Should Care: The US economy and US dollar are the bedrock of the world’s economy.
But is the US economy expanding or contracting?
Expanding … FED rate increases notwithstanding! At the end of Q2, 2023, in ‘current-dollar‘ terms, US annual economic output rose to an annualized rate of $26.84 trillion. After enduring the fastest FED rate hike in over 40 years, America’s current-dollar GDP still increased at an annualized rate of 4.7% during the second quarter of 2023. Even the ‘real’ GDP growth rate was strong … clocking in at the annual rate of 2.4% during Q2. No wonder the FED is concerned.
The world’s annual GDP first grew to over $100 trillion in 2022. According to the IMF, in June of this year, current-dollar global GDP eclipsed $105 trillion! IMF forecasts call for global GDP to reach almost $135 trillion by 2028 — an increase of more than 28% in just 5 years.
America’s GDP remains around 25% of all global GDP. Collectively, the US, the European Common Market, and China generate about 70% of the global economic output. These are the 3 big, global players. They bear close scrutiny.
The objective of this blog is singular.
It attempts to predict the direction of our GDP ahead of official economic releases. Historically, ‘personal consumption expenditures,’ or PCE, has been the largest component of US GDP growth — typically about 2/3 of all GDP growth. In fact, the majority of all GDP increases (or declines) usually results from (increases or decreases in) consumer spending. Consumer spending is clearly a critical financial metric. In all likelihood, the most important financial metric. The Steak House Index focuses right here … on the “consumer spending” metric. I intend the SHI10 is to be predictive, anticipating where the economy is going – not where it’s been.
Taking action: Keep up with this weekly BLOG update. Not only will we cover the SHI and SHI10, but we’ll explore “fun” items of economic importance. Hopefully you find the discussion fun, too.
If the SHI10 index moves appreciably -– either showing massive improvement or significant declines –- indicating growing economic strength or a potential recession, we’ll discuss possible actions at that time.
The Blog:
But as best I can tell, it’s hogwash. My analysis suggests that once again, the media is making a mountain out of a mole hill. Fear sells. The cliff, if it exists at all, is more like several stairs on a short walkway.
Let me share a few images and some data, and you decide if you agree:
According to Trepp, the cliff is very real. Who is Trepp?
That sounds impressive. Here is Trepp’s data in two images:
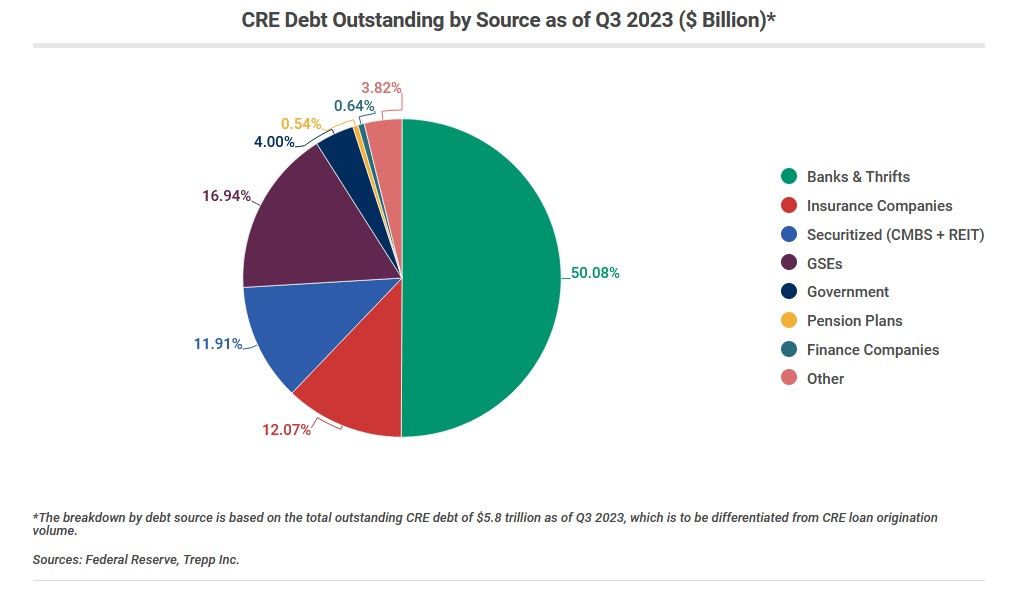
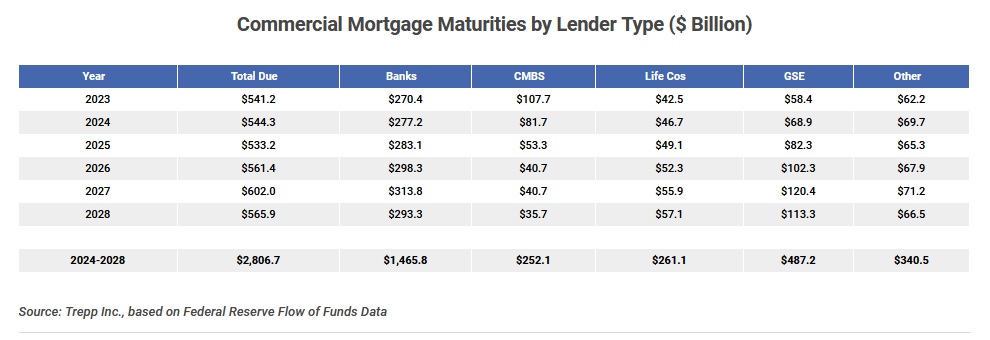
Summarizing, according to Trepp over $2.8 trillion of commercial R/E debt will mature between last year and 2028. About half that amount — or $1.4 trillion — is held by banks. About 40% is held by ‘government sponsored entities’ — known as GSEs — insurance companies, and in ‘commercial mortgage backed securities,’ known as CMBS.
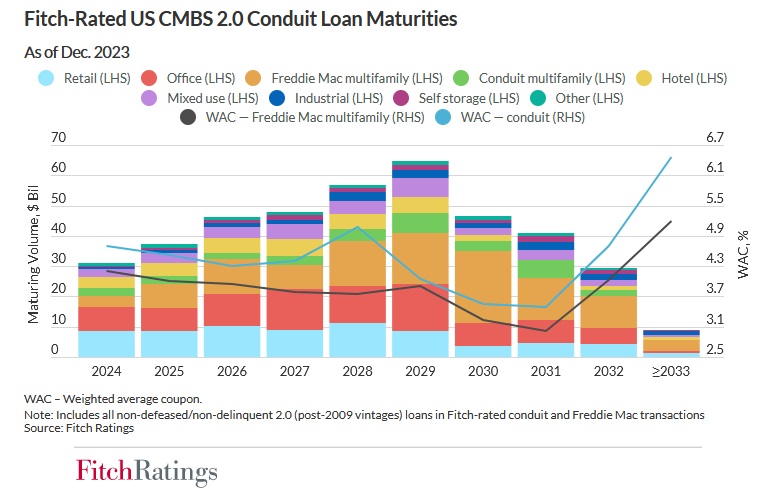
Fitch is a credit rating company. They are one of the big-3. The other two are Moodys and S&P. These 3 companies are global and they have their fingers in pretty much every risk analysis debate across the globe. Their reach is massive. And precise. Here are the Fitch numbers:
And here is the Fitch commentary:
Fitch Ratings-New York-04 January 2024:
Fitch Ratings expects US commercial real estate loan refinancing prospects will materially deteriorate in 2024 relative to 2023, leading to higher CMBS delinquency rates across all major property sectors.
We are projecting the overall US CMBS delinquency rate will increase to 4.50% in 2024 and to 4.90% in 2025 from 2.25% as of November 2023, due to more maturity defaults from higher interest rates, tighter access to capital, fewer special servicing resolutions, less new issuance and increased loan modifications.
Over $31.2 billion, or 1,473, of non-defaulted and non-defeased conduit and agency loans in Fitch-rated US CMBS multiborrower transactions are scheduled to mature in 2024, and $37.9 billion, or 2,437 loans, mature in 2025. These annual totals are higher than the $26.5 billion that matured between October 2022 and December 2023. Maturing loans are concentrated in retail, office and multifamily.
Here, Fitch is concentrating only on the CMBS loan segment. Note they are forecasting a delinquency rate as high as 4.9% by the end of 2025 — up from only 2.25% back at the end of 2023 — and note that the maturing loans are concentrated in retail, office and apartment loans.
Let’s compare the Fitch numbers to those of Trepp:
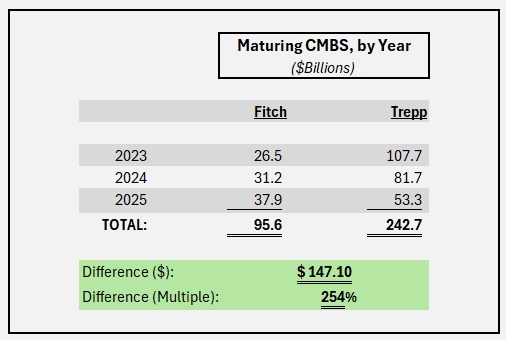
Trepp is forecasting CMBS maturities of $242 billion between 2023 and 2026. Fitch, about $95 billion. The difference is over $147 billion. Said another way, Trepp expects over 2.5X the CMBS maturities that Fitch is forecasting.
Frankly, I believe Fitch. Applying that same 2.5X metric to the total Trepp number, the $2.8 trillion drops to a much smaller number … around $1 trillion or so. How large a portion of total outstanding debt is $1 trillion? Let’s ask the St Louis Federal Reserve:
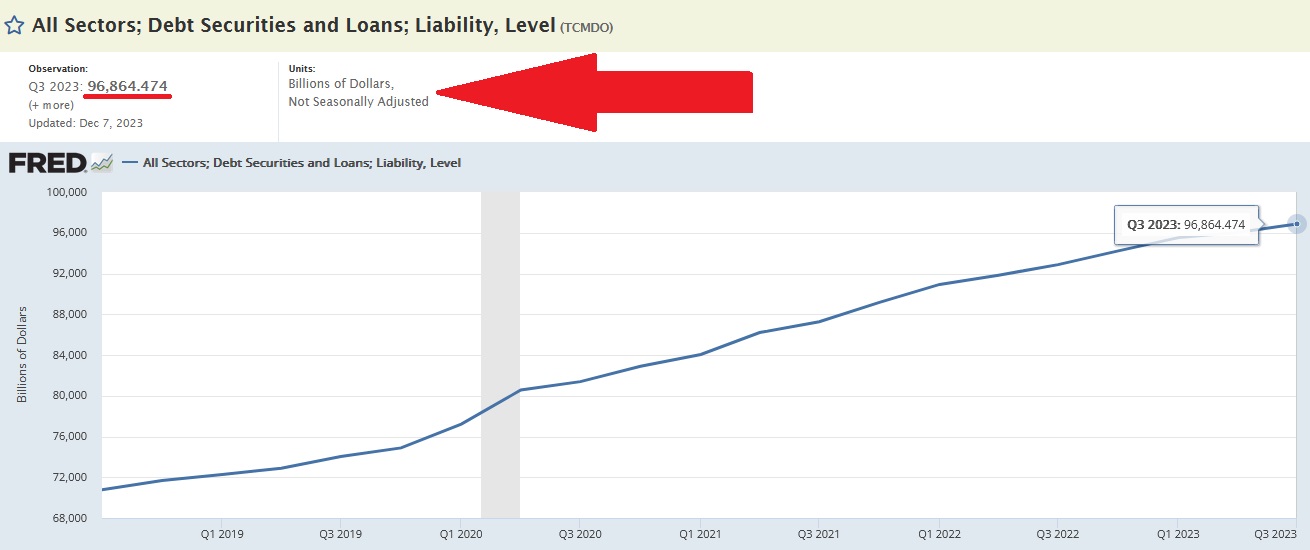
Summarizing, total debt securities and loans measure almost $100 trillion. So, assuming the “real” amount of maturing commercial real estate loans is closer to $1 trillion, about one percent (1%) of total debt securities outstanding come due in the six-years spanning 2023 to 2028.
It is important not to minimize this issue. It is real and one trillion dollars is not a petty sum. There will be pain. But the pain will be smaller than the headlines suggest, spread out over a large number of debt issuers, spread out over 6 full calendar years, and will occur during a time-frame when interest rates are expected to decline, not increase.
I’m no longer worried. How about you? 🙂
To the steakhouses!
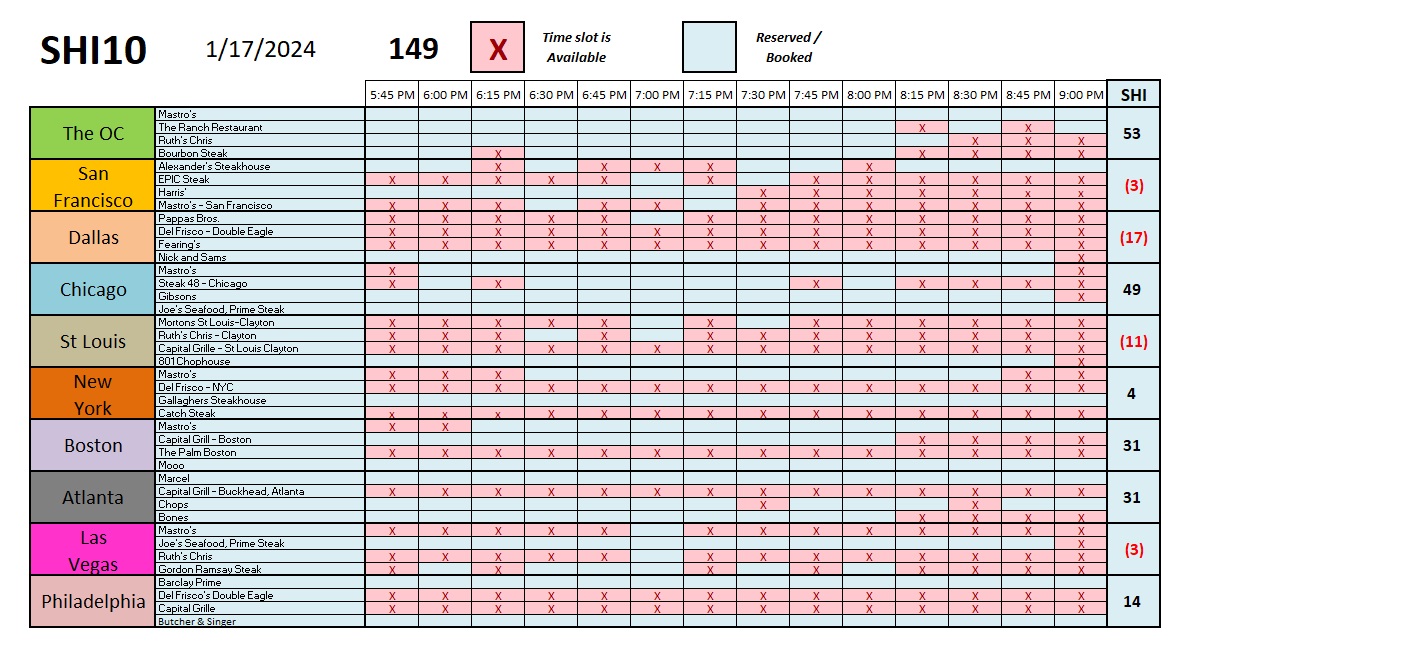
Reservation demand is strong. No significant change here.
Before I began today’s SHI exercise, I expected expensive eatery reservations in “cold” SHI cities to be down this week. After all, many of our mid-west cities have been on the negative side of zero for a number of days. But Chicago reservation demand was robust this week — much strong than last week. The largest drop-off in reservation demand this week, interestingly, was in Dallas. Dallas is cold too, and I guess they are not as adept as our Chicago brothers in handling the frigid weather.
Stay warm out there!
<:> Terry Liebman


