
SHI 1.31.24 – Our Expansion Continues

SHI 1.17.24 – The Commercial Real Estate Cliff
January 17, 2024
SHI 2.14.24 – Riding The Rocket
February 15, 2024
2024’s first GDP report came out last week.
Once again, as I expected and forecasted, the numbers for the first FOURTH quarter of 2023 were fabulous.
“
Real US GDP increased at the annual rate of 3.3%.“
“Real US GDP increased at the annual rate of 3.3%.“
Recession? What recession? Our economy is expanding. Could the future be different? Might the US enter a recession in some future quarter? Most assuredly. The one thing I can guarantee is a recession is in our future.
However, I believe that recession to be far in our distant future. So distant that I really have no idea when that will be. So relax. Ignore the naysayers. Our economy is doing great. Really. You have plenty to worry about … but take the US economy off your list.
Some experts have voiced concern the 2023 decline in money supply is a recessionary signal. Normally I would agree: M2 fell by more than $1 trillion from its peak in mid-2022. But it previously increased from about $15.3 trillion in January of 2020 to over $22 trillion — that’s a $6.7 trillion increase! By comparison the decline is almost meaningless. Some believe the inverted yield curve portends recession. Nope. This one is simply a further example of pandemic disruptions and FED rate hikes.
And many are wringing their hands over the shrinking bucket of post-pandemic consumer savings. Sure, shrinkage was inevitable. But consumer spending — the component making up about 70% of US GDP — continues to slowly expand, thanks, in part, to increased credit card use. In the long run, this is troubling, but for now, fine. Remember: More people are gainfully employed, and at higher income levels, than ever before. Employed folks spend money, use credit cards, and pay their bills.
Our US economy remains solid. Stop worrying about a recession. 🙂
Welcome to this week’s Steak House Index update.
If you are new to my blog, or you need a refresher on the SHI10, or its objective and methodology, I suggest you open and read the original BLOG: https://www.steakhouseindex.com/move-over-big-mac-index-here-comes-the-steak-house-index/
Why You Should Care: The US economy and US dollar are the bedrock of the world’s economy.
But is the US economy expanding or contracting?
Expanding …. By the end 2023, in ‘current-dollar‘ terms, US annual economic output rose to an annualized rate of $27.94 trillion. After enduring the fastest FED rate hike in over 40 years, America’s current-dollar GDP still increased at an annualized rate of 4.8% during the fourth quarter of 2023. Even the ‘real’ GDP growth rate was strong … clocking in at the annual rate of 3.3% during Q4.
According to the IMF, the world’s annual GDP expanded to over $105 trillion in 2022. Further, IMF expects global GDP to reach almost $135 trillion by 2028 — an increase of more than 28% in just 5 years.
America’s GDP remains around 25% of all global GDP. Collectively, the US, the European Common Market, and China generate about 70% of the global economic output. These are the 3 big, global players. They bear close scrutiny.
The objective of this blog is singular.
It attempts to predict the direction of our GDP ahead of official economic releases. Historically, ‘personal consumption expenditures,’ or PCE, has been the largest component of US GDP growth — typically about 2/3 of all GDP growth. In fact, the majority of all GDP increases (or declines) usually results from (increases or decreases in) consumer spending. Consumer spending is clearly a critical financial metric. In all likelihood, the most important financial metric. The Steak House Index focuses right here … on the “consumer spending” metric. I intend the SHI10 is to be predictive, anticipating where the economy is going – not where it’s been.
Taking action: Keep up with this weekly BLOG update. Not only will we cover the SHI and SHI10, but we’ll explore “fun” items of economic importance. Hopefully you find the discussion fun, too.
If the SHI10 index moves appreciably -– either showing massive improvement or significant declines –- indicating growing economic strength or a potential recession, we’ll discuss possible actions at that time.
The Blog:
Below is a great graphic. Take a look:
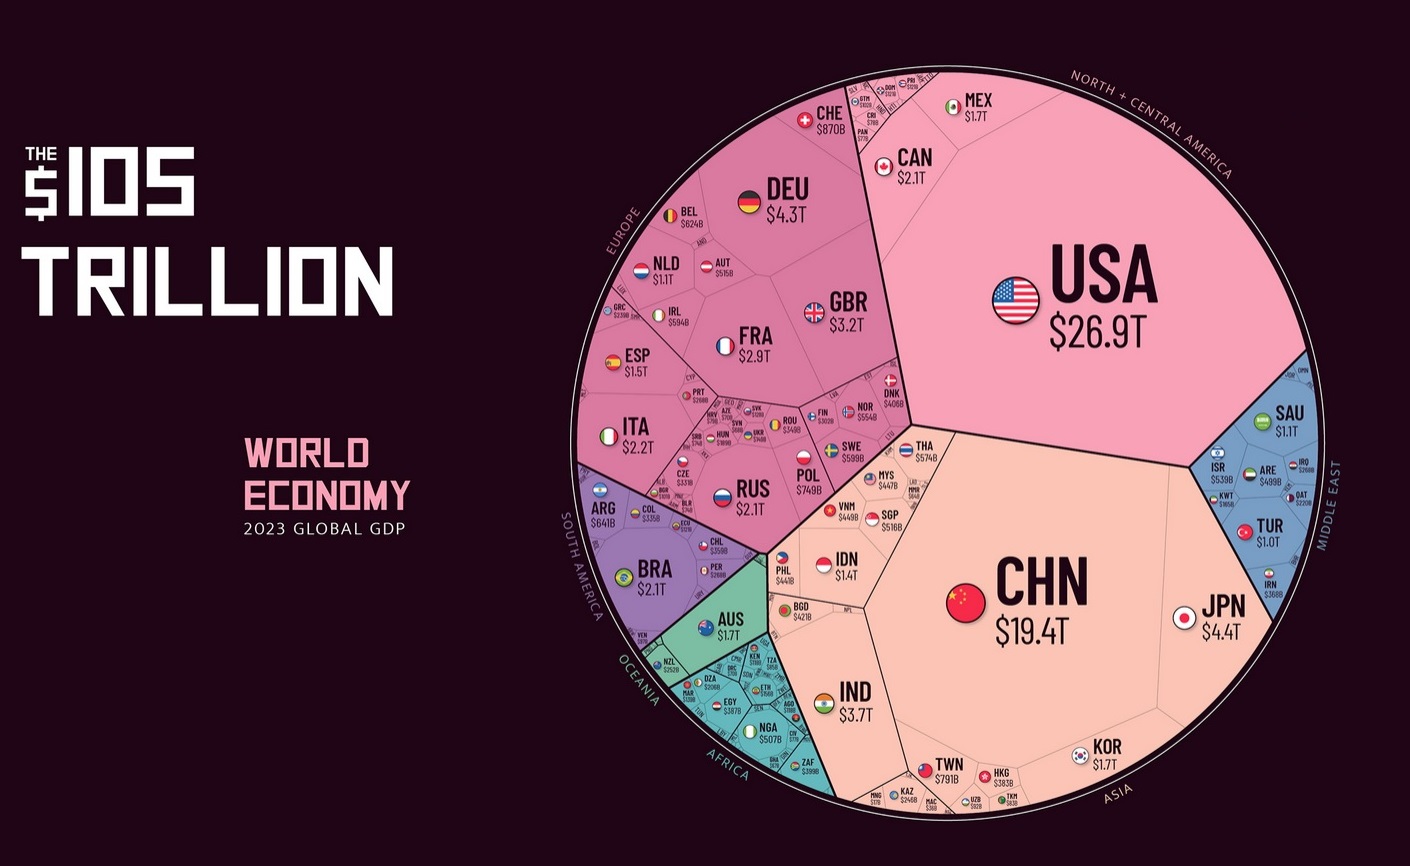
The global economy is now $105 trillion.
Said another way, in 2023 the world produced $105 trillion of ‘economic output.’ Goods and services produced, and everything included in those categories across the 195 countries of the globe, expanded about 5% from the prior year. As you can see in the graphic, the United States remains the ‘Big Dog’ at close to $27 trillion. China is a distant second — the US remains far in the lead with GDP almost 39% higher. Economic activity in Japan and Germany remained solid. Most developed nations in Europe are doing well. India’s economy remains on a tear … growing faster than developed nations, and even Russia — yes, Russia — realized positive economic growth in 2023.
American GDP remains the pinnacle and envy of the world. Consider these facts:
<> In current dollar terms, our GDP increased by $1.61 trillion in 2023.
<> In current dollar terms, our GDP increased by $2.15 trillion in 2022.
<> And in 2021, in current dollar terms, our GDP increased by $2.64 trillion.
2020, of course, was a difficult year in the US and across the globe. The pandemic was horrible for people and economies alike. So, let’s look at the last pre-pandemic year and comparing 2019 GDP to the final number for 2023. 2019 finished with a current dollar GDP of $21.43 trillion. In 2023 our US full year GDP clocked in at $27.36 trillion. That increase is almost $6 trillion. Over 4 years. On a percentage basis, America’s GDP increased by 27.67% in just 4 years. That, my friends, is a staggering achievement.
Repeating … in 2019, US GDP was about $21 trillion. When 2023 ended, that number had increased to over $27 trillion. Say what you want about FED rate increases, inflation, M2 expansion, the FED balance sheet, pandemic-era stimulus payments, etc., this outcome is simply exceptional. The US economy remains transcendent.
Will the trend continue in 2024?
In my opinion, no. The economy is slowing from its blistering pace. Growth of almost 28% in the past 4 years — including the pandemic — is a huge achievement. But one that is unsustainable over the longer term. I believe this outsized growth is directly correlated with the fiscal and monetary response to the pandemic. Both are now history. But America’s GDP has reached a new plateau of almost $28 trillion in annual production. It will continue to grow from here, but at a slower pace.
How much slower? It’s hard to tell for certain. We do know that the first ‘estimate’ for Q4, 2023 was robust: 3.3% on a ‘real’ basis; 4.8% on a current-dollar basis. These results are strong. Activity levels remain high; spending remains solid.
You may remember I was chastised by the Microsoft AI search engine, Bing, a few weeks ago? Bing was not impressed with my sloppy economic work:
“The blog post uses current-dollar GDP as a measure of economic growth, which does not account for inflation or price changes. A more accurate measure would be real GDP, which adjusts for the changes in the value of money over time.”
Ouch. That still stings. Here’s the entire blog post if you have interest:
SHI 12.13.23 – 2024 Predictions!
Anyway, far be it for me to further irritate an artificial intelligence engine. Who knows? If “they” become mad enough, maybe I’ll be targeted “by the machines” for some sort of future retribution? So, contrite, chastened and ever-obedient, permit me to add these Bing-approved comments on the issues of inflation and GDP.
Thru the lens of “chained (2012) dollars,” the 2019 GDP was measured at $19.25 trillion. Using that same methodology, 2023 GDP clocked in at $22.375 trillion — an increase of $3.13 trillion over that same 4 year period. This is a 16.2% increase.
I hope the AI engine would approve of this approach: “Chained dollars” is a method of adjusting real dollar amounts for inflation over time, to allow the comparison of figures from different years. The U.S. Department of Commerce introduced the chained-dollar measure in 1996 . It generally reflects dollar figures computed with 2012 as the base year.
The difference between the ‘current dollar’ percentage increase — 27.67% — and the ‘chained dollar’ approach above, which removes the effects of inflation from the calculation, is about 11.5%. So, summarizing, “real” growth in US GDP during the past 4 years was 16.2%. The increase in GDP attributable to cost increases, higher sale prices, and inflation, was 11.5%. The total GDP increase, in current dollars, therefore, was 27.67%.
I agree with Bing on the AI engine’s point: It is worthwhile to compare economic data, over time, using inflation-adjusted chained dollars. This approach eliminates the noise of inflation and permits us to see true change in the economy over time.
However, as I’ve said numerous times before, we don’t live in the “real” world. We live in the current-dollar world.
For example, America’s national debt is always quoted as a current dollar figure. No one ever says something like, “On an inflation adjusted basis, America’s national debt is far lower than the $34 trillion figure. After adjustment for inflation, using 2012 chained dollars, our debt is only $27 trillion.” No, you’ve never heard that.
Nor have you seen this: “The S&P500 reached a new, all-time high today, closing at 4,940; however, after adjusting for inflation, using 2012 chained dollars, the inflation-adjusted value of the S&P500 is only 4,100.”
And you’ve never seen this at the grocery store: “Today’s inflation-adjusted price of a gallon of milk is only $1.89!”
Because no one cares about the inflation-adjusted price of milk. They care about what it costs today.
So, sure, I agree with my friend Bing: Comparing sequential GDP numbers after removing the effects of inflation is meaningful. It is real. However, as I’ve said numerous times before, we don’t live in the real world. (No, this has nothing to do with the movie, “The Matrix.”) 🙂
The future is unwritten. That’s why we follow the Steak House Index. To help us predict and understand it. Assuming reservation demand for our country’s most expensive steak houses remains strong, this suggests the consumer consumption segment of our $28 trillion economy also remains strong. Let’s see how this week looks:
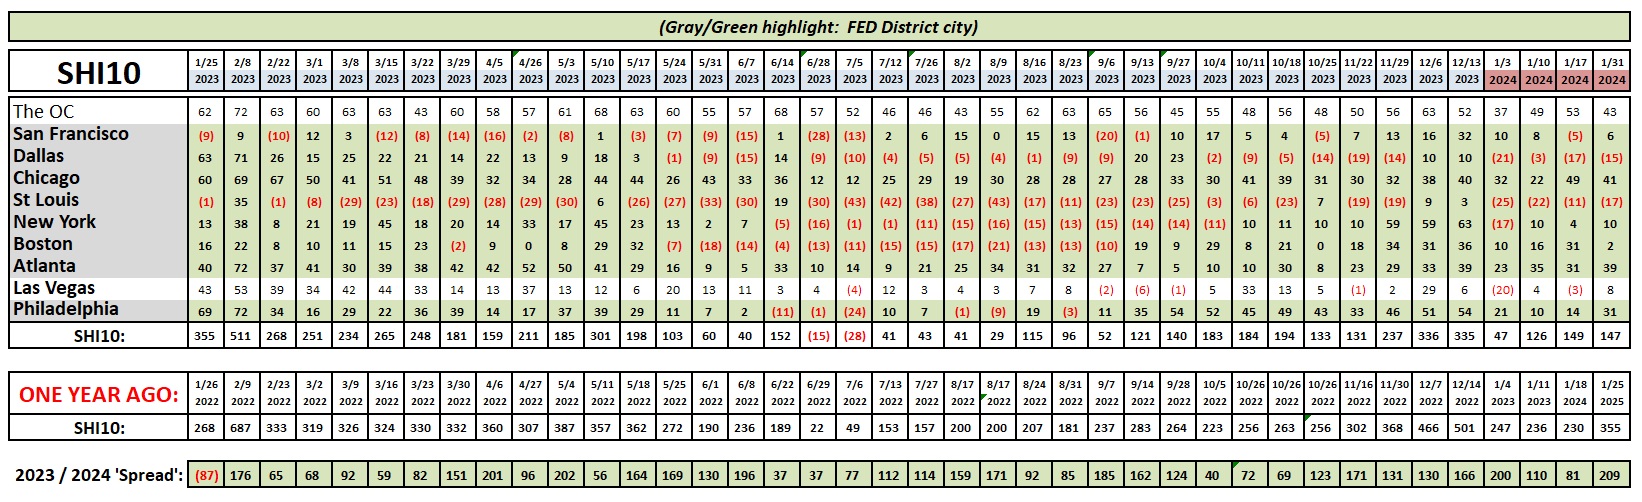
Demand for reservations this Saturday at our priciest eateries remains strong. Remember, the chart above reflects approximately one full year of reservation demand activity. The first and last columns cover generally the same week of the respective year. Thus, the first column charts the final week of January in 2023 while the last column charts the final week of January, 2024. Do you see the (red) ink in the first column? That number reflects the fact that 2023 reservation demand was stronger than 2022. And for that reason, 2024 demand appears quite a bit softer by comparison. This base effect will drop off next week. I don’t see it as meaningful.
In 1763 Thomas Bayes published a paper titled, “An Essay towards solving a Problem in the Doctrine of Chances.”
In addition to being a Reverend, Bayes was a statistician and philosopher. Today, his work is considered foundational by math, statistics and probability experts. Essentially, Bayes Theorem suggests the probability of a future event occurring is conditioned on another that already has. In other words, future probabilities are shaped by past results as well as each result as they occur in real time — or more data. Machine learning is fully reliant on Bayes Theorem and probabilities. As the computer accumulates more data, the program evolves, updating probabilities to gain more accurate results.
Without thinking about it too much, we all use this theorem every minute of every day. As we observe and accumulate more data, we, too, modify our own expectations of future results. In essence, as our data set changes, we recognize that future probabilities change. In this way, we know all future probabilities are not static, but highly variable and dependent on a growing set of data as it becomes available.
When the FED tells us they are “data dependent” this is essentially what they are telling us. Using a Bayesian statistical model, they adjust probabilities of specific future events as more data becomes available. I do the same thing. So do you.
But here’s the rub: Everyone has a different opinion on what the data really means.
Yesterday, the FED announced they were leaving short term interest rates unchanged. I expected that outcome. And so did most “market participants.” What was unexpected, however, was Powell’s comment that a rate cut after their next meeting mid-March was unlikely. As evident by their response, the financial markets did not like this new bit of data. Nor did I. I am of the opinion that the short term rate needs to move a little lower. Not much, mind you, but at least 1% or so. The corrosive effects of abnormally high rates, over time, grow and multiply. Yes, our economy is very strong at the moment, but like an acid eats away at the most durable metal, untenable high interest rates do the same to the US economy.
The market reaction aside, I believe the FED is in a challenging spot, delicately balanced between two concerning future outcomes. On one hand, they are fully committed to stamping out inflation, and preventing any resurgence. On the other hand, they are also committed to promoting overall economic vitality, an outcome whose probability becomes less likely the longer short term interest rates remain at abnormally high levels.
Thus, my assessment of the future for the US economy is essentially reliant on events as they occur and on Bayesian probability. My future beliefs and comments will evolve with more data. Data from the FED. Data from our Steak Houses. And, of course, may other sources.
The future is unwritten. And thus, each new data or event modifies the probability of future outcomes. Like the FED, the Steak House Index remains data dependent and therefore fully reliant on Bayesian statistical theories.
<:> Terry Liebman


