
SHI 2.14.24 – Riding The Rocket

SHI 1.31.24 – Our Expansion Continues
February 1, 2024
SHI 2.21.24 – Landmine Explosions
February 21, 2024
In May of 1999, the Wall Street Journal published an article entitled,
“Companies Chose to Rethink a Quaint Concept: Profits”.
Less than a year later, the NASDAQ stock market collapsed.
Between 1995 and March of 2000, the NASDAQ had increased more than 800%. Then came the crash. Within a couple of years, the rocket that had explored the heavens returned to earth in a spectacular crash, shedding some 78% of its peak value. By the time the smoke cleared, US stocks had lost $5 trillion in market capitalization.
“
The value of an asset
is some function of its income.“
“The value of an asset
is some function of its income.“
Keep in mind that “income” is a somewhat fluid concept. In some cases, income can be something other than financial. Your home doesn’t generate income to you … but it does provide you with a place to live, one that you presumably love and appreciate.
Reminiscent of 25 years ago, in 2023, the “Magnificent 7” shot up like a rocket. In fact, the market capitalization of this stock group more than doubled in value.
Many have watched in disbelief and amazement. Some have opined this event is bubble, the precursor to another market crash, reminiscent of 2000 and the “dotcom” crash.
Is today’s overvaluation simply planting the seeds for the next big crash? Are today’s Magnificent 7 simply tomorrow’s roadkill? Are these stocks as wildly overvalued as Pets.com and Boo.com back in 1999?
Or should you cast aside your apprehensions, jump in, and ride the rocket too?
Welcome to this week’s Steak House Index update.
If you are new to my blog, or you need a refresher on the SHI10, or its objective and methodology, I suggest you open and read the original BLOG: https://www.steakhouseindex.com/move-over-big-mac-index-here-comes-the-steak-house-index/
Why You Should Care: The US economy and US dollar are the bedrock of the world’s economy.
But is the US economy expanding or contracting?
Expanding …. By the end 2023, in ‘current-dollar‘ terms, US annual economic output rose to an annualized rate of $27.94 trillion. After enduring the fastest FED rate hike in over 40 years, America’s current-dollar GDP still increased at an annualized rate of 4.8% during the fourth quarter of 2023. Even the ‘real’ GDP growth rate was strong … clocking in at the annual rate of 3.3% during Q4.
According to the IMF, the world’s annual GDP expanded to over $105 trillion in 2022. Further, IMF expects global GDP to reach almost $135 trillion by 2028 — an increase of more than 28% in just 5 years.
America’s GDP remains around 25% of all global GDP. Collectively, the US, the European Common Market, and China generate about 70% of the global economic output. These are the 3 big, global players. They bear close scrutiny.
The objective of this blog is singular.
It attempts to predict the direction of our GDP ahead of official economic releases. Historically, ‘personal consumption expenditures,’ or PCE, has been the largest component of US GDP growth — typically about 2/3 of all GDP growth. In fact, the majority of all GDP increases (or declines) usually results from (increases or decreases in) consumer spending. Consumer spending is clearly a critical financial metric. In all likelihood, the most important financial metric. The Steak House Index focuses right here … on the “consumer spending” metric. I intend the SHI10 is to be predictive, anticipating where the economy is going – not where it’s been.
Taking action: Keep up with this weekly BLOG update. Not only will we cover the SHI and SHI10, but we’ll explore “fun” items of economic importance. Hopefully you find the discussion fun, too.
If the SHI10 index moves appreciably -– either showing massive improvement or significant declines –- indicating growing economic strength or a potential recession, we’ll discuss possible actions at that time.
The Blog:
The 1999 WSJ article mentioned above starts here:
“James Borkowski always thought so, until he started listening to venture capitalists.”
“The attitude is almost antiprofit,” marvels Mr. Borkowski, executive vice president of Industrial Microwave Systems Inc. He says that his two-year-old company originally planned to become profitable in the year 2000. “But our financial advisers told us not to be profitable too quickly,” he says. So the company is projecting losses until 2001.
Driven by the rise of Internet-related companies, the logic of doing business in a “digital” economy is starting to sweep through more and more precincts of American business. The result: One of the sacred tenets of business — you must make money — suddenly looks like a quaint artifact of an outdated era. Many investors care less about a company’s being in the black than about its ability to win turf in what has become a giant land grab.
Amazed? Rest assured, I was. I lived through that episode. Fortunately, I was not a stock investor between 1995 and 2005. Unlike the army of investors willing to buy public stocks in 1998 based on ‘eyeballs’ as opposed to earnings-per-share, I have always believed profits are important. Critically important.
So, when I see the market capitalization of the Magnificent 7, rising to new heights week after week, I must ask myself if these moves are, to paraphrase Alan Greenspan, another bout of “irritational exuberance,” or if something different is afoot this time?
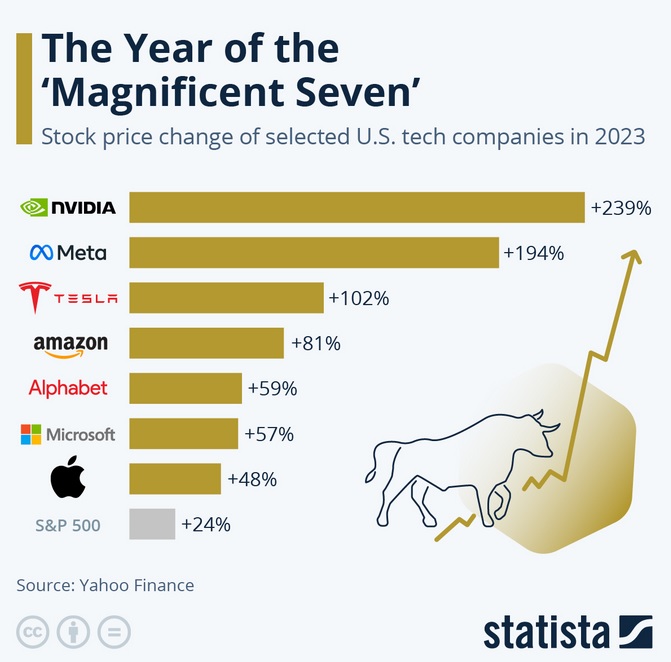
Those are some big value moves in just one year. Ironically, Apple is the laggard. Nvidia, on the other hand, is
S O A R I N G !
And not just in the past year. Here is a 10-year chart:
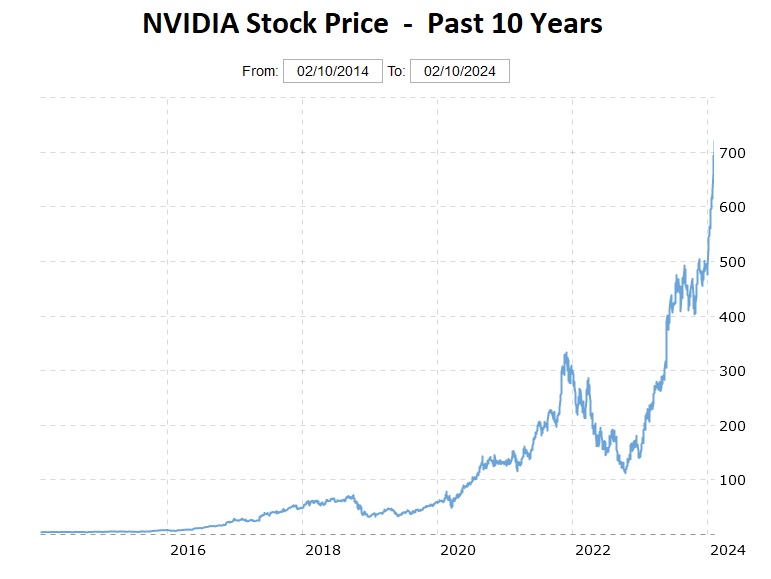
In February of 2014, Nvidia’s stock price was $4.59 per share. Today’s price is up over fifteen thousand percent.
Is this a bubble? One metric we can use to assess the “bubblish-ness” – if that is even a word – of the market is the price/earnings ratio. Back in the period from 1995 and March of 2000 when the NASDAQ increased more than 800% the market PE ratio was thru the roof – literally:
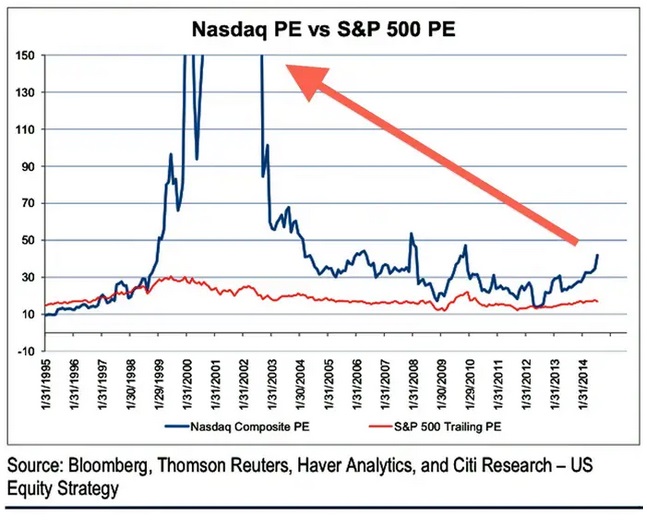
Why did the PE ratio get so high during this period?
Stock values skyrocketed without commensurate earnings. Many of the newly-minted, publicly traded internet companies only lost money. Many were never profitable. That is not the case today. Profits today are huge.
Consider these facts: In the 4th quarter of 2023, Apple, Amazon and Meta realized combined revenue of almost $330 billion. In one quarter. And their collective profits were $58.5 billion.
IN ONE CALENDAR QUARTER!
Let’s annualize those numbers, shall we? In this mythical example, these three companies could produce a combined annual revenue of $1.32 trillion and profits of $234 billion. If the value of an asset is some function of its income, what is the value of these assets? A whole lot more than Pets.com. No, clearly, the future looks bright for the Magnificent 7.
Let me add a bit of perspective here. If Apple, Amazon and Meta were to actually generate $1.32 trillion of revenue in one year, this would equal almost 5% of the entire US GDP!
But not every sector of this public stock market is soaring to the heavens. Some are flat … and others are down.
For example, the market capitalization of publicly traded office building REITs is plummeting straight into the dirt. This sector is down. Significantly.
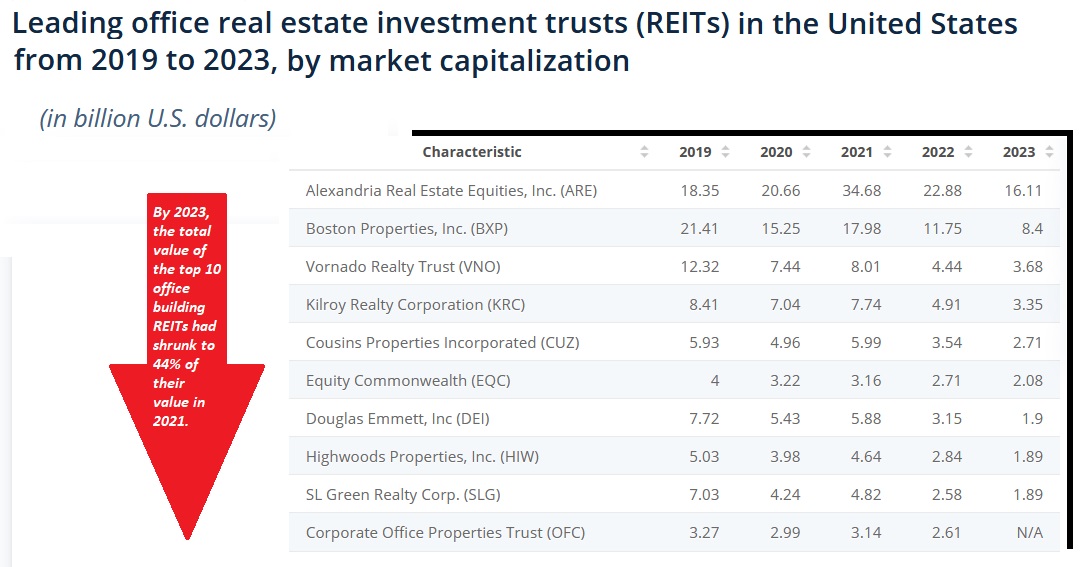
Once again, our primary thesis today suggests “the value of an asset is some function of its income.” Office building income is down. Thus, values have plummeted. Significantly.
As we all know, Covid emptied out office buildings across the globe. People worked from home. And many continue to do so today … creating this office building financial crisis. The 4th quarter, 2023 report from CBRE on this sector claims:
<> “The US office market closed 2023 with a fifth consecutive quarter of negative.”
<> Combined with new supply, overall vacancy increased to 18.6% — a 30 year high.”
That “vacancy rate” percentage laughably wrong – it is far too low. Because even though that may be the “official” vacancy rate, the actual rate is much, much higher in most cities, when including space available for sub-lease and space that is simply unoccupied by the tenant leasing the space.
Office building income is down. And the future looks dismal. So dismal, it appears, that the market capitalization of the publicly traded office building REITs shown here are down about 55%.
It’s worth mentioning the office building problem is unique to office buildings – and not the entire commercial real estate sector as a whole. For example, according to that same CBRE report, retail space “availability” has hit a new low and asking rents are rising. Industrial space demand is cooling, but stable. Same with hotels. And in the multifamily space, over 400 thousand new apartment units were added to US supply in 2023, which is the highest annual total since CBRE began tracking the market back in 1996. Apartment rents are softening. Slightly. No, within the commercial real estate market, office buildings are the big losers. The rest is a mixed bag.
The market cap of the ‘Magnificent 7’ is way up. Office building REIT values are way down. These are the facts. Because “the value of an asset is some function of its income.”
Here is another headline from a WSJ article published just days ago:
“AI Is Starting to Threaten White-Collar Jobs. Few Industries Are Immune.”
“Generative AI could soon upend a much bigger share of white-collar jobs, including middle and high-level managers, according to company consultants and executives. Unlike previous waves of automation technology, generative AI does not just speed up routine tasks or make predictions by recognizing data patterns. It has the power to create content and synthesize ideas — in essence, the kind of knowledge work millions of people now do behind computers.”
Of course, the word ‘could’ is not the same as ‘will.’ The future is unwritten. The jury is out. But the evidence is pretty compelling.
The impact of AI on US GDP is likely mixed. For example, on one hand, generative AI has the potential to dramatically reduce employment in law and entertainment; but, at the same time, increase the profitability of the companies who are able to reduce head count. But the impacts on employment levels notwithstanding, the question remaining to be answered is whether the AI revolution will increase the amount revenue-per-employee, per-year, over time.
Another way of looking at this issue is through the lens of “labor productivity” growth. Let’s first define the term. According to the BLS, “Labor productivity, or output per hour, is calculated by dividing an index of real output by an index of hours worked of all persons, including employees, proprietors, and unpaid family workers.”
So, essentially, labor productivity is a measure of ‘output’ per hour. Which, when you think about it, is very closely aligned with the idea of revenue per employee in a fixed time period.
After slipping in Q1 of 2023, the next three quarters of the year all saw significant gains in labor productivity. The historical average in labor productivity since 1947 is 2.1%. In Q2, Q3, and Q4 of last year, labor productivity grew by 3.5%, 4.9% and 3.2%, respectively. Are we beginning to see the AI effect here? Quite possibly.
On the other hand, AI is unlikely to impact employment at our steakhouses, right? ?
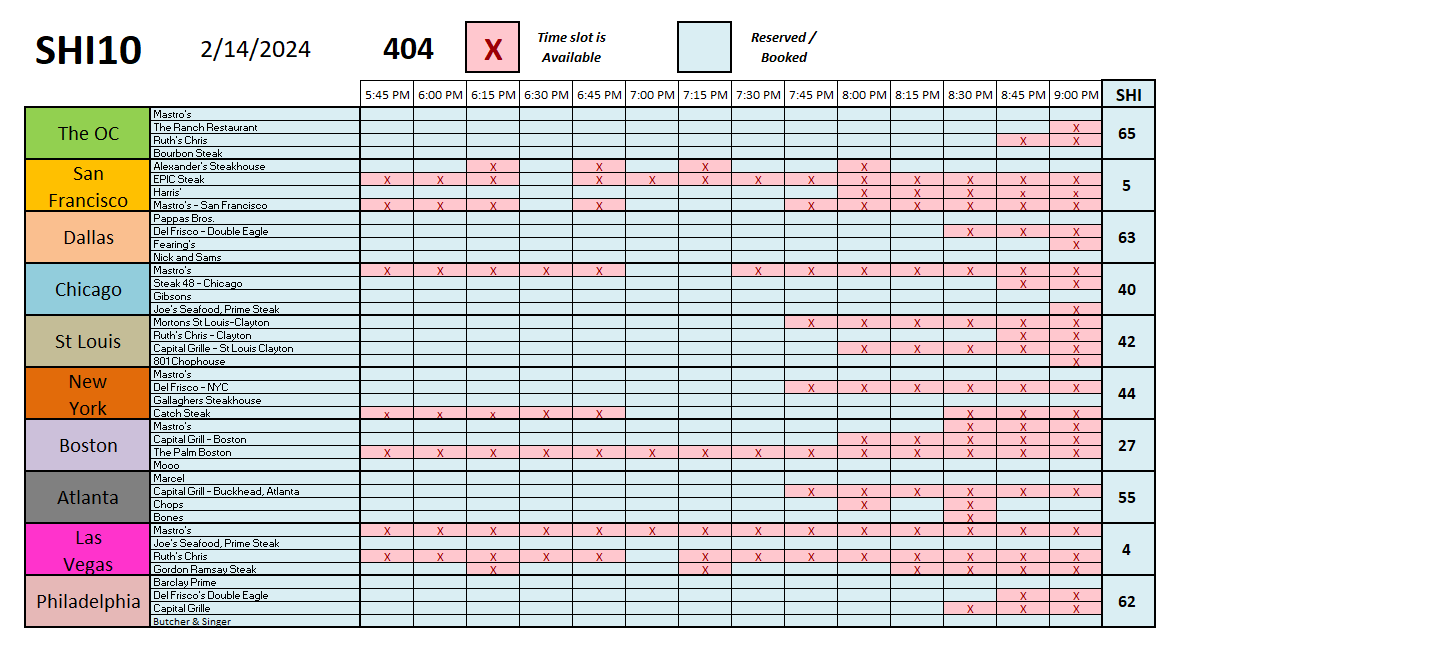
There are no employment concerns at our steakhouses. This week’s SHI reading is riding the rocket too — eclipsing 400 for the first time in ages. Of course, today is Valentines Day … which must be impacting reservation demand in our expensive eateries. Did we see the same trend last year?
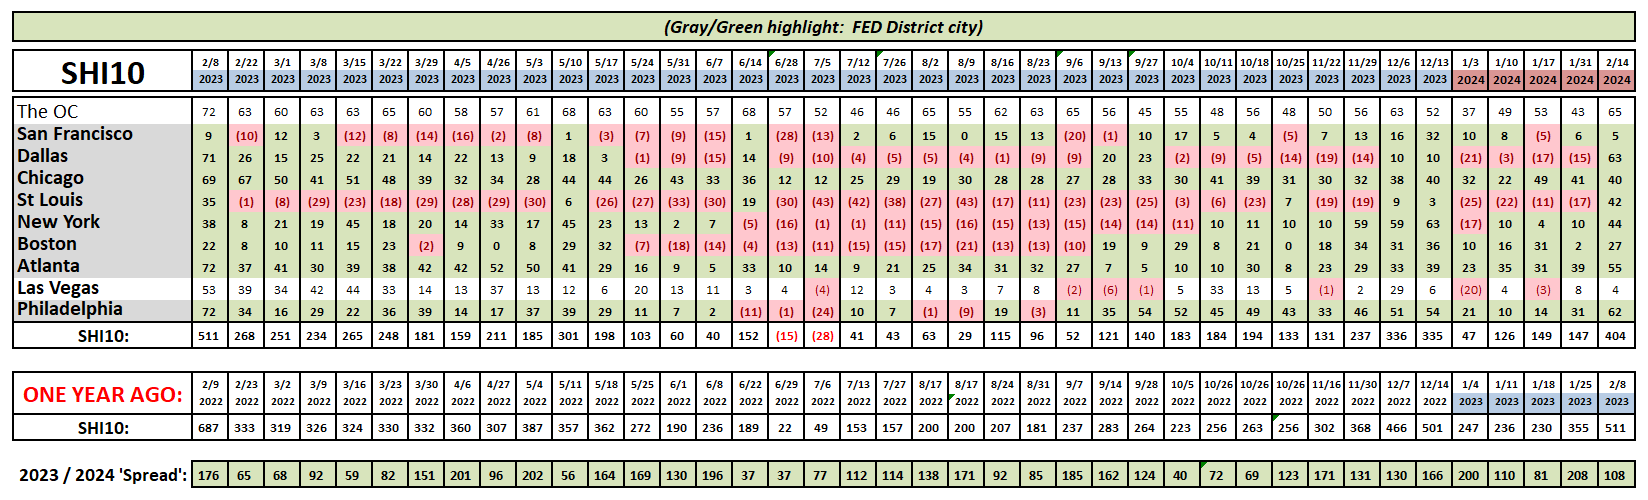
We did. The commensurate reading from 2023 (the first column above) was 511. Nothing says “I Love You!” better than an expensive steak!
Note the new coloring of the matrix above. Using conditional formatting, we can now easily see an SHI reading that is in the red. To me, this makes the chart easier to interpret with a quick glance. See what you think.
Once again, the SHI10 is predicting a steady US economy. The most recent economic forecast from the Atlanta FED agrees: Their most recent GDPnow forecast expects a 3.4% GDP growth in Q1, 2024. agrees. The NY Fed “Nowcast‘ is almost identical at 3.3%. And remember: These are ‘real’ GDP numbers — the nominal figure is higher by the rate of inflation.
If you were heavily invested in public office building REITs, or simply unlucky enough to own a CBD office building as an investor, you pulled the short straw. This sector is a clear post-covid loser.
But the stock value moves in the Magnificent 7 – and by extension – the S&P 500 where almost 30% of the value of that index is made up of this 7-stock group, is not a 1999 bubble. The move is legitimate, fully supported by actual earnings. And in my humble opinion, likely to continue.
I say, “Ride the rocket!” But, in the interest of full disclosure, I also own an office building. So my advice is a bit sketchy at best. ?
:-<>-: Terry Liebman


