
SHI 1.3.24 – Economic Dissonance

SHI 12.13.23 – 2024 Predictions!
December 14, 2023
SHI 1.10.24 – Reservation, Limitation and Automation
January 10, 2024
Why the long face?
She does not look happy. As you’ll see below, she is one of many Americans who are quite unhappy with today’s economy. Does this all come down to consumer prices?
While the inflation rate has fallen significantly, prices remain stubbornly high. As I’ve said in numerous blog posts, this outcome is quite typical. The price for consumer goods often hold new, higher levels even as inflation declines. Like most Americans, our friend pictured above dislikes her bill at the grocery store and gas pump.
So is that it? Is that the source of today’s widespread discontent across America?
“
Why are Americans blue?”
“Why are Americans blue?”
Frankly, I’m puzzled. By my count, economic conditions have rarely been better. I’m serious. Read my blog post below and let me know if you disagree.
Welcome to this week’s Steak House Index update.
If you are new to my blog, or you need a refresher on the SHI10, or its objective and methodology, I suggest you open and read the original BLOG: https://www.steakhouseindex.com/move-over-big-mac-index-here-comes-the-steak-house-index/
Why You Should Care: The US economy and US dollar are the bedrock of the world’s economy.
But is the US economy expanding or contracting?
Expanding … FED rate increases notwithstanding! At the end of Q2, 2023, in ‘current-dollar‘ terms, US annual economic output rose to an annualized rate of $26.84 trillion. After enduring the fastest FED rate hike in over 40 years, America’s current-dollar GDP still increased at an annualized rate of 4.7% during the second quarter of 2023. Even the ‘real’ GDP growth rate was strong … clocking in at the annual rate of 2.4% during Q2. No wonder the FED is concerned.
The world’s annual GDP first grew to over $100 trillion in 2022. According to the IMF, in June of this year, current-dollar global GDP eclipsed $105 trillion! IMF forecasts call for global GDP to reach almost $135 trillion by 2028 — an increase of more than 28% in just 5 years.
America’s GDP remains around 25% of all global GDP. Collectively, the US, the European Common Market, and China generate about 70% of the global economic output. These are the 3 big, global players. They bear close scrutiny.
The objective of this blog is singular.
It attempts to predict the direction of our GDP ahead of official economic releases. Historically, ‘personal consumption expenditures,’ or PCE, has been the largest component of US GDP growth — typically about 2/3 of all GDP growth. In fact, the majority of all GDP increases (or declines) usually results from (increases or decreases in) consumer spending. Consumer spending is clearly a critical financial metric. In all likelihood, the most important financial metric. The Steak House Index focuses right here … on the “consumer spending” metric. I intend the SHI10 is to be predictive, anticipating where the economy is going – not where it’s been.
Taking action: Keep up with this weekly BLOG update. Not only will we cover the SHI and SHI10, but we’ll explore “fun” items of economic importance. Hopefully you find the discussion fun, too.
If the SHI10 index moves appreciably -– either showing massive improvement or significant declines –- indicating growing economic strength or a potential recession, we’ll discuss possible actions at that time.
The Blog:
As we all know, 2024 is a presidential election year. Whether this one is more unusual than past election years, of course, depends on your perspective. And, rest assured, American has seen some exceptionally contentious elections across the past 200 years:
<> 1824: Andrew Jackson won the popular and electoral college vote … but not the majority of all voters. The US Constitution thus required the House of Representative determine the president, choosing from the top 3. They picked John Q. Adams. Not Jackson. Jackson was livid, claiming the election was stolen by a “corrupt bargain” between Adams and Clay.
<> 1876: It is widely believed Samuel Tilden won the popular vote against Rutherford Hayes, but there were sizable allegations of voter fraud and election violence. Hayes was ultimately “appointed” to the presidency by a special Congressional hearing.
<> 1912: President Teddy Roosevelt pushed his party to nominate his buddy William Taft for the presidency. Taft won the election, but as time passed Roosevelt became unhappy with Taft’s work, and challenged Taft for President in the next election. Roosevelt claimed Taft was filled with “politically crookedness” and Taft retorted that Roosevelt had become the most dangerous man in American history. During the contentious campaign, Roosevelt assured Americans a “great moral issue” was at stake, and “… we stand at Armageddon and battle for the lord!” The ensuing vitriol split the Republican party vote, paving the way for Woodrow Wilson to slid in and win the presidency.
<> 2000: I think we all remember the controversy in Florida, the ‘hanging chad’, and an election finally decided by the U.S. Supreme Court.
<> 2020: Trumps “stolen election conspiracy” theory in his loss to Biden and the January 6th attack on the US Capital building. You know the rest.
Years in the future, when the 2024 election is long over, I wonder how historians will look back on this election.
The Iowa Caucus on January 15th is the effective firing of the starter’s pistol … and the race is off. Across America, we see plenty of vitriol and no shortage of disagreement. And as in many past elections, morality and the lord are popular themes.
So is the economy. In fact, according to the Brookings Institution, when asked whether “economic” or “social” issues would be most important in determining their 2024 vote for president, 62% of young adults said economic issues. They believe the economy is in bad shape, and as 2024 begins, they appear to blame President Biden.
Let me repeat: Like in 2023 and all the years before, this blog is politically agnostic. We’re just not gonna talk politics. But we will talk ‘history.’
As the 1992 presidential election approached, the US was coming out of a brief recession. George HW Bush was President, running for a second term. But as you know, the incumbent president is typically held accountable for current economic conditions. Bush was blamed for the recession and job losses. He was perceived as being “out of touch” with the needs of ordinary Americans.
“It’s the economy, stupid” is a phrase that has become deeply ingrained in American politics since Bill Clinton’s campaign brought it to the political scene back in 1992. Clinton was battling Bush for the presidency. The recession that began mid-1990 “officially” ended in March of 1991, only 8 months later, but according to the US Department of Labor, more than 1.3 million jobs were lost as a result of the recession. In fact, the unemployment rate continued to rise thru June of 1992. The economy was clearly a pivotal issue in the 1992 election. Bad for Bush. Good for Clinton.
Mark Twain once quipped, “History doesn’t repeat itself, but it does rhyme.” Will economic dissatisfaction impact this year’s presidential election too? Does 2024 rhyme with 1992? ?
Time will tell, but recent polling data suggests that it might. People appear very unhappy with the economy today:
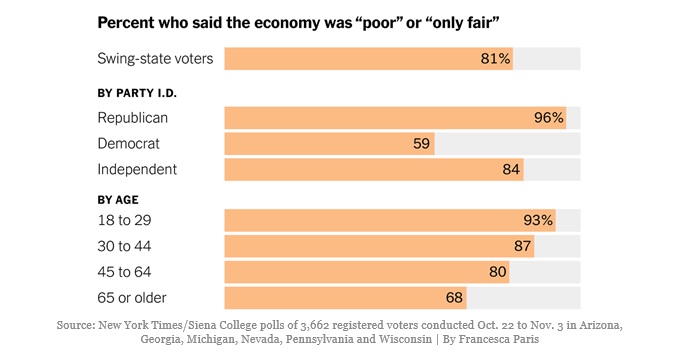
Of course, as we see above, this poll talked to only 3,662 people from 6 different states. Who were these 3,662 people? I have no idea. Are their opinions representative of the US as a whole? A whole host of other data suggests they are.
Of course, none of the pollsters ever ask for my opinion! But, in their defense, that’s probably because I never answer the phone when I don’t recognize the caller. You probably don’t either. But if on a whim you do, like me, you probably hang up quickly when the caller says, “Hello Mr. _____ may I ask you a few quick questions?” Which makes me wonder who does answer their phone for an unknown caller, and then stay on the line with a stranger to answer questions? My guess? Very bored, very opinionated people with a lot of time on their hands. You know the type: Someone unhappy in general, regardless of the question asked. ?
Who knows. What I do know is the economic reality is quite different than the common perception today. Ironically, the US economy is actually doing exceptionally well.
Consider these blue-ribbon metrics of economic health:
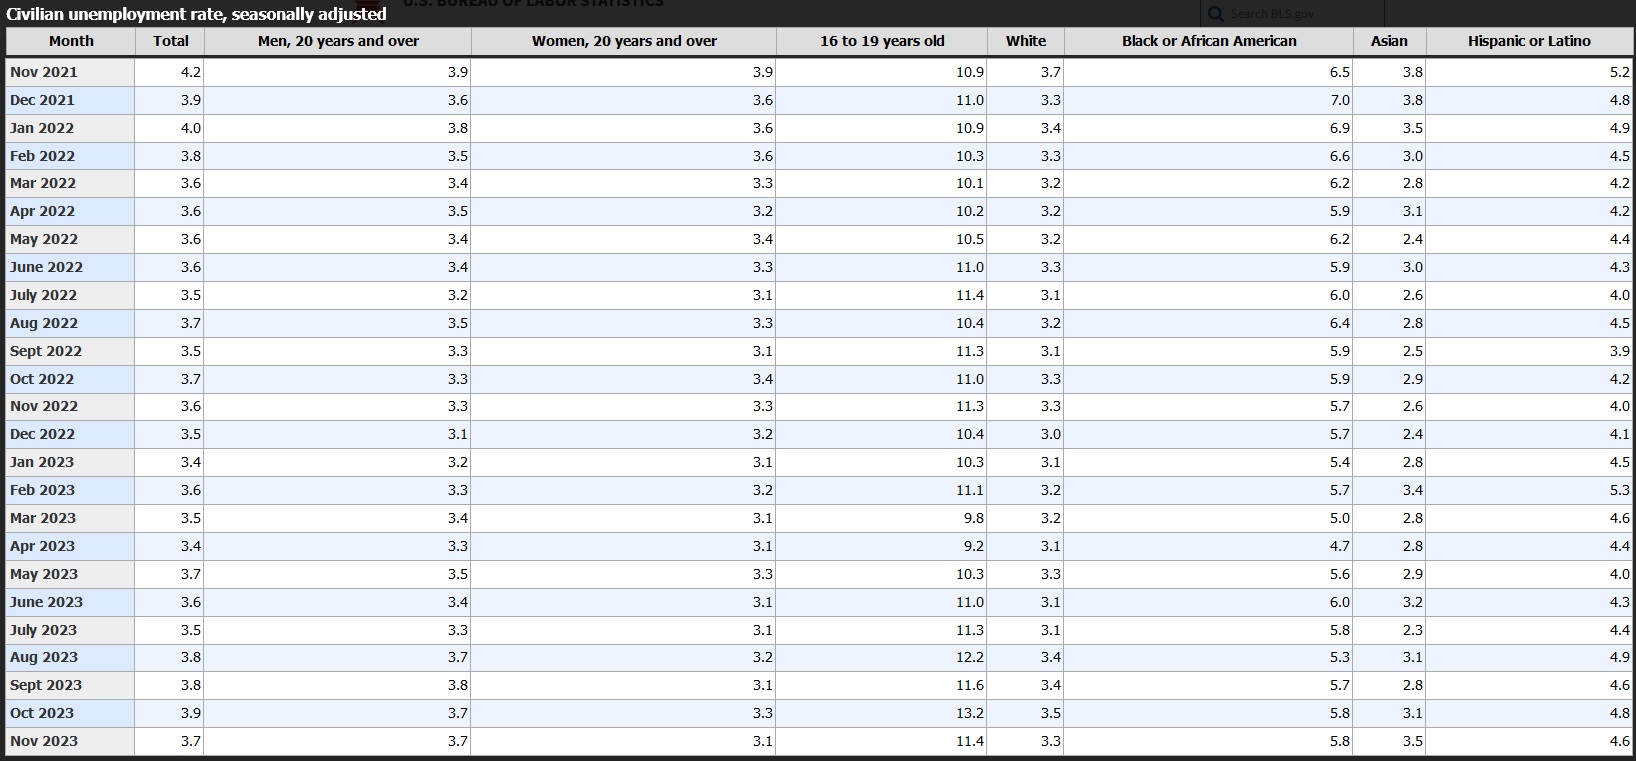
Unemployment rate / job growth
In January of 2022, according to the US Bureau of Labor Statistics, total non-farm employment measured 150.1 million folks. By November of 2023, that had increased to 157 million – a gain of almost 7 million jobs. From January of 2023 – so that we can eliminate all the pandemic-caused losses – that number was 155 million.
By November of last year, 2 million new jobs were created since January of 2023.
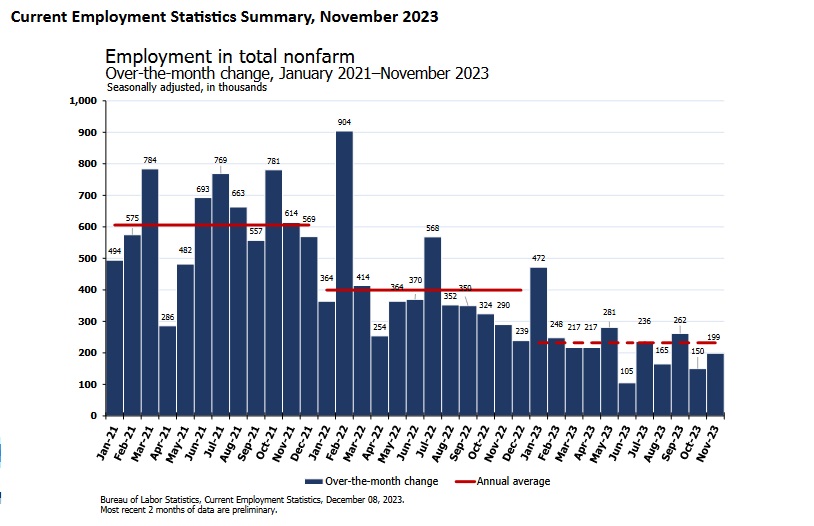
It’s important to note that all those jobs were created across all races and genders. Unemployment for women, 20+ years of age, has never been lower. In spite of the FED rate increases in 2022 and 2023, the overall unemployment rate remained surprisingly stable, finishing November of 2023 at near a 50-year low of 3.7%. Like many other economists, early on I was worried the FED rate increases would trigger a landslide in job losses. Nope. The precise opposite happened.
Not only did most folks keep their jobs, but millions of new jobs were created. Across the board.
And now, as we find ourselves at the rate plateau with no more FED rate hikes in the cards, the threat of job losses is likely behind us. America’s civilian labor force has never been bigger … and it has never been better paid. Even after adjusting for inflation.
Wage gains vs CPI
Wage gains in America have surpassed consumer price increases many times since the pandemic. And the gains are more sizable as inflation falls. This outcome is very beneficial to wage earners and is historically rare. More often wages barely keep up with inflation; often, they fall behind.
The chart below, courtesy of Statista, tells the story. Inflation as measured by the CPI is shown by the black line. The blue line shows the annualized rate of wage growth during each month:
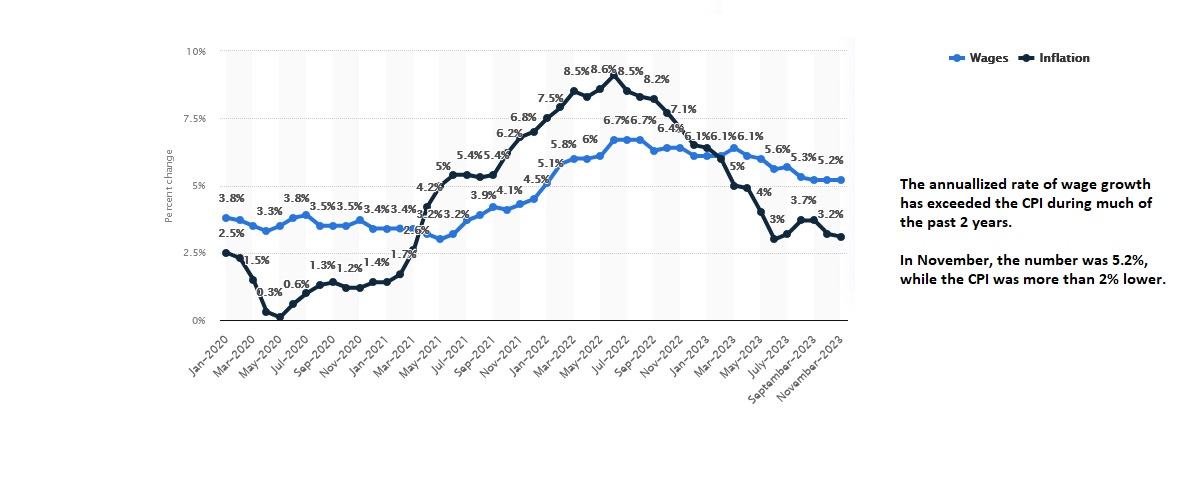
When compared to many periods in American history, Americans are well paid today. So once again, I ask our glum friend in the photo, why the long face?
Economic / GDP growth
In prior blog posts, I’ve talked repeatedly about how good the economy is performing, vis-à-vis GDP growth. Here’s the most recent chart, courtesy of the US Bureau of Economic Analysis:
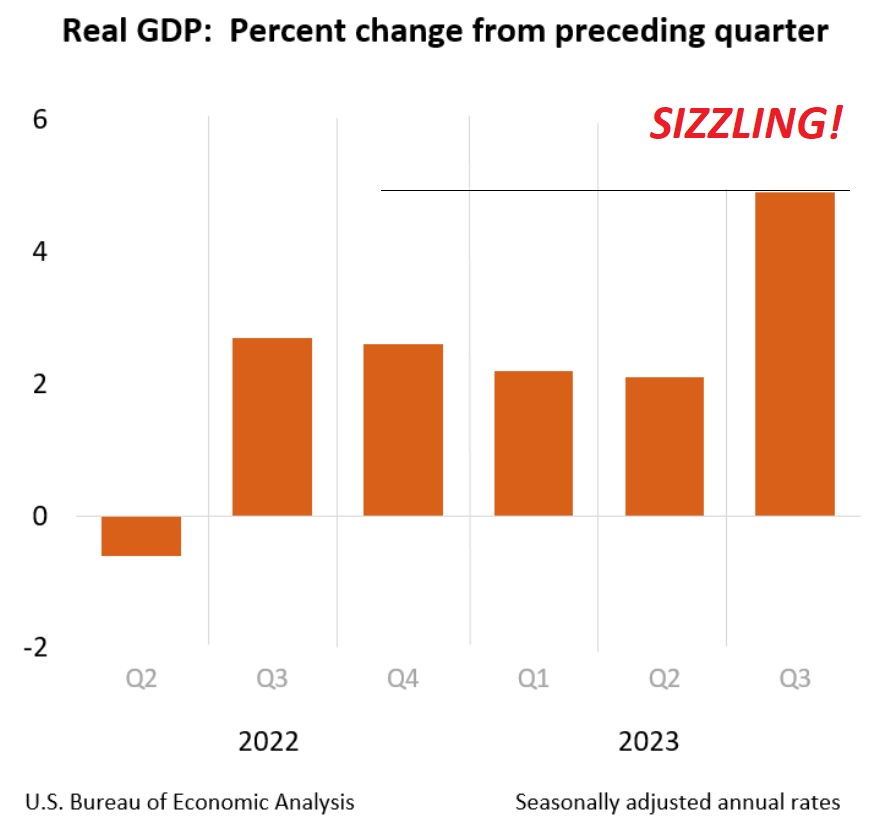
I’ve quoted other folks today … so now I’ll quote myself from a November, 2023 blog post:
“And then, in complete contrast, today’s Gross Domestic Product report actually increased the Q3 reading up to a 5.2% ‘real’ growth rate and an absolutely sizzling ‘current-dollar’ GDP increase of 8.9% on an annualized basis. That is a staggering, red-hot achievement. It’s worth repeating.
CURRENT DOLLAR GDP GREW AT THE ANNUALIZED RATE OF 8.9% IN Q3.
Staggering.”
GDP numbers today are much, much higher than just 5 years ago.
But perhaps our glum friend in the photo hasn’t participated in the huge GDP increase?
Not true, according to Macrotrends and their chart reflecting “US GDP per capita.” As you can see below, GDP per person has skyrocketed in recent years, following a consistent pattern:
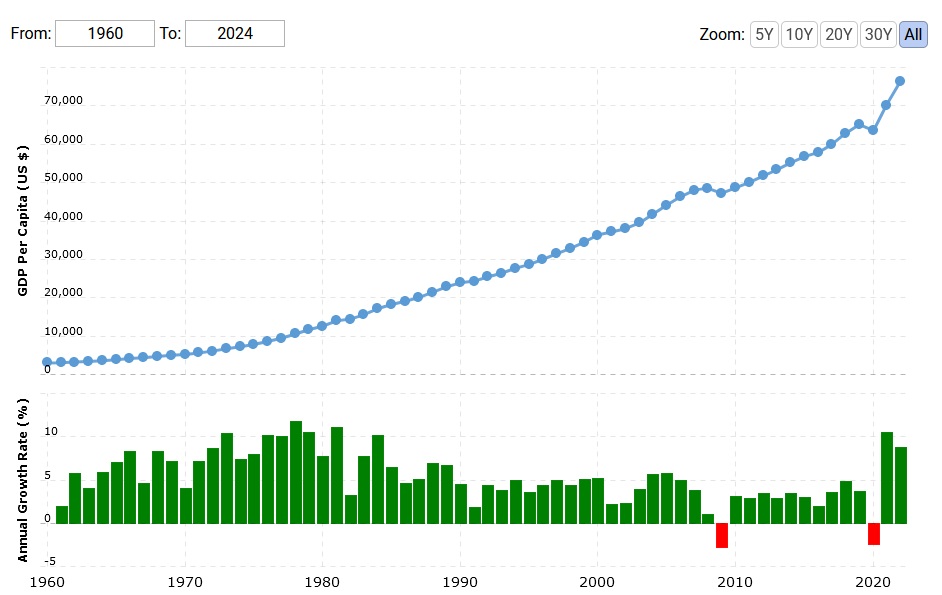
Amazingly enough, during only two years between 1960 and today did the GDP per capita, or per person, actually decline. The green bars at the bottom show the annual growth rates — in the past two years, the numbers are huge. No, GDP per person continues to reflects a very healthy economy for every American.
American Wealth
As I’ve mentioned in prior blogs, the FED produces a massive quarterly report called the ‘Z.1: Financial Accounts of the United States’ and a sub-heading entitled, “Flow of Funds, Balance Sheets, and Integrated Macroeconomic Accounts”. The report released in the 3rd quarter of 2023 was 207 pages in length.
So let me summarize: The ‘net worth’ of Americans, in the aggregate, is almost $151 trillion. Not total assets … actual net worth. Total assets exceed $171 trillion. For context, consider that our massive federal debt is about $34 trillion – about 23% of the entire net worth of all Americans combined. Let me be clear: The two statistics are unrelated. My intent here is to showcase just how massive this American net worth number is. In the aggregate, the net worth of all 332 million Americans combined is about 4X our national debt.
10 years ago, when 2013 ended, the American net worth number was about $81 trillion. Five years ago, the number was a little over $104 trillion. Most recently, $151 trillion. Which makes me wonder: Who could be unhappy with this amazing growth in net worth?
And perhaps within that question lies the answer. Yes, American’s in the aggregate are richer than ever. But wealth is held disproportionately.
According to Statista, the wealth distribution in America looked like this at the end of the 3rd quarter when the Z.1 report was published:
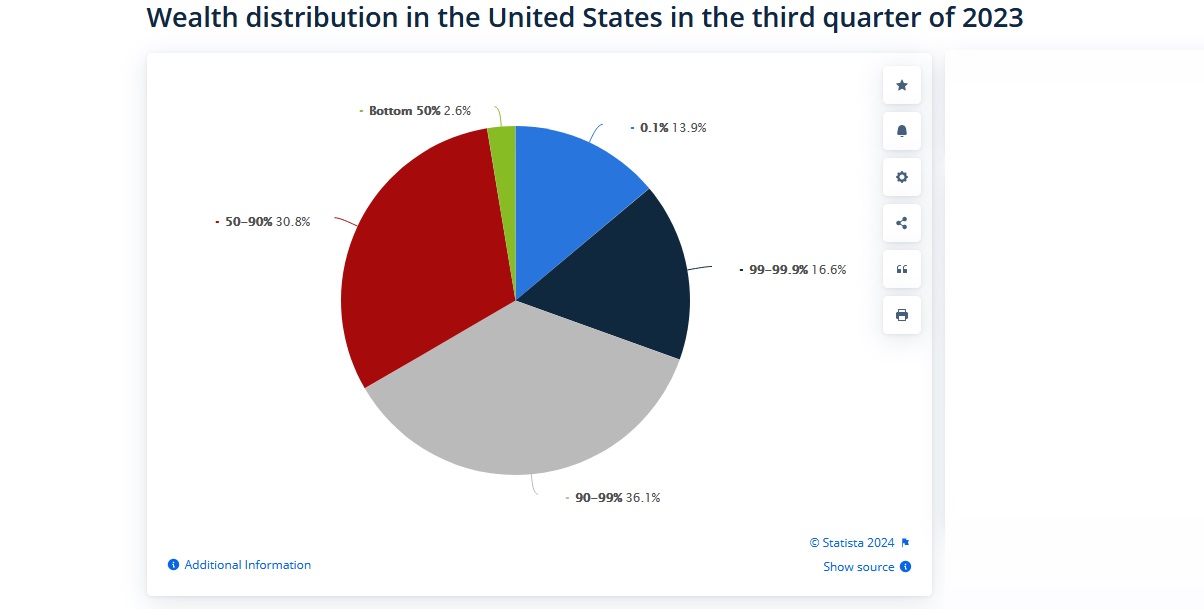
Per Statista, “In the third quarter of 2023, 66.6% of the total wealth in the United States was owned by the top 10% of earners. In comparison, the lowest 50% of earners only owned 2.6% of the total wealth.”
So … it would appear that 2/3 of all wealth in America is owned by the top 10% wage earners. But this is nothing new.
Financial / Stock markets
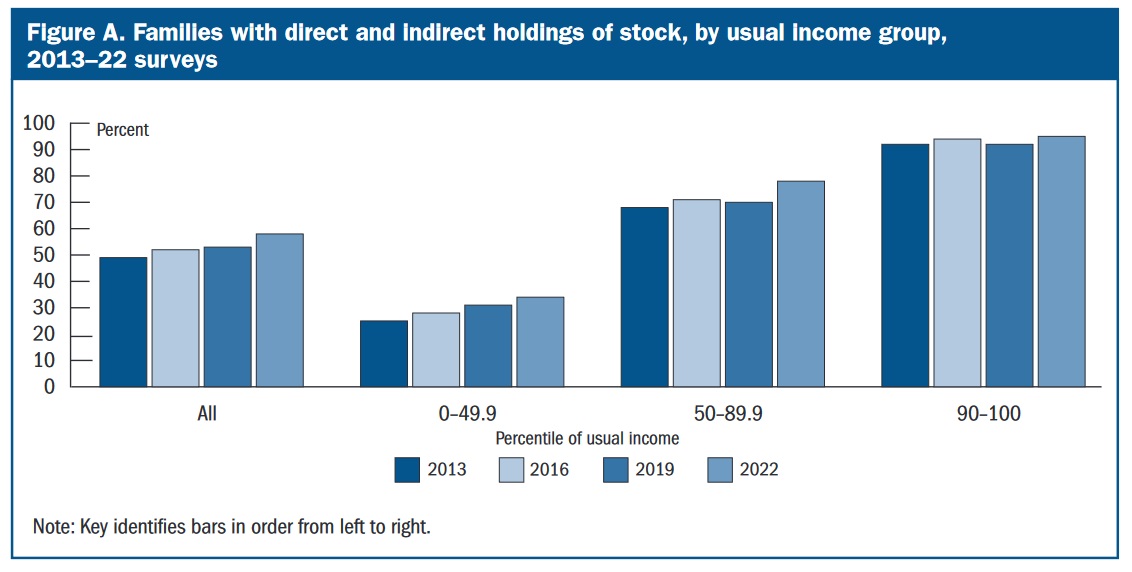
Now lets take a look at stock ownership. Consider this chart taken from the October, 2023 Survey of Consumer Finances from the FED entitled “Changes in U.S. Family Finances from 2019 to 2022.”
The report continued:
The Families may hold stocks through direct holdings and through indirect holdings, such as retirement accounts, which are usually less liquid than direct holdings. When direct and indirect stock holdings are combined, the 2022 survey showed a step-up in stock ownership to 58 percent, compared with 53 percent in 2019 and 52 percent in 2016 (figure A, left bars).
As in previous years, participation in the stock market in 2022 rose with usual income groups: 34 percent of families in the bottom half of the distribution held stock, compared with 78 percent of families in the upper-middle group and 95 percent of families in the top decile. All three of these groups increased participation between 2019 and 2022. The increase for the upper-middle income group was more than twice as large as for the other two groups, caused by an increase in the share of these families that have both direct and indirect stock holdings.
So, stock ownership is widespread today — up to 58% of Americans own stocks, either directly or thru a retirement account.
Does owning stocks make Americans unhappy?
I don’t think so. My guess is owning stocks generally makes folks quite happy.
Stocks have had quite a run, as the chart below, courtesy of Yardeni Research suggests:
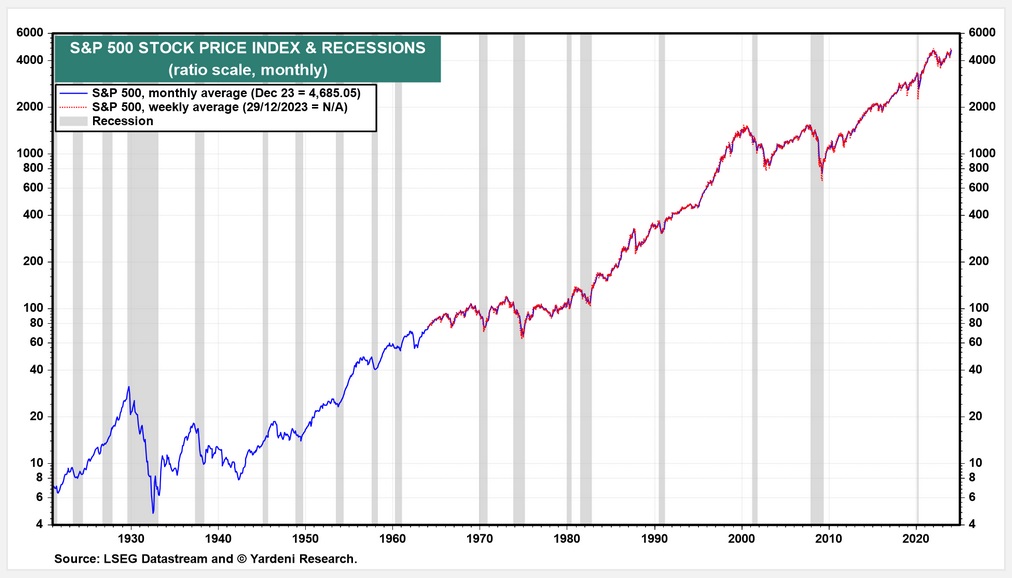
First, note that the chart is logarithmic – meaning while the line shows a linear increase, the increase is actually arithmetic. Look at the vertical markings: The vertical distance between each doubling is 1/2 the prior distance. Which means the shape of the graph actually understates the size of the actual value increase.
Second, note this chart shows essentially the entire history of the S&P index since inception more than 100 years ago. And therein lies the point: The S&P 500 index goes up over time. If you own and hold this index, you are making money.
And since more Americans than ever own stocks, they must be making money. So, let’s ask again: Why the unhappiness? Why do many, or even most, Americans feel the economy is bad?
Let’s see if the steakhouses are unhappy this week.
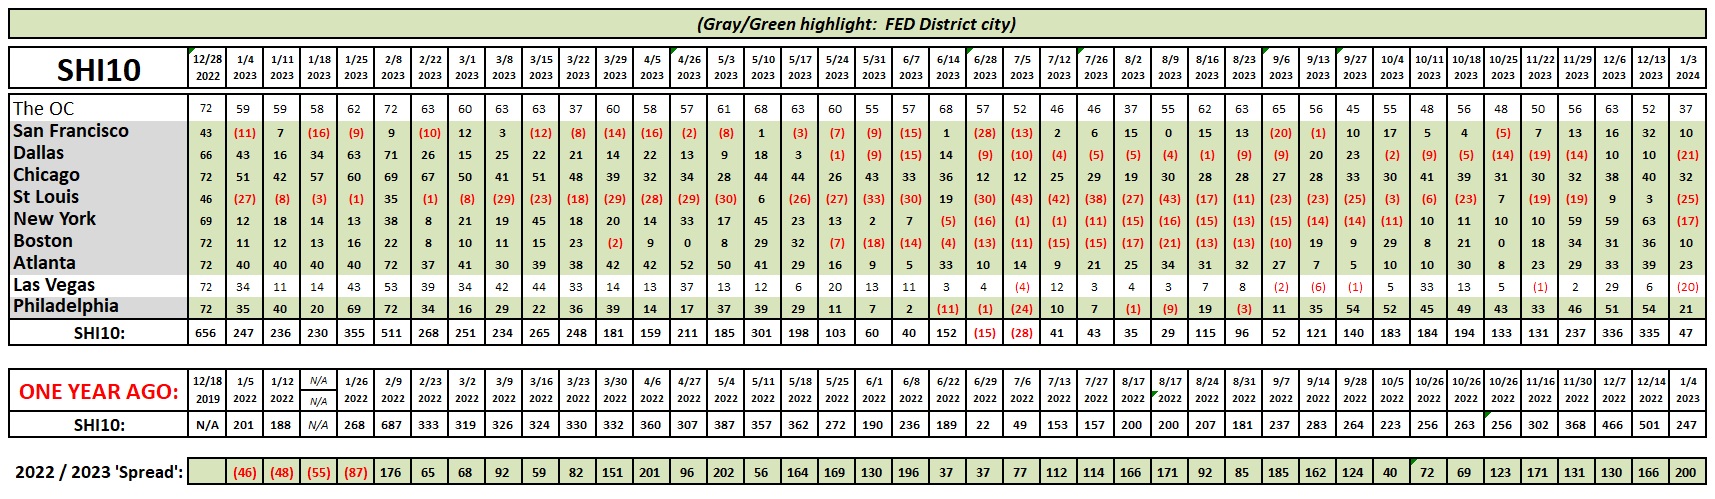
Well, this week’s SHI figures are definitely lower than last week. But that’s typical of the January ‘hangover’ we see every year. Take a look at the 1/4/23 column at the very left edge of the chart. Compare it to the week before. That was a HUGE DECLINE. We see the same type of decline in this first week of 2024. Again, this is typical. And the ‘spread’ has remained fairly consistent.
Nope, I suspect the steakhouses are relatively happy these days. They reflect a consistent demand and strong economy.
Economic Dissonance
I have no idea for the root cause of the dissonance. But I do have opinions. 🙂
Today more than ever before in history, information is instantaneous and ubiquitous.
Note I said ‘information.’ I did not say facts. Within all the noise, facts are harder to find today.
In his book entitled “Same as Ever: A Guide to What Never Changes,” Morgan Housel discusses this very issue. Our expectations determine our happiness level. Housel believes that many people have far higher expectations than in past generations.
“… social media today adds a new element, in which everyone in the world can see the lifestyles—often inflated, faked, and airbrushed—of other people. You compare yourself to your peers through a curated highlight reel of their lives, where positives are embellished and negatives are hidden from view. Psychologist Jonathan Haidt says people don’t really communicate on social media so much as they perform for one another. You see the cars other people drive, the homes they live in, the expensive schools they go to. The ability to say, I want that, why don’t I have that? Why does he get it but I don’t? is so much greater now than it was just a few generations ago.”
Charlie Munger, Warren Buffet’s partner of many decades, recently passed away just months shy of his 100th birthday. He was an impressive guy. Housel shared these comments on Munger in his book:
“When asked, “You seem extremely happy and content. What’s your secret to living a happy life?” ninety-eight-year-old Charlie Munger replied: The first rule of a happy life is low expectations. If you have unrealistic expectations you’re going to be miserable your whole life. You want to have reasonable expectations and take life’s results, good and bad, as they happen with a certain amount of stoicism.”
Low expectations. Interesting. Low expectations will lead to a happy life according to Charlie.
Could this be the explanation for today’s economic dissonance? As good as things are, do people “expect” their personal situation should be better when compared to what they see on Tiktok, X, and Facebook?
Perhaps. Interesting times, folks.
In the final analysis, however, it is my esteemed opinion that throughout history the incumbent President had little to do with overall economic vitality. Or economic weakness. No, they have little ability to move the needle here, but good or bad they tend to get the credit of the blame.
Today’s results are odd only because the economy is actually doing quite well. Yet folks say they are not happy with the economy. Odd. The divergence between perception and reality today is large, quite interesting, and to me, inexplicable. I have no doubt Biden’s advisors would agree.
Perhaps you can explain it to us? 🙂
<:> Terry Liebman


