
SHI 10.18.23 – Food and Drinking Places

SHI 10.11.23 – M2, Monetarists and MMT
October 12, 2023
SHI 10.25.23 – We Are Not Alone
October 26, 2023
‘OpenTable’ began putting butts in seats in 1998. Restaurant seats, of course.
Today, their network manages reservations for more than 50,000 restaurants worldwide, seating more than 1 billion diners per year. Clearly, with that footprint, they have a massive database – even bigger than the SHI! ? .
“
OpenTable is now global.”
“OpenTable is now global.”
Both the SHI and OpenTable are a great source of ‘alternative’ economic data, both providing an excellent window into consumer spending. As you know, about 70% of America’s GDP growth is driven by consumer spending. Retail sales is a big part of that metric, and the sub-component called “Food Services & Drinking Places” represent a primary data source. Tuesday morning, the Census Bureau released their most recent report on retail sales.
Once again, retail sales increased in the prior month. Retail sales rose 0.7% in September. Further, data for August was revised higher to show sales advancing 0.8% instead of 0.6% as previously reported. Year-over-year thru September, retail sales increased at the annual rate of 3.8%. This slow and steady increase is indicative of a solid and stable economy, one reflecting full employment and robust economic activity. Can the consumer keep this up? Will they continue to increase spending, month after month? Or are they feeling the pinch? And just how aligned is the SHI and the OpenTable data? Are they both singing the same tune?
Let’s take a closer look.
Welcome to this week’s Steak House Index update.
If you are new to my blog, or you need a refresher on the SHI10, or its objective and methodology, I suggest you open and read the original BLOG: https://www.steakhouseindex.com/move-over-big-mac-index-here-comes-the-steak-house-index/
Why You Should Care: The US economy and US dollar are the bedrock of the world’s economy.
But is the US economy expanding or contracting?
Expanding … FED rate increases notwithstanding! At the end of Q2, 2023, in ‘current-dollar‘ terms, US annual economic output rose to an annualized rate of $26.84 trillion. After enduring the fastest FED rate hike in over 40 years, America’s current-dollar GDP still increased at an annualized rate of 4.7% during the second quarter of 2023. Even the ‘real’ GDP growth rate was strong … clocking in at the annual rate of 2.4% during Q2. No wonder the FED is concerned.
The world’s annual GDP first grew to over $100 trillion in 2022. According to the IMF, in June of this year, current-dollar global GDP eclipsed $105 trillion! IMF forecasts call for global GDP to reach almost $135 trillion by 2028 — an increase of more than 28% in just 5 years.
America’s GDP remains around 25% of all global GDP. Collectively, the US, the European Common Market, and China generate about 70% of the global economic output. These are the 3 big, global players. They bear close scrutiny.
The objective of this blog is singular.
It attempts to predict the direction of our GDP ahead of official economic releases. Historically, ‘personal consumption expenditures,’ or PCE, has been the largest component of US GDP growth — typically about 2/3 of all GDP growth. In fact, the majority of all GDP increases (or declines) usually results from (increases or decreases in) consumer spending. Consumer spending is clearly a critical financial metric. In all likelihood, the most important financial metric. The Steak House Index focuses right here … on the “consumer spending” metric. I intend the SHI10 is to be predictive, anticipating where the economy is going – not where it’s been.
Taking action: Keep up with this weekly BLOG update. Not only will we cover the SHI and SHI10, but we’ll explore “fun” items of economic importance. Hopefully you find the discussion fun, too.
If the SHI10 index moves appreciably -– either showing massive improvement or significant declines –- indicating growing economic strength or a potential recession, we’ll discuss possible actions at that time.
The Blog:
‘Food Services & Drinking Places’ are great places for consumer spending. And the consumer definitely spends a lot on both eating and drinking.
The SHI10 is the metric we use to track eating and drinking at the most expensive steakhouses across the US. As you know, it is our proxy to measure consumer spending thru the lens of tracking the opulent dining-out habits of the most affluent quartile of the American consumer.
But how meaningful are the indications from our SHI10? I thought it might be time to revisit the ‘mother ship’ that is OpenTable and compare their analytics to SHI10 results. Check out the top graph, courtesy of OpenTable:
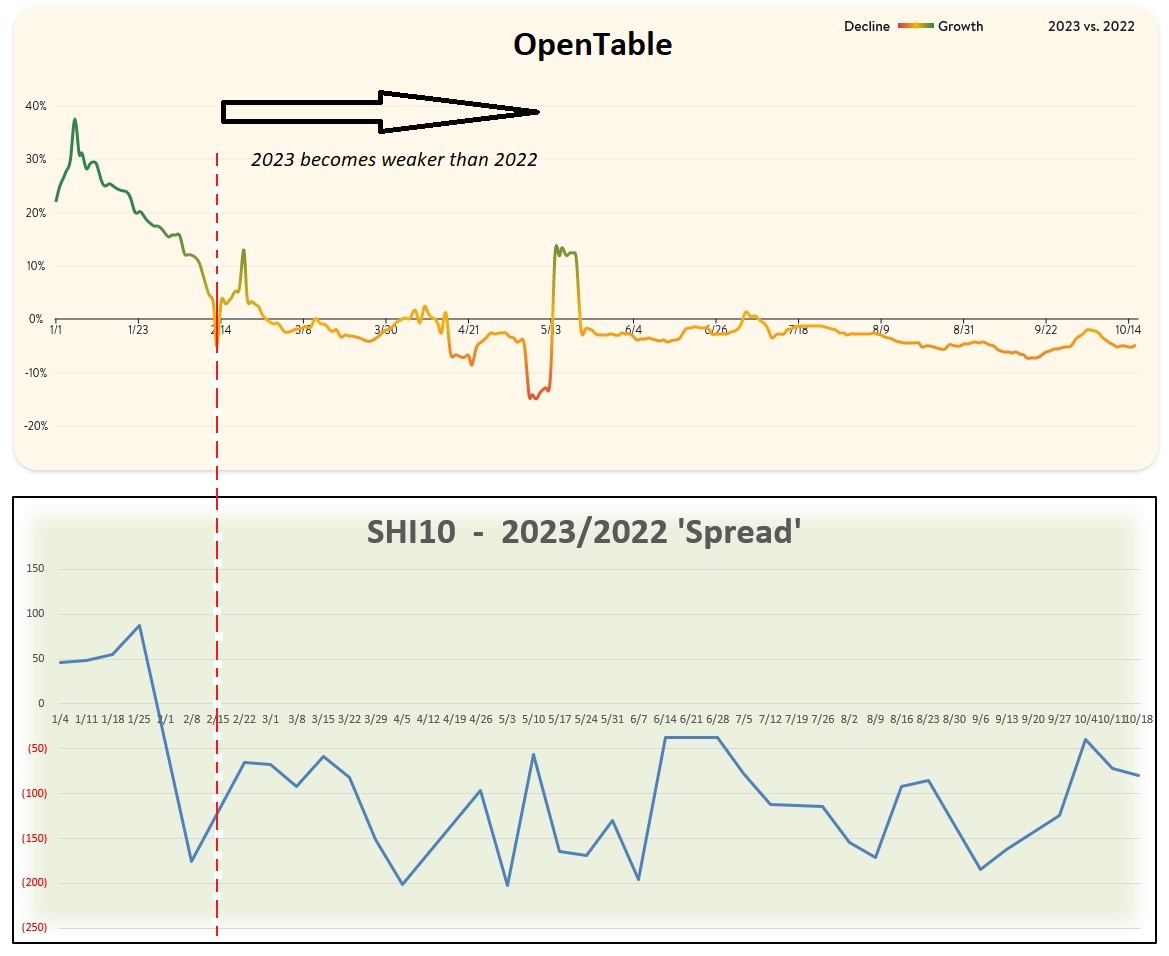
Again, the top graph is from the OpenTable website. Just like the SHI10, It measures weekly changes, in this case, specifically a year-over-year comparison of seated diners for 2023 vs. 2022. I’ve included the hyperlink to their site … there is a bunch of interesting data there. Including the interactive graphic where I clipped the above image. If you’re curious, take a look:
https://www.opentable.com/state-of-industry#fullbook-segment
The bottom graph is my creation, the product of our historic SHI data. More specifically, here I graph the ‘Spread’ between the 2023 and 2022 SHI10 readings, from January thru today.
You will notice that directionally, the two graphs are very, very similar. Both the OpenTable and SHI10 data suggests consumer spending in “food and drinking places” was much stronger during 2023’s first quarter. But since then, and for the balance of the year, both seated diners and expensive eatery reservation demand slid below that of 2022. I was pleased to see that consumer behavior in our little 40-restaurant group closely mirrors that of OpenTable’s much larger sample size. Once again, the SHI is validated! 🙂
I believe the sliding restaurant and reservation demand, post-Q1, reflects the bite high interest rates and higher prices are taking out of the consumer’s wallet. But the slide is small … and demand during much of this year has been fairly consistent. Clearly, the consumer faces some headwinds and credit card delinquencies are up in 2023.
Bank of America is one of the largest US banks reporting Q3, 2023 earnings. BAC is doing fine. They made plenty of money off you and me during the quarter: On quarterly revenues of $25.2 billion, net income rose to $7.8 billion for the quarter – up 10% from the prior quarter. Wow … by this metric, BAC generates about $100 billion in revenue each year. Wow.
BAC now pays 5% interest to us on some CD durations. This is way up from near zero just 2 years ago. Did this harm their “net interest income” (NII) for the quarter? Naaa. NII was up 4% from the previous quarter. They may be paying you and me more interest, but they are charging their borrowers even more. Every bank is. Trust me: Banks are ‘making bank’ right now.
But higher interest rates are definitely taking a bite out of the consumer. Consider this graph, courtesy of a FactSet report on BAC earnings:
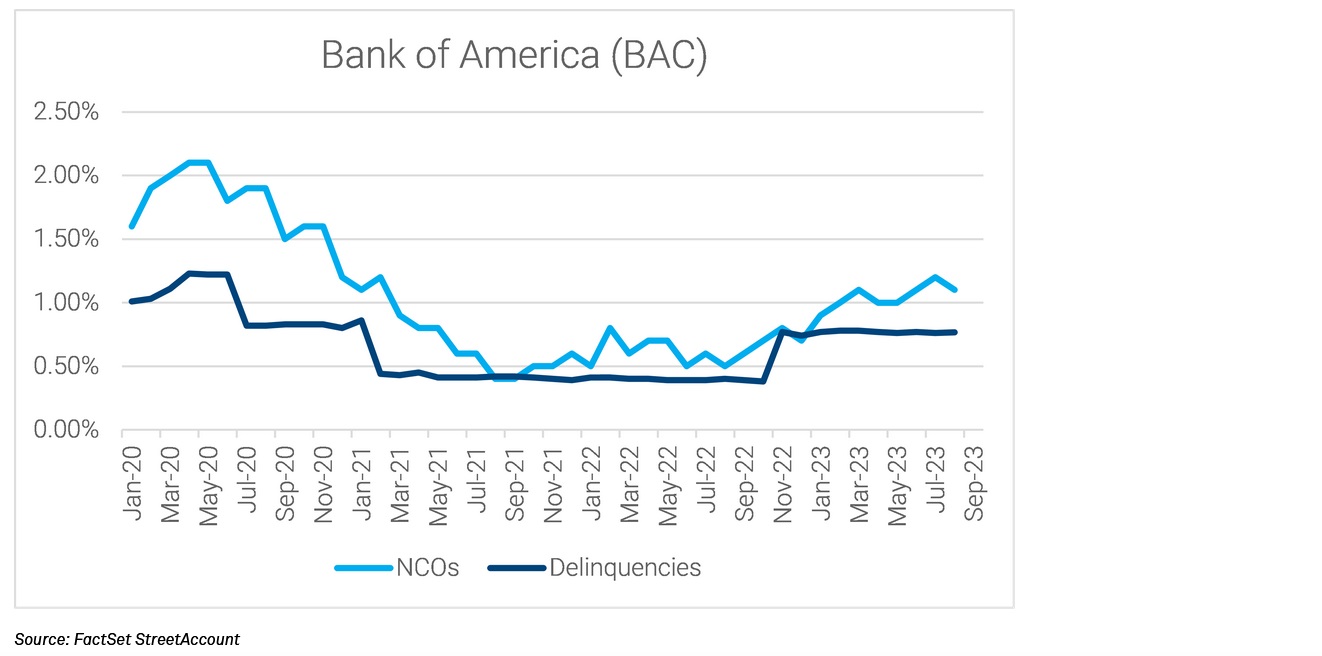
As you can see, credit card delinquencies are up. Slightly. Regardless, future direction looks clear. Up. Oh, by the way, “NCO” is an acronym for ‘Net Charge-Offs.” They are up, too.
Bank of America is huge enterprise, and so their consumer lending experience is indicative. But while the consumer might be straining under the load of higher rates and larger debt burdens, they remain employed at higher wage levels. Remember: At 3.8%, the US unemployment rate remains near 50-year lows. In September of 2022 – one year ago – precisely 158.850 million people were gainfully employed. In September of 2023, that number was up to 161.570 million. That’s not a huge increase – less than 2% in fact – but it is an increase. Employed people earn money and spend money. Even if higher interest rates are more oppressive.
Companies are straining under the higher interest rate burden as well. According to a recent report from Fitch, the credit rating agency, a number of “speculative-grade” borrowers have elected to “skip” their interest payments in the past month. Yes, companies can do that. For example, on October 2, WeWork skipped interest payments totaling $37.3 million. And more recently, Rite Aid filed for a Chapter 11 bankruptcy, due in part to the weight of their $1.38 billion of high-yield bond debt.
If interest rates do prove to stay “higher-for-longer” as many now expect, the impact on our economy will likely be reliant on what higher-for-longer actually means. How high is “higher” and how long is “longer?” Like the FED‘s pet-word “transitional” to describe inflation, the answer is it all depends on your definition. However, however you define the durations, there is plenty of evidence to suggest that the supply and demand relationship for US Treasury debt is strained right now. In the next 12 months, the US Treasury must not only refinance a large portion of the existing $33 trillion or so of public debt, it must also source about $3 trillion of new money so satisfy the combination of a $2 trillion 2024 (fiscal) US budget deficit and the shrinking FED balance sheet — probably at least another $1 trillion. Will this almost 10% increase in “supply” meet up with adequate “demand” at current interest rate levels? Or will new investors demand higher interest premiums? Time will tell … but this supply / demand imbalance is concerning.
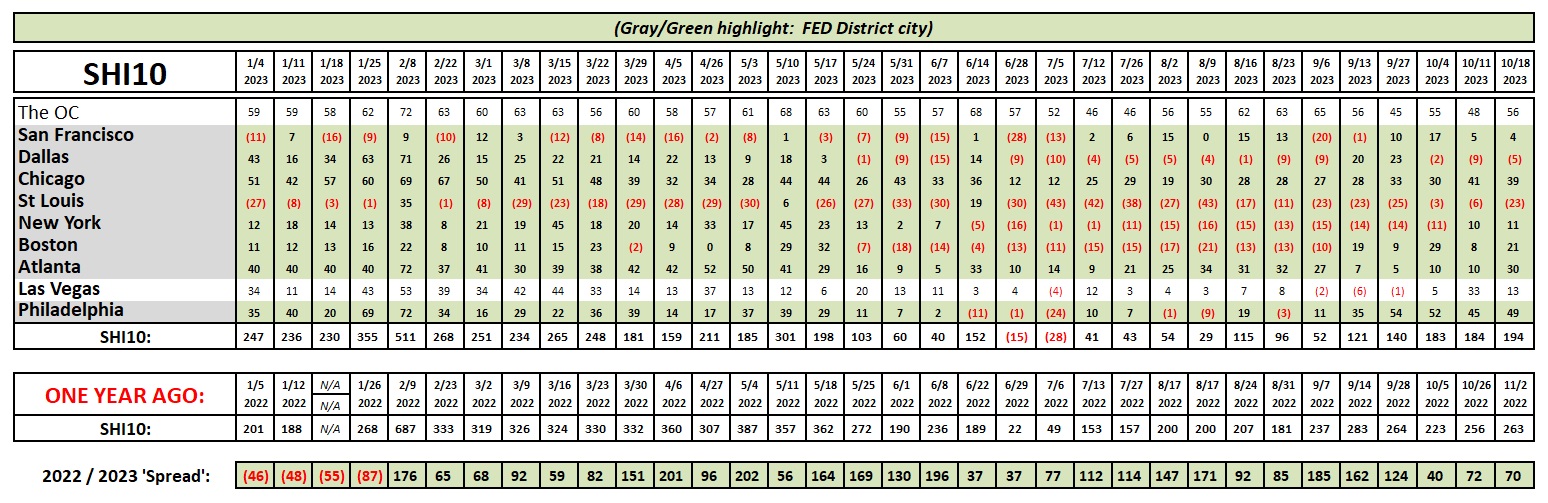
Let’s see how the steakhouses are doing this week.

Once again, the short answer is they are doing just fine … and the SHI is very consistent with prior weeks. Take a look:
Speaking of the national debt, if you’re looking for something else to worry about, take a look at this:
https://fiscaldata.treasury.gov/americas-finance-guide/national-debt/#the-national-debt-explained
This site and data are provided by the US Treasury. It’s accurate.
And speaking of the US government, earlier today the FED released their latest ‘Beige Book’ economic report. Here is their summary:
“Most Districts indicated little to no change in economic activity since the September report. Consumer spending was mixed, especially among general retailers and auto dealers, due to differences in prices and product offerings. Tourism activity continued to improve, although some Districts reported slight slowing in consumer travel, and a few Districts noted an uptick in business travel. Banking contacts reported slight to modest declines in loan demand. Consumer credit quality was generally described as stable or healthy, with delinquency rates still historically low but slightly increasing. Real estate conditions were little changed and the inventory of homes for sale remained low. Manufacturing activity was mixed, although contacts across multiple Districts noted an improving outlook for the sector. The near-term outlook for the economy was generally described as stable or having slightly weaker growth. Expectations of firms for which the holiday shopping season is an important driver of sales were mixed.”
Consistent. Like both the SHI and OpenTable suggest.
Thanks for tuning in.
<:> Terry Liebman


