
SHI 10.20.21 – Let the Good Times Roll!

SHI 10.13.21 – Coming Soon: A Housing Crash?
October 13, 2021
SHI 10.27.21 – Common Prosperity Crushes the Ant
October 27, 2021
Humans will forever face problems, obstacles and roadblocks. No doubt. They are endemic. But make no mistake: Economically speaking, these are the best of times.
“
Just look at corporate profits.“
“Just look at corporate profits.“
Paul Simon’s song title, “One Man’s Ceiling Is Another Man’s Floor,” always struck me as essential wisdom. One person’s ceiling is, indeed, someone else’s floor … so when I say these are the ‘best of times’ — for US corporations, in this case — you might suspect the opposite might be true for their customer? The American consumer? But you would be wrong … because of stimulus payments and Covid relief, consumers are feeling flush as well. Both facts suggest we have a solid floor under our economy, growing US economic vitality, and no ceiling! The sky’s the limit!
Welcome to this week’s Steak House Index update.
If you are new to my blog, or you need a refresher on the SHI10, or its objective and methodology, I suggest you open and read the original BLOG: https://www.steakhouseindex.com/move-over-big-mac-index-here-comes-the-steak-house-index/
Why You Should Care: The US economy and US dollar are the bedrock of the world’s economy.
But is the US economy expanding or contracting?
The short answer? Expanding. By a staggering measure. In fact, during Q1 and Q2, annualized 2021 ‘real’ growth averaged about 6.4%. In nominal terms, our US economy averaged almost 12% growth — adding $1.245 trillion of economic activity during the first half of the year. The world’s annual GDP is expect to end 2021 near about $93 trillion. Annualized, America’s GDP settling in at almost $23 trillion by mid-year — still around 25% of all global GDP. Collectively, the US, the euro zone, and China still generate about 70% of the global economic output. These are your big players.
The objective of this blog is singular.
It attempts to predict the direction of our GDP ahead of official economic releases. Historically, ‘personal consumption expenditures,’ or PCE, has been the largest component of US GDP growth — typically about 2/3 of all GDP growth. In fact, the majority of all GDP increases (or declines) usually results from (increases or decreases in) consumer spending. Consumer spending is clearly a critical financial metric. In all likelihood, the most important financial metric. The Steak House Index focuses right here … on the “consumer spending” metric. I intend the SHI10 is to be predictive, anticipating where the economy is going – not where it’s been.
Taking action: Keep up with this weekly BLOG update. Not only will we cover the SHI and SHI10, but we’ll explore “fun” items of economic importance. Hopefully you find the discussion fun, too.
If the SHI10 index moves appreciably -– either showing massive improvement or significant declines –- indicating growing economic strength or a potential recession, we’ll discuss possible actions at that time.
The Blog:
Corporate profits. These are the product of America’s economic machinery, and they fuel our stock markets. They are the “E” in the S&P 500 P/E ratio. And they are the “E” in Professor Shiller’s CAPE ratio. Corporate earnings are an essential and absolutely critical component of our capitalist system. And corporate profits way up, post-pandemic. And I mean WAY up:
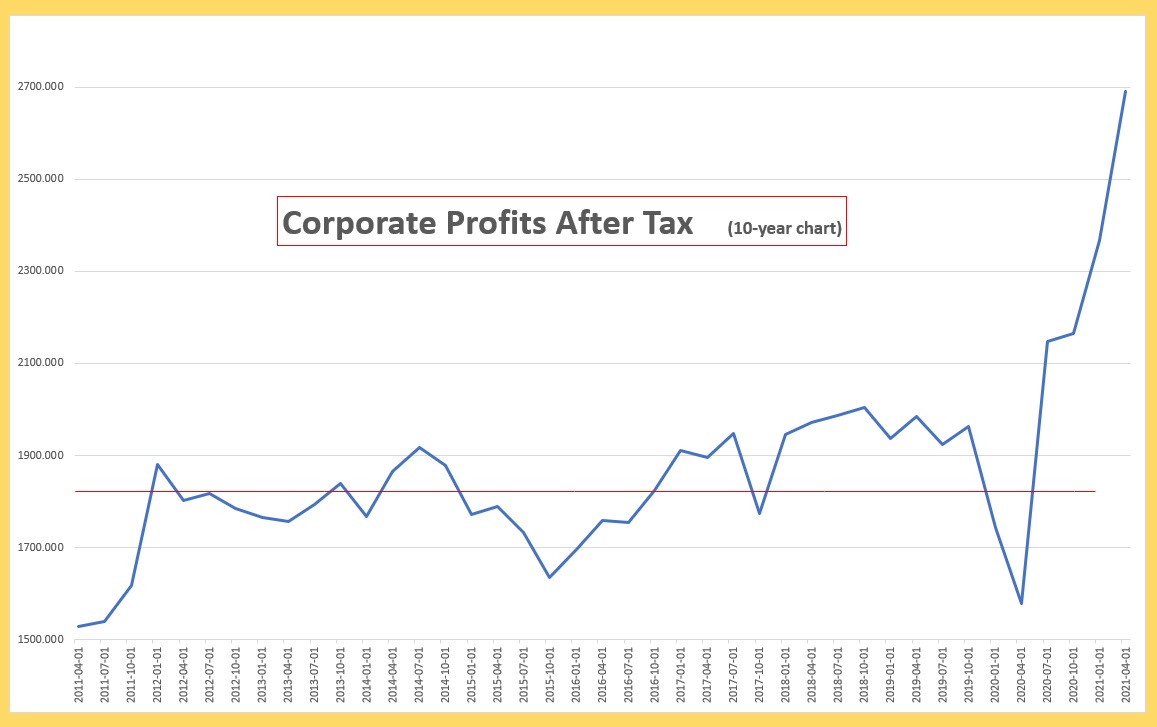
This is a 10-year chart. The red line estimates the annual average over the prior 10-years. Clearly the recent numbers are far above the historical averages.
Did you notice this is an “after tax” number? It is. Which begs the question: Did the reduction of the corporate tax rate from 35% to 21% help boost corporate profits? Logic would dictate yes. That same logic would further suggest that the corporate “benefit” of the lower corporate tax rate translates to a tax “detriment” to the US Treasury. In other words, you might suspect the improved corporate profits are the result of less income into the treasury. The lower 21% tax rate, in theory, translates into lower tax collections.
You may be surprised to learn this is untrue. Surprisingly enough, tax collections are up. In fact, according to an October 8th report by the Congressional Budget Office, tax collections are up. WAY up. Far beyond my expection, in fact. Preliminary estimate for FY 2021 tax collections suggest:
-
——> Total ‘Corporate Income Taxes’ are up almost 75% over the prior year.
-
——> Individual Income Taxes are up 27.5%.
The CBO expects corporate income taxes are expected to increase by $150 billion during FY 2021. And they expect individual income taxes to increase increase by $443 billion during 2021. Sure, tax rates are lower, but collections are up significantly. In fact, 2021 corporate tax collections are expected to eclipse every year since 2006. Here is the CBO chart:

Here’s an impressive quote from the CBO:
“Receipts totaled $4,047 billion during fiscal year 2021, CBO estimates—$627 billion more than during the same period last year.”
That is a staggering increase in Treasury collections. From just a bit over $3.4 trillion just two years ago … to over $4 trillion today. Amazing. Of course, the federal budget story doesn’t end there, so permit me a final observation: Per the CBO, “outlays,” or money spent, in FY 2021 will also exceed all prior records. Preliminary estimates are for $6,817 billion in spending in FY 2021, which amount includes many Covid related expenses or costs, such as the “Coronavirus Relief Fund,” will will cost $243 billion and (federal) unemployment compensation of almost $400 billion. Both these figures were close to zero in FY 2019. As a result of these additional expenditures, it stands to reason that US national debt will increase commensurately. Covid has been very expensive for the US Treasury:
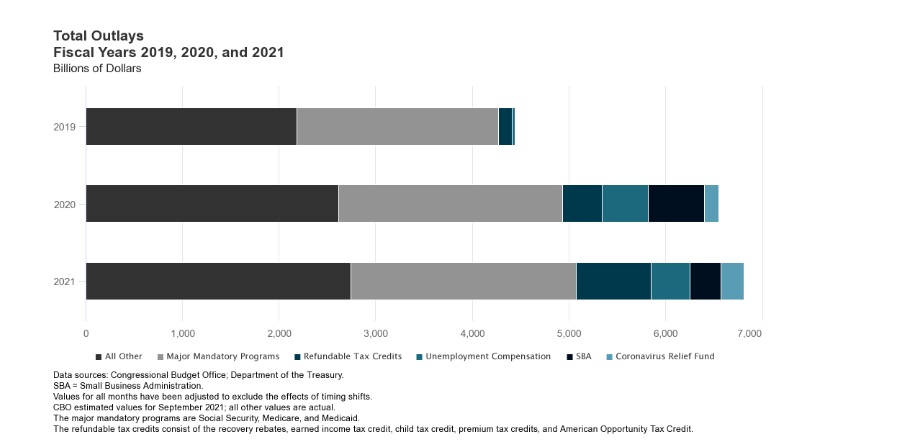
Fortunately our historically low interest rates are holding the “Net Interest on the Public Debt” in check. 2021 interest expense is expected to be lower than 2019: $413 billion compared to $423 billion in 2019. That’s nice! 🙂
Let’s return to the corporate profits discussion: The lower corporate tax rate is most assuredly a tailwind for big companies … but even after sending the Treasury $158 billion more than last year, profitability after tax is rising. As I mentioned earlier, corporate profits — in the aggregate — have exceeded FY 2021 only one time previously, and that was more than 15 years ago. Will future corporate profit growth continue to accelerate? I believe they will. Of course, at the same time, higher labor and commodity costs, and supply chain disruptions, are certainly headwinds for many companies. But for the first time in more than a decade, companies seem to have the ability to pass those cost increases thru to their customers. The economic term is “pricing power” and for the first time in years, companies appear to have it. We’ll have to wait and see how it all shakes out, but headwinds aside, corporate profits appear to be heading up.
Have you been wondering why the DJIA and S&P500 have continued to rise? Take another look at the corporate profits chart above. The markets have followed a similar pattern because of the high correlation — and causal relationship — between corporate earnings and stock valuation. Reading the ‘tea leaves’ I will repeat that I expect future corporate profit growth will continue unabated … which suggests further stock value increases are likely.
Consumer spending, too, is way up. Less than a week ago, the Commerce Department of the US Census Bureau reported the following:
“U.S. retail and food services sales for September 2021 were $625.4 billion, an increase of 0.7% from the previous month, and 13.9% above September 2020.”
Again, this is a sizable increase, likely the result of the pent-up consumer demand and the consumer’s chubby bank account, the benefactor of our federal government’s pandemic response payments. You’re probably thinking “hold on, Terry!,” retail sales in September of 2020 must have been depressed because of the pandemic. After all, few people were traveling, going to restaurants, enjoying AMC theaters, etc. Nope. Wrong. In September of 2019, retail Sales were about $522 billion. One year later, in the middle of the pandemic, September of 2020, retail sales eclipsed $549 billion — more than 5% higher than the pre-pandemic prior year. Here’s a bit more data from the Commerce Department report:
-
——> Total sales for the July 2021 through September 2021 period were up 14.9%.
-
——> Retail trade sales were up 12.2% percent above last year.
-
——> Food services and drinking places were up 29.5% percent from last year.
Sure, the global supply chain is struggling right now. This is a fact. But struggles, obstacles and roadblocks aside, US import volumes are soaring. Believe it or not, our ports are unloading record numbers of goods. According to S&P Global:
“The US import volume for August is forecast at 2.37 million twenty-foot equivalent units, the the highest monthly count since the National Retail Federation began tracking imports in 2002. The previous record was in May at 2.33 million TEUs before import volumes eased to 2.15 million TEUs in June and are projected at 2.22 million TEUs for July.”
Did you know that 40% of all US “seaborne imports” arrive thru the ports of LA and Long Beach? Yep — 40%. Amazing, right? The new 24-hour/7-day per week schedule should lift the numbers even higher. (According to CBS news, on Monday 62 ships were berthed at the two ports and 81 were waiting to dock and unload.) Bottlenecks are likely to persist, but this change should help immensely. I expect TEU volume to grow as a direct result. Of course, port congestion is not the only challenge. A chain is only as strong as its weakest link, and as we’ve discussed previously the capacity within the import system is severely strained. So, once again, we’ll have to watch for other capacity solutions over time.
Make no mistake, headwinds and obstacles abound. The media reminds us every day of how hard it is out there. But the resilience of the consumer and the corporation are even more impressive as a result. In spite of all the challenges, both are doing exceptionally well.
Shall we head to the steak houses? Let’s see if Saturday night expensive eatery reservations are selling as well as used cars.
With an SHI10 reading of 373, reservations this week remain in high demand:
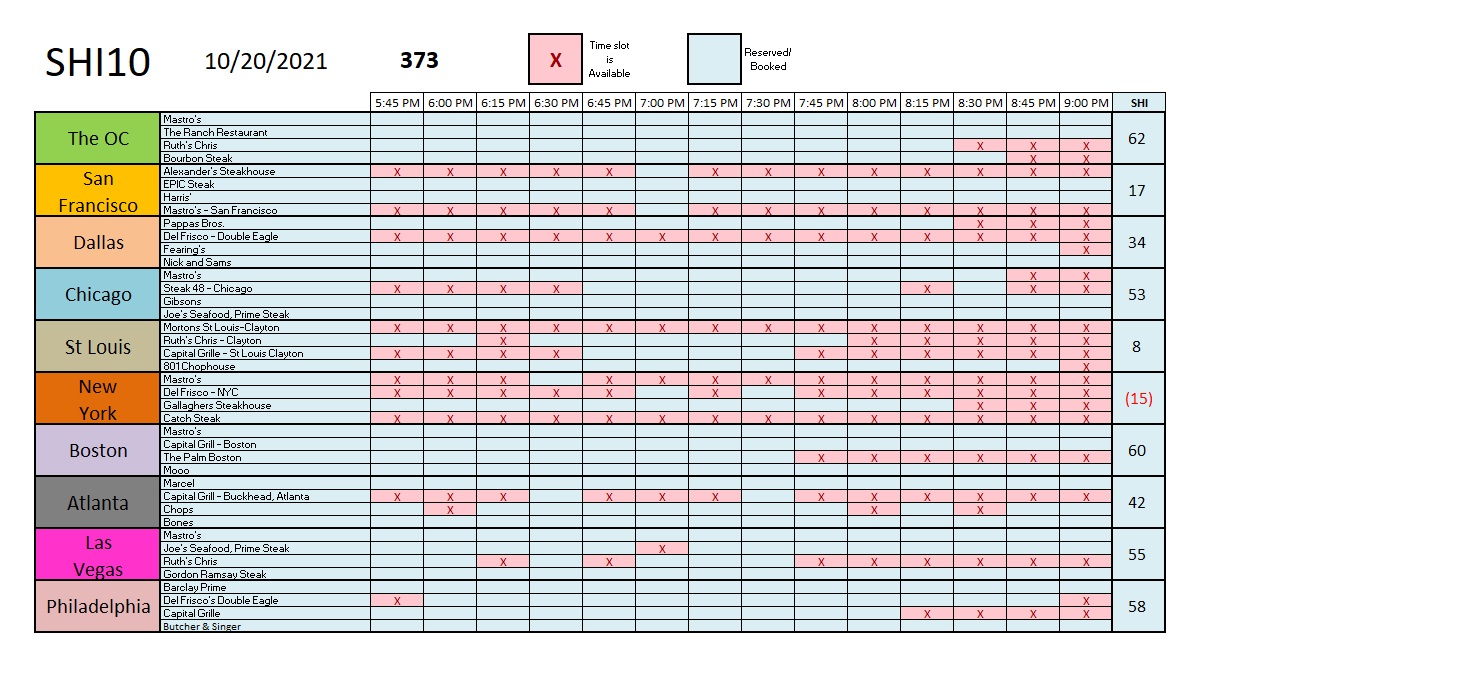
NYC seems to have regressed, for some reason, but you may recall that over the years NYC always appears to have excess steakhouse capacity. Bostonians, on the other hand, clearly have a hankering for a high-quality, expensive steak this weekend. Their SHI reading of 60 is the highest we’ve seen in that city in about a month. Here is the longer term trend report:

The trend report suggests consistent reservation demand for next Saturday. Readings for the past 3 weeks are surprisingly consistent. The steakhouses are busy. Consumers are spending money in expensive restaurants.
I’ll finish today’s blog with these thoughts: The holiday season begins at the end of the month. According to Guesty, a ‘vacation rental platform,’ Thanksgiving reservation demand is up by 302% over last year … and Christmas reservation volume across the US is up 459% compared to 2020 volume. And it is currently 157% higher than 2019.
The consumer is flush with cash. Supply chain crimps are real, but the consumer is spending regardless, when possible. Exceptionally strong consumer spending suggest this holiday season will be both expensive and “sold out.” If there’s something you want to own, gift or do, to minimize disappointment I suggest you make plans and take action sooner than later. I believe Christmas is only 66 days away!
But make no mistake: Like the steakhouses, our economy is cooking … and corporate profits are uncontrovertible proof.
<:> Terry Liebman


