
SHI 11.07.18 Good News? Bad News?

SHI 10.31.18 So Good its SPOOKY!
October 31, 2018
SHI 11.14.18 – Eat at Mastro’s
November 14, 2018
“People are working, and GDP is way up. So the Treasury will collect more taxes. A good thing, because the Treasury is now paying a lot more interest on US debt.”
In the 12 months, thru Q3, 2018, US gross domestic product increased by $1,071 billion. Rest assured, this is a staggering number. Phenomenal, really. That’s about a 5.5% (nominal) increase in GDP … in a 12 month period.
So, GDP increased by almost $1.1 trillion. If historical relationships hold, about 18-19% of this number will be collected by the Treasury in additional taxes. Let’s call it $200 billion per year of additional tax revenue to the Treasury. Further, the ‘personal income’ of all Americans continue to increase at a steady clip … and the resultant income taxes further line Treasury coffers.
And these are good things … because the Treasury’s annual interest expense is soaring. The result of — you guessed it! — FED rate increases. Yes, the Treasury can really use the extra money.
Welcome to this week’s Steak House Index update.
If you are new to my blog, or you need a refresher on the SHI10, or its objective and methodology, I suggest you open and read the original BLOG: https://www.steakhouseindex.com/move-over-big-mac-index-here-comes-the-steak-house-index/
Why You Should Care: The US economy and US dollar are the bedrock of the world’s economy. This has been the case for decades … and will continue to be true for years to come.
Is the US economy expanding or contracting?
According to the IMF (the ‘International Monetary Fund’), the world’s annual GDP is about $80 trillion today. US ‘current dollar’ GDP now exceeds $20.66 trillion. In Q3 of 2018, nominal GDP grew by 4.9%. We remain about 25% of global GDP. Other than China — a distant second at around $11 trillion — the GDP of no other country is close.
The objective of the SHI10 and this blog is simple: To predict US GDP movement ahead of official economic releases — an important objective since BEA (the ‘Bureau of Economic Analysis’) gross domestic product data is outdated the day it’s released. Historically, ‘personal consumption expenditures,’ or PCE, has been the largest component of US GDP growth — typically about 2/3 of all GDP growth. In fact, the majority of all GDP increases (or declines) usually results from (increases or decreases in) consumer spending. Consumer spending is clearly a critical financial metric. In all likelihood, the most important financial metric. The Steak House Index focuses right here … on the “consumer spending” metric. I intend the SHI10 is to be predictive, anticipating where the economy is going – not where it’s been.
Taking action: Keep up with this weekly BLOG update. Not only will we cover the SHI and SHI10, but we’ll explore related items of economic importance.
If the SHI10 index moves appreciably -– either showing massive improvement or significant declines –- indicating growing economic strength or a potential recession, we’ll discuss possible actions at that time.
The BLOG:
In ‘fiscal year’ 2015, the Treasury paid out a skosh over $400 billion in interest. In the most recent fiscal year — 2018 — that number grew to about $523 billion. An increase of about $120 billion per year. What caused the increase? A combination of (1) interest rate increases by the FED, and (2) the increased level of outstanding US debt. How much does the US currently owe, you ask? Take a look below, courtesy of the US Treasury:
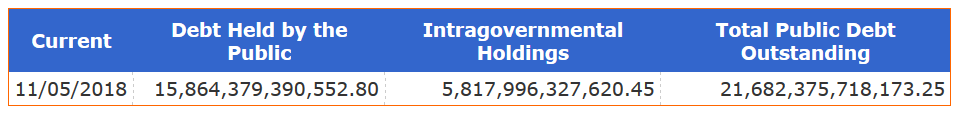
The Treasury pays interest on the total. Quite a number, right? And so is the total public debt outstanding. In fact, using that figure, the US “debt-to-GDP” number is now about 105%. How does this figure compare to other developed nations? Let’s take a look:
- Japan: 220%
- Portugal: 138%
- Italy: 138%
- France: 97%
- United Kingdom: 87%
- Germany: 64%
If we base the calculation on ‘public debt outstanding,’ the ratio is closer to 75.8%. But no matter how you slice the pie (see that … food metaphors are starting already), that’s a lot of debt. And it’s growing. Rather quickly, unfortunately.
The Congressional Budget Office (CBO) is tasked with tracking this kind of stuff. Here’s a chart from their website:
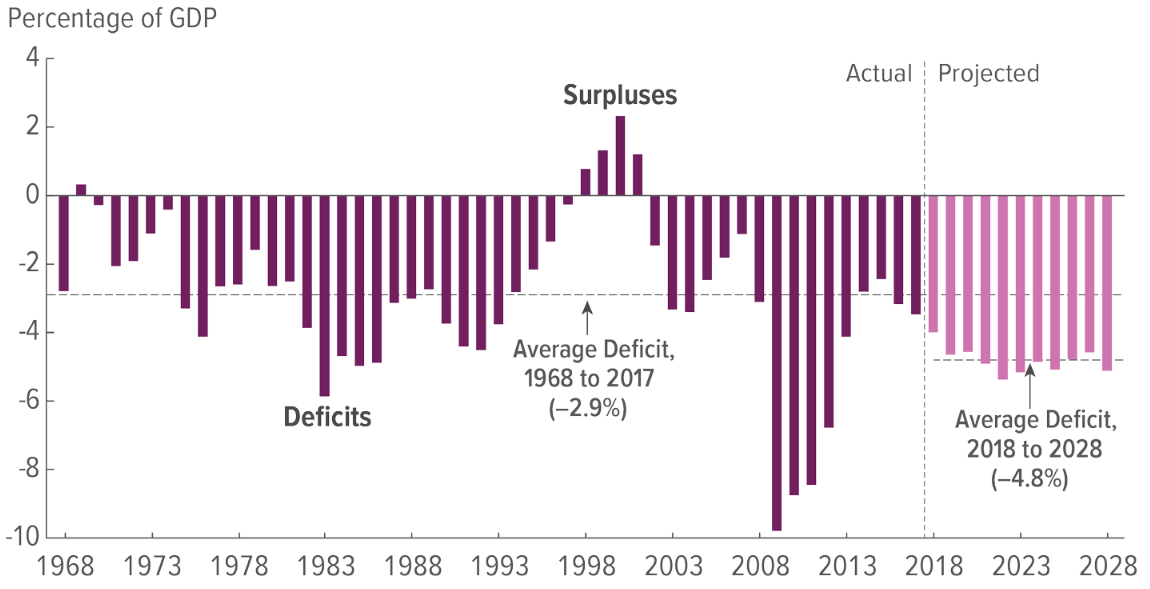
A surplus? Yes, there was a time when the US Treasury took in more than it spent. Back around the turn of the century. But every year since that time, the Treasury has spent more than it collected. During the “Great Recession,” receipts fell and spending increased, resulting in a massive annual spending deficit. And the forecast for the next 10 years doesn’t look very appetizing, either. Here is a summary of the CBO forecast methodology:
“As required by statute, when constructing its baseline projections, CBO incorporates the assumption that current laws governing taxes and spending will generally remain unchanged in future years. Under that assumption, in CBO’s baseline, federal deficits average $1.2 trillion per year and total $12.4 trillion over the 2019–2028 period. As a percentage of gross domestic product (GDP), the deficit increases from 3.5 percent in 2017 to 5.4 percent in 2022.”
Those are some serious deficits. In fact, the CBO forecasts the debt/GDP ratio will increase by 18% by 2028. To the highest level since WW2. And, I’m sorry to report, this forecast assumes no recession at any time during the next 10 years. If the US entered a recession, all bets are off. Take another look at the size of the deficits during the “Great Recession.” Yes, both annual deficits and the total debt owed are likely increase even quicker than this forecast. A recession within the next 10 years is a near certainty.
Now I’ve completely lost my appetite.
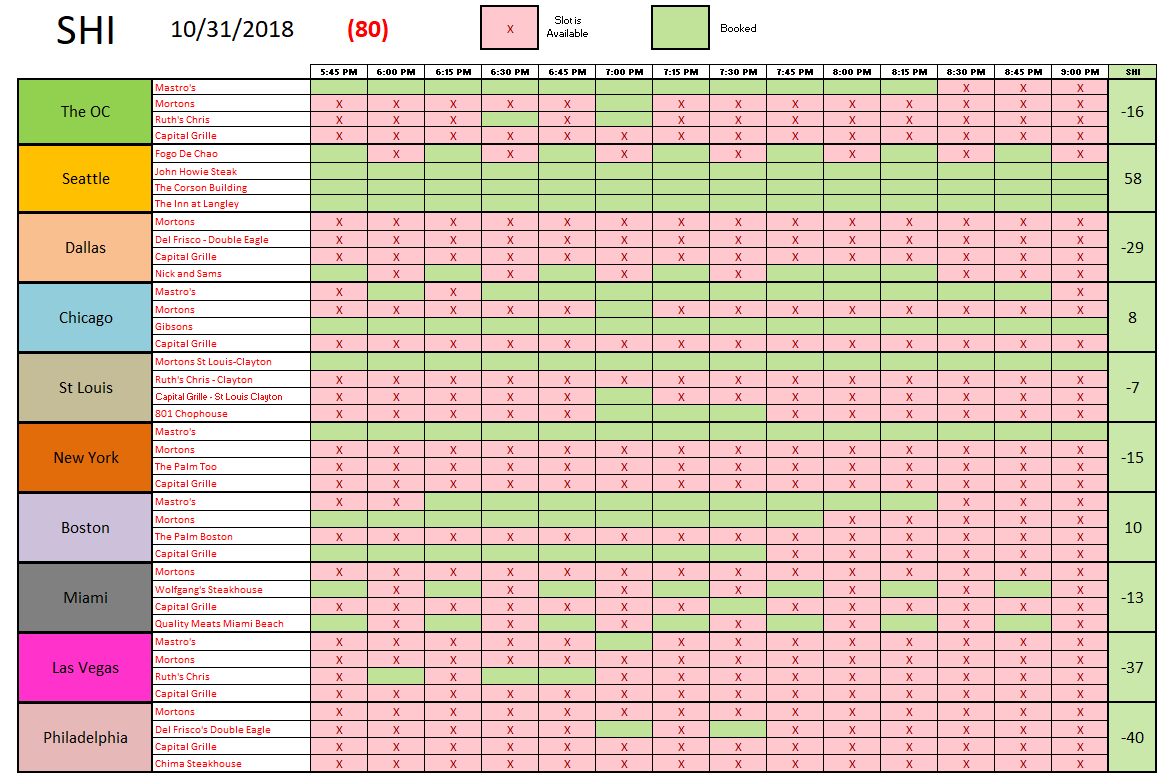
Let’s talk about something a bit tastier: STEAKHOUSES! And their fabulous, sizzling, cooked-to-perfection, extremely expensive steaks! How are they performing this week? Let’s take a peek:
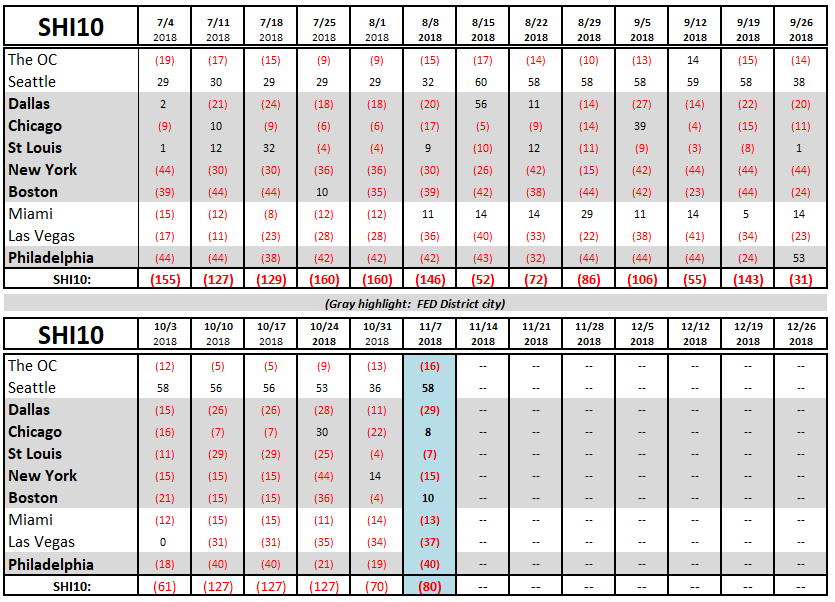
Steaks are sizzling! Seattle has regained its prominence, the Chicago packing houses must be busy, and Boston is back in the black. The SHI10 reading of a <-80>, by historic perspective, is pretty strong. More of a Limburger than a cheddar. More of a durian than a kiwi. More balsamic vinegar than virgin olive oil. And, of course, my metaphors are more of an irritant than beneficial. Sorry about that. 🙂
Let’s take a look at this weeks SHI10 readings:
Earlier today, I was asked why the markets are up significantly today, following yesterday’s mid-term elections.
The simple answer: Investors appear to feel legislative gridlock is a good thing. With democrats running the House, and the republicans controlling the Senate, markets seem to believe not much will change. So, more of the same, apparently, is a good thing. Gridlock.
Of course, “more of the same” cannot, unfortunately, apply to the US economy. Ahhh…were it only that easy. No, unfortunately, FED rate increases are adding monthly cost to individuals, businesses, corporations, state governments and the federal government. Month after month.
Fixed rate debt is not affected by short-term rate increases. Only variable rate debt, and new debt, cost more now. Over time, the sheer weight of the increased interest bill takes its toll on the economy. GDP will slow. When? Not now. So stay tuned. But the weight is piling up.
This is no bull. 🙂
– Terry Liebman


