
SHI 11.18.2020: Is Run-a-way Inflation Here?

SHI 11.11.2020: Financial Stability Report
November 11, 2020
SHI 11.25.2020: Gobble!
November 25, 2020
Inflation is now, and has always been, a wild and unpredictable beast. It has been with us since the beginning of recorded human history. In fact, I would argue, inflation and humanity are joined at the hip: To desire more, and thereby cause inflation, is inherently human. What caveman didn’t wish for a more bountiful hunt each time the tribe sought food to sustain the tribe thru the winter? What farmer didn’t hope for a more bountiful harvest, or a better price for the crop, to improve the lot of his or her family? No, over the eons, the consistent human desire for MORE has proven endemic. It has always been and will always be.
But as our species has evolved, we have sought to tame this beast just as we have tamed many in nature. The goal to tame inflation, so that it generally benefits humanity, is where where the topic morphs from a sociological observation to an economic issue. And as we are economists (yes you are!) it’s important for us to ask:
Will the massive fiscal and monetary stimulus unleashed to help mitigate financial suffering from COVID release the beast, setting this monster free to roam our global economy, causing pain and destruction wherever it wishes?
The question must be asked today. Especially given what’s happened to the US money supply in the past 6 months. Consider these facts:
-
<> In the almost 40 years between 1981 and 2019, the broadest measure of US money supply known as M2 grew at an average annual rate of 5.9%.
-
<> In just 6 months — since April of 2020 — M2 has grown at the annualized rate of almost 26%.
In fact, measured in dollars, M2 has increased by $2.88 trillion — an 18% increase in money supply! In just 6 months!
“
Inflation is, and always has been,
a wild, unpredictable beast.”
“
Inflation is, and always has been,
a wild, unpredictable beast.”
This is a staggering increase. Do we have a problem here? Have our 2020 fiscal and monetary policies unleashed the inflation monster?
Welcome to this week’s Steak House Index update.
If you are new to my blog, or you need a refresher on the SHI10, or its objective and methodology, I suggest you open and read the original BLOG: https://www.steakhouseindex.com/move-over-big-mac-index-here-comes-the-steak-house-index/
Why You Should Care: The US economy and US dollar are the bedrock of the world’s economy.
But is the US economy expanding or contracting?
Before COVID-19, the world’s annual GDP was collectively about $85 trillion. Then it shrank … then bounced back! We can thank global fiscal and monetary policy for the bounce. According the the Q3, 2020 ‘preliminary’ numbers, annual US GDP is back UP to about $21.1 trillion. And still, together, the U.S., the EU and China continue to generate about 70% of the global economic output.
The objective of this blog is singular.
It attempts to predict the direction of our GDP ahead of official economic releases. Historically, ‘personal consumption expenditures,’ or PCE, has been the largest component of US GDP growth — typically about 2/3 of all GDP growth. In fact, the majority of all GDP increases (or declines) usually results from (increases or decreases in) consumer spending. Consumer spending is clearly a critical financial metric. In all likelihood, the most important financial metric. The Steak House Index focuses right here … on the “consumer spending” metric. I intend the SHI10 is to be predictive, anticipating where the economy is going – not where it’s been.
Taking action: Keep up with this weekly BLOG update. Not only will we cover the SHI and SHI10, but we’ll explore related items of economic importance.
If the SHI10 index moves appreciably -– either showing massive improvement or significant declines –- indicating growing economic strength or a potential recession, we’ll discuss possible actions at that time.
The Blog:
‘Goldilocks and the Three Bears‘ was really about inflation. Not beds or porridge. A bed too hard or porridge too hot? The author is really talking about excess inflation. A bed too soft and porridge too cool? That’s insufficient inflation or deflation.
What Goldilocks and all investors really want is an inflation rate that is “just right” … not too hot or too cool. Which is why this question is so important. An 18% increase in overall US money supply — in just 6 months — is a staggering increase. And so this issue begs the question:
Might out-of-control inflation be lurking around the corner?
Before I answer the question, let’s take a brief trip down memory lane. Take a look at the chart below:
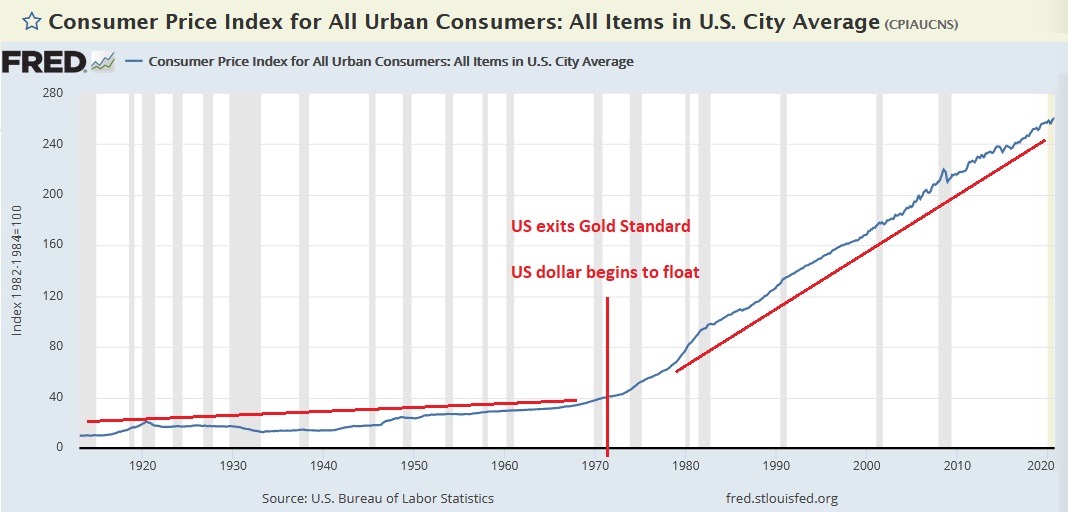
I added all the red — both lines and text. This chart’s time line begins the same year the Federal Reserve was formed — 1913. From 1913 to 1971, a period of just over 50 years, the United States dollar was pegged to gold. During this time period, one we’ll call “the gold period,”the US experienced a relatively tame level of annual inflation. This increase is represented graphically above by the barely increasing height of the red line on the left. After Nixon removed the peg of the US dollar to gold, the average annual inflation rate accelerated.
Many economists believe the 1971 act of separating the US dollar from its gold peg triggered the much higher inflation rate we’ve seen post-gold period. Perhaps. But as we’ve discussed countless times in prior blogs, correlation and causation are not always the same thing. One fact that is incontrovertible, however, is the fact that the pace of US money supply growth significantly accelerated after the peg was removed:
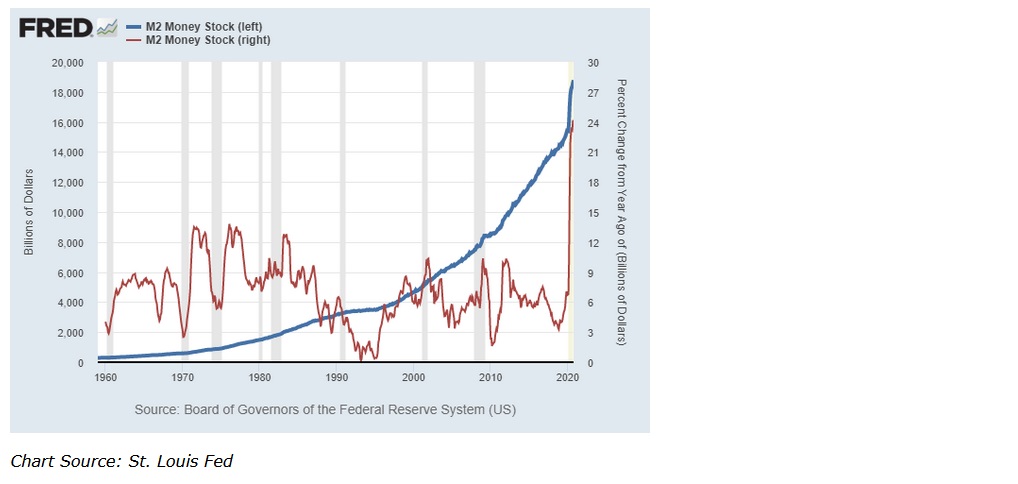
The blue line represents billions of US dollars of M2. The red line is the annual percentage change in the same metric. The increases post-1971, as well as the 2020 spike, are clear and obvious in both dollars and percentages.
Two facts are clear: First, since the end of the gold period, the annual inflation rate has accelerated. During that same period, the annualized growth rate of M2 also accelerated. Are these events connected? Perhaps. Remember, we’re observing this relationship for more than a century. That’s a long time.
Now consider what has transpired in the past 6 months: An 18% increase in M2. Staggering. Back to our earlier question: Will this massive boost in money supply trigger rampant inflation?
No. I don’t think so. While this might seem counter-intuitive, more recent data seems to suggest a correlation between M2 growth and inflation appears to have broken down:
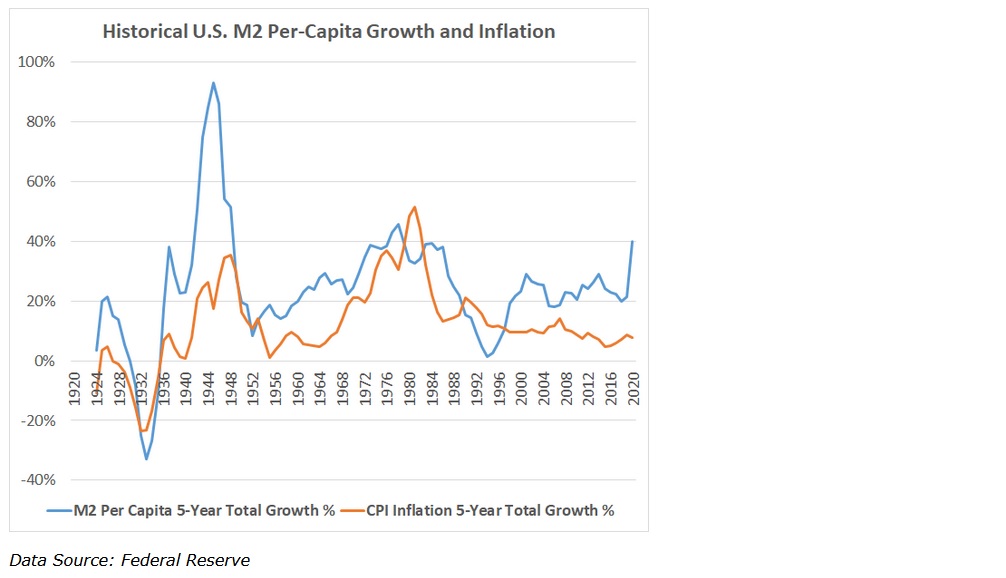
As can be seen above, from around the turn of the century, while the 5-year average M2 growth rate increased dramatically since 2000, the 5-year average CPI growth rate has declined. It is this fact, specifically, that has confounded the FED for the past decade. They have admitted they do not understand why the 100-year relationship has broken down. They appear baffled.
I’m not in the same camp. I believe the US dollar has evolved into the global currency. Everyone wants to lend us money … and they will gladly give it to us in US dollars. At the same time, developing nations around the world are finding capital far more scarce than before COVID. In just the first few months of the pandemic, more than $100 billion of capital fled emerging markets. With capital scarce and costs high, developing and emerging countries will have to borrow money to stay afloat … likely at increasing interest rates, making repayment all the more difficult. If we are to see hyperinflation anywhere, I suspect we’ll see it there.
And that the simple economic models that focus on the supply/demand relationship don’t work in an unconstrained global marketplace as they did when the US system was less integral in global financial operations. The US dollar looms far larger in capital flows and foreign exchange today. So large that is is no longer possible to view the inflation/M2 growth relationship within just the US economy. It must be viewed thru a more global lens.
It’s important to make a few distinctions before I end today’s blog. First, the “inflation” monster we’re discussing here is consumer price inflation. The consumer price inflation represented by the CPI is different than asset inflation. Of course, some asset inflation does find its way into the CPI, but not very much. I believe asset inflation is highly correlated with both money supply and interest rates. With money supply WAY up and interest rates WAY down, I believe assets will continue to rise in value at a rate much higher than in the past.
But I don’t expect to see a CPI inflation spike triggered by M2 supply growth we’ve experienced in the past 6 months.
Could I be wrong? Sure. At some level of M2 growth the CPI inflation monster will appear, as it has in a few other mature economies around the globe. I just don’t think we’re there now … or yet. If I change my opinion, I’ll be sure to let you know.
We’ll see. If you believe I’m wrong, share your thoughts. Comment on this blog. Or go buy gold or gold stocks. (Warren Buffet did.) That works too. 🙂
- Terry Liebman


