
SHI 11.25.2020: Gobble!

SHI 11.18.2020: Is Run-a-way Inflation Here?
November 18, 2020
SHI 12.2.2020: Accelerating Trends Speed Up
December 2, 2020
Wow, this year has flown by … and, at the same time, it has often felt like it would never end. So it’s nice that after almost 11 months of extraordinary experiences, we find ourselves at the doorstep of a very ordinary, very normal annual event: Thanksgiving. Giving the holiday its due, in celebration, for one day and one day only, let’s talk turkey. Today, “Turkeynomics” is in our sights. After all, no one serves steak on Thanksgiving, right? 🙂
Does a Thanksgiving dinner today cost more, less, or about the same as 10 years ago? How about the turkey itself? Has the price of the bird flown to the sky? How about all the “fixins”? Such as pies, ‘tarts’ or ‘turnovers?’ (Yes, those are actually things we eat.) And don’t forget the potatoes. We must have mashed potatoes with our turkey! And gravy … we have to have gravy!
But above all, I wish you …
“
An ordinary Thanksgiving
during this extraordinary year.“
“
An ordinary Thanksgiving
during this extraordinary year.“
Grab your fork and knife and let’s cut into the data.
Welcome to this week’s Steak House Index update.
If you are new to my blog, or you need a refresher on the SHI10, or its objective and methodology, I suggest you open and read the original BLOG: https://www.steakhouseindex.com/move-over-big-mac-index-here-comes-the-steak-house-index/
Why You Should Care: The US economy and US dollar are the bedrock of the world’s economy.
But is the US economy expanding or contracting?
Before COVID-19, the world’s annual GDP was collectively about $85 trillion. Then it shrank … then bounced back! We can thank global fiscal and monetary policy for the bounce. According the the Q3, 2020 ‘preliminary’ numbers, annual US GDP is back UP to about $21.1 trillion. And still, together, the U.S., the EU and China continue to generate about 70% of the global economic output.
The objective of this blog is singular.
It attempts to predict the direction of our GDP ahead of official economic releases. Historically, ‘personal consumption expenditures,’ or PCE, has been the largest component of US GDP growth — typically about 2/3 of all GDP growth. In fact, the majority of all GDP increases (or declines) usually results from (increases or decreases in) consumer spending. Consumer spending is clearly a critical financial metric. In all likelihood, the most important financial metric. The Steak House Index focuses right here … on the “consumer spending” metric. I intend the SHI10 is to be predictive, anticipating where the economy is going – not where it’s been.
Taking action: Keep up with this weekly BLOG update. Not only will we cover the SHI and SHI10, but we’ll explore related items of economic importance.
If the SHI10 index moves appreciably -– either showing massive improvement or significant declines –- indicating growing economic strength or a potential recession, we’ll discuss possible actions at that time.
The Blog:
The Consumer Price Index tracks price movement for all kinds of products. But no one does a better job on the “Thanksgiving Dinner Price Survey” than the American Farm Bureau Federation (AFBF). For 35 years now, the AFBF has performed this invaluable service for America. This year, or course, they asked their 230 volunteer shoppers to do their price checking on-line instead of at the grocery store. That’s a first.
And what did they discover? Well, according to the AFBF Thanksgiving Dinner Price Survey, the average cost for a family of 10 is just $46.90 (less than $5.00 per person.) And it turns out this is a significant price decrease from last year’s average of $48.91 — a dip of more than $2. This year, Thanksgiving costs less.
Now I’m sure you’re curious about the “family of 10” cost during the past 10 years …. so here you go:
- > 2019: $48.91
- > 2018: $48.90
- > 2017: $49.12
- > 2016: $49.87
- > 2015: $50.11
- > 2014: $49.41
- > 2013: $52.23
- > 2012: $49.48
- > 2011: $49.20
- > 2010: $43.47
“The average cost of this year’s Thanksgiving dinner is the lowest since 2010,” said AFBF Chief Economist Dr. John Newton. “Pricing whole turkeys as loss leaders to entice shoppers and move product is a strategy we’re seeing retailers use that’s increasingly common the closer we get to the holiday,” he explained. Shocking right? No, not the price of the birds … I’m talking about the fact that apparently the AFBF employs a ‘Chief Economist!’ 🙂
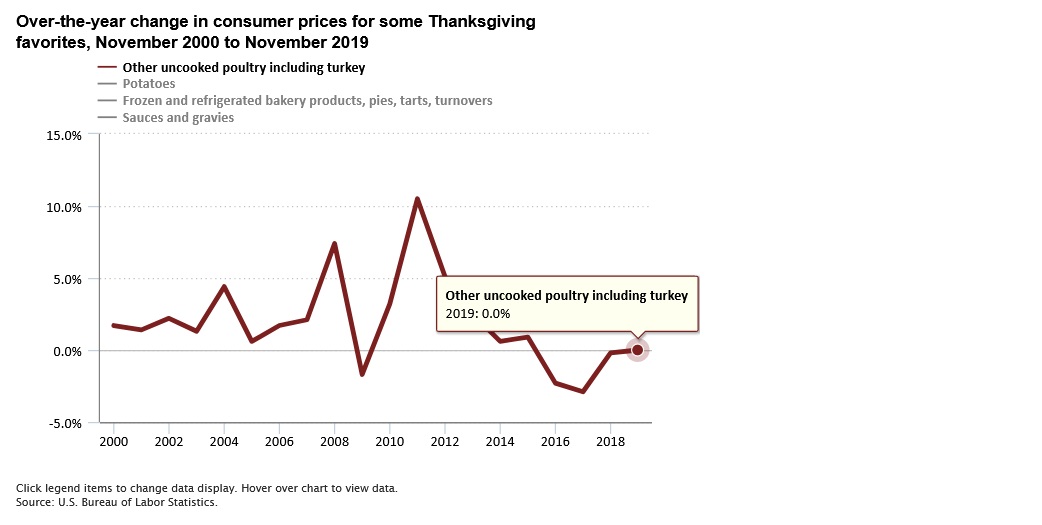
Not to be outdone by the farmer economists, the CPI adds its own spin on the data. Thru their almost 20-year lens, they assure us consumer prices for “other uncooked poultry including turkey” did not change from November 2018 to November 2019. In fact, in the 19-years between 2000 to 2019, the change in consumer prices for other uncooked poultry including turkey averaged only 1.9 percent from one November to the next.
Of course, prices did fluctuate year over year. 2011 was not kind to the wallet of the Thanksgiving host family. That year, turkey prices were up by 10.5% and potatoes increased a staggering 12%!
We cannot have a Thanksgiving without mashed potatoes!
In 2019 the consumer prices for potatoes increased 5.6 percent for the year ended in November. Consumer prices for potatoes increased by 3.5 percent, on average, for the 12 months ended in November from 2000 to 2019. I think I might invest in potatoes next year.
And, of course, gravy is a must. Consumer prices for sauces and gravies decreased 0.9 percent over the year in November 2019. Phew. We’re saving on gravy. Consumer prices for sauces and gravies averaged a 1.4 percent increase for the year ended in November from 2000 to 2019.
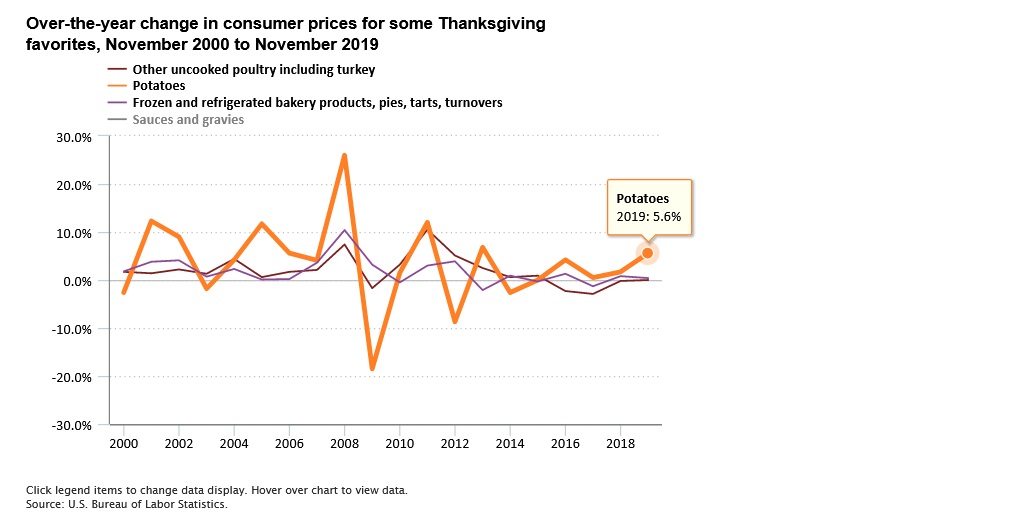
Finally, a pie or ‘tart’ finishes the meal. Consumer prices for ‘frozen and refrigerated bakery products, pies, tarts, turnovers’ increased 0.4 percent for the year ended in November 2019. Consumer price increases for these items averaged 1.8 percent per year from November 2000 to November 2019.
By now, the economics of this year’s Thanksgiving feast are well understood by all. You probably know more about turkey prices than you ever hoped. So, let’s leave Turkeynomics behind and permit me to move on to a couple more meaty topics before the holiday celebration begins.
Earlier today, the BEA released its “second estimate” for Q3, 2020 GDP. This estimate was identical to the first: US GDP grew at the annualized rate of 33.1% in the third quarter of 2020. Beyond this, there are two (2) things worth comment. First, after a decline of 0.8% during Q2, during Q3 the ‘PCE price index’ excluding food and energy prices increased by 3.5%. That’s a fairly large one-quarter jump. I’ll be keeping an eye on this.
The second important data point worth mentioning are ‘corporate profits.’ These figures are also hot off the press. Why are corporate profits important? Essentially, they are the rocket fuel that powers the stock markets. When corporate profits fall — as they did in Q2 — the markets are adversely impacted. So the stock markets are happy to see corporate profits in Q3 experienced the “V” shaped recovery you can see below — shooting up to $2.027 trillion.
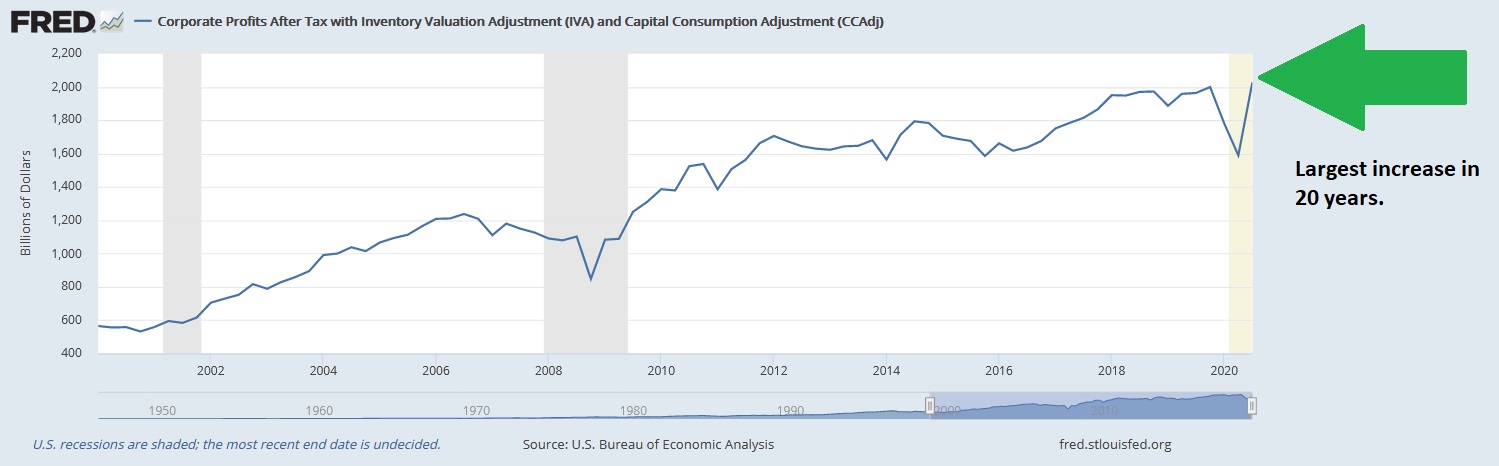
Of course, there are numerous factors impacting stock market performance, but the movement in corporate profits is always a major driver.
If you’re interested in reading the entire BEA release from earlier today, here’s the link.
Happy Thanksgiving!
- Terry Liebman


