
SHI 12.16.20: Piles and Piles of Cash

SHI 12.9.2020: The Bahamas go Digital
December 9, 2020
SHI: 12/23/2020: Predictions for 2021
December 23, 2020
“The sky is falling!” Chicken Little made the line famous. It even became a syndrome! Wikipedia defines the ‘Chicken Little syndrome’ as fearmongering, or “inferring catastrophic conclusions possibly resulting in paralysis.” At the risk of fearmongering — for which I apologize in advance — I feel compelled, once again, to mention my inflation concerns.
I know! Right? I’m like a broken record! But this is a very important topic and worth mentioning again — especially in light of data point below. Take your time absorbing this next staggering data point. Think about it … and make sure you are crystal clear on the data and implications.
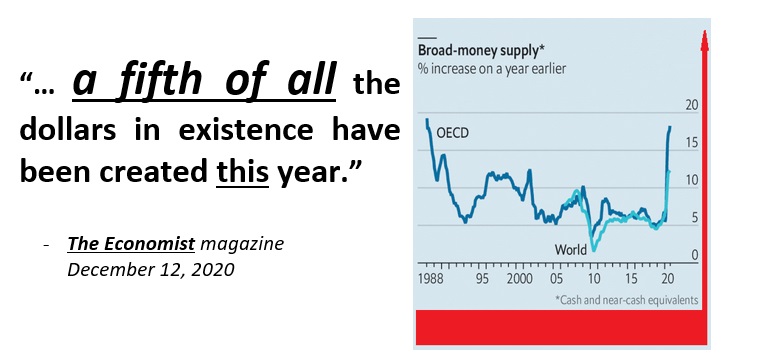
Yes, according to The Economist magazine, one fifth – 20 percent – of all the dollars ever in existence have been created in 2020! That, my friends, is unprecedented. This amount of money supply growth, in such a short period of time, has never happened before. Never.
And at any other point in history, a whole bunch of economists would be screaming that hyperinflation must be right around the corner. And I mean screaming.
“
20 percent of all dollars ever in existence
were created in 2020.“
“
20 percent of all dollars ever in existence
were created in 2020.“
So, at the risk of fearmongering, once again, I feel compelled to ask, “Is rampant inflation lurking around the corner?”
Welcome to this week’s Steak House Index update.
If you are new to my blog, or you need a refresher on the SHI10, or its objective and methodology, I suggest you open and read the original BLOG: https://www.steakhouseindex.com/move-over-big-mac-index-here-comes-the-steak-house-index/
Why You Should Care: The US economy and US dollar are the bedrock of the world’s economy.
But is the US economy expanding or contracting?
Before COVID-19, the world’s annual GDP was collectively about $85 trillion. Then it shrank … then bounced back! We can thank global fiscal and monetary policy for the bounce. According the the Q3, 2020 ‘preliminary’ numbers, annual US GDP is back UP to about $21.1 trillion. And still, together, the U.S., the EU and China continue to generate about 70% of the global economic output.
The objective of this blog is singular.
It attempts to predict the direction of our GDP ahead of official economic releases. Historically, ‘personal consumption expenditures,’ or PCE, has been the largest component of US GDP growth — typically about 2/3 of all GDP growth. In fact, the majority of all GDP increases (or declines) usually results from (increases or decreases in) consumer spending. Consumer spending is clearly a critical financial metric. In all likelihood, the most important financial metric. The Steak House Index focuses right here … on the “consumer spending” metric. I intend the SHI10 is to be predictive, anticipating where the economy is going – not where it’s been.
Taking action: Keep up with this weekly BLOG update. Not only will we cover the SHI and SHI10, but we’ll explore related items of economic importance.
If the SHI10 index moves appreciably -– either showing massive improvement or significant declines –- indicating growing economic strength or a potential recession, we’ll discuss possible actions at that time.
The Blog:
Joachim Fels is a managing director at PIMCO. Previously he was the ‘global chief economist’ at Morgan Stanley and before that, an international economist at Goldman Sachs. The man is downright luminary. Which is why his comment below should give you pause:
“Most investors and central bankers seem to believe that the extreme monetary policy accommodation in the US and Europe is exactly what the doctor ordered in an environment where fears…abound. However…we continue to worry more about the longer-term inflationary risks associated with extreme monetary accommodation….”
Runaway inflation troubles him greatly. He is an inflationista. But here’s something you may find even more interesting: Mr. Fels made these comments over 10 years ago, after the Great Recession of 2008 and around the time of the FED monetary easing and QE2. What does inflationista Mr. Fels have to say about the massive expansion of money happening right now?
Nothing. Zip. Zero.
On August 27th, Fels and Alison Boxer posted a blog wherein they commented,
“With slack in the economy weighing on inflation and markets already pricing in highly accommodative policy, Fed officials will need help from fiscal policymakers to achieve the average inflation goal outlined in their new framework.”
Remember, the FEDs inflation goal is a paltry, minuscule 2% per year.
Amazingly enough, the puzzling lack of inflation after the Great Recession, and over the past 10 years, seems to have silenced many inflationistas this time around. I mean, money supply growth this year – in a year filled with unprecedented events – is, well, unprecedented:
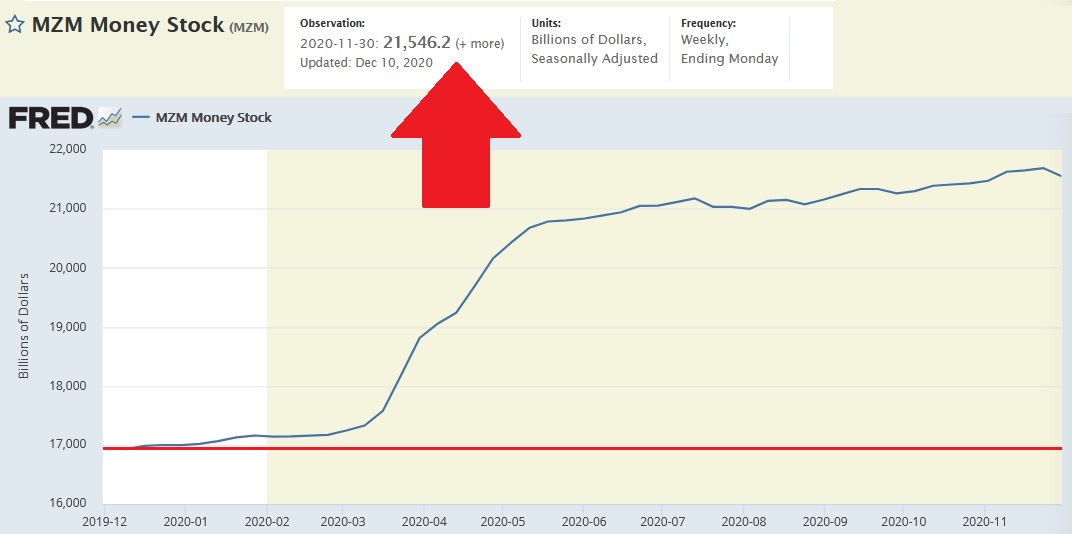
MZM is a slightly different metric than M1 or M2. MZM, or “money of zero maturity,” is the measure of the liquid money supply within our economy. It is the sum of all money that is readily available to spend or in a liquid state. Like the cash in your wallet or the money in your checking account.
And since February, in just 9 months, MZM has increased from a little over $17 trillion to $21.546 trillion – an increase of 26.7%. In just 9 months. This is worth repeating: the US “liquid” money supply increased by almost 27% in the past nine months. Staggering.
Consider Argentina. Argentina money supply — in this case, M2 — increased 69.2% ‘year-over-year’ as of October 2020. Sure, that about 3X the increase we’ve seen here in the US. But Argentina’s inflation rate in 2019 was over 53%! According to the Bureau of Labor Statistics, consumer inflation here in the US ran a mere 1.2% over the past 12 months. How is this possible?
One likely explanation is that the US dollar has been the globe’s preeminent currency for decades. Consider this chart clipped from a IMF paper entitled “Reserve Currencies in an Evolving International Monetary System:”
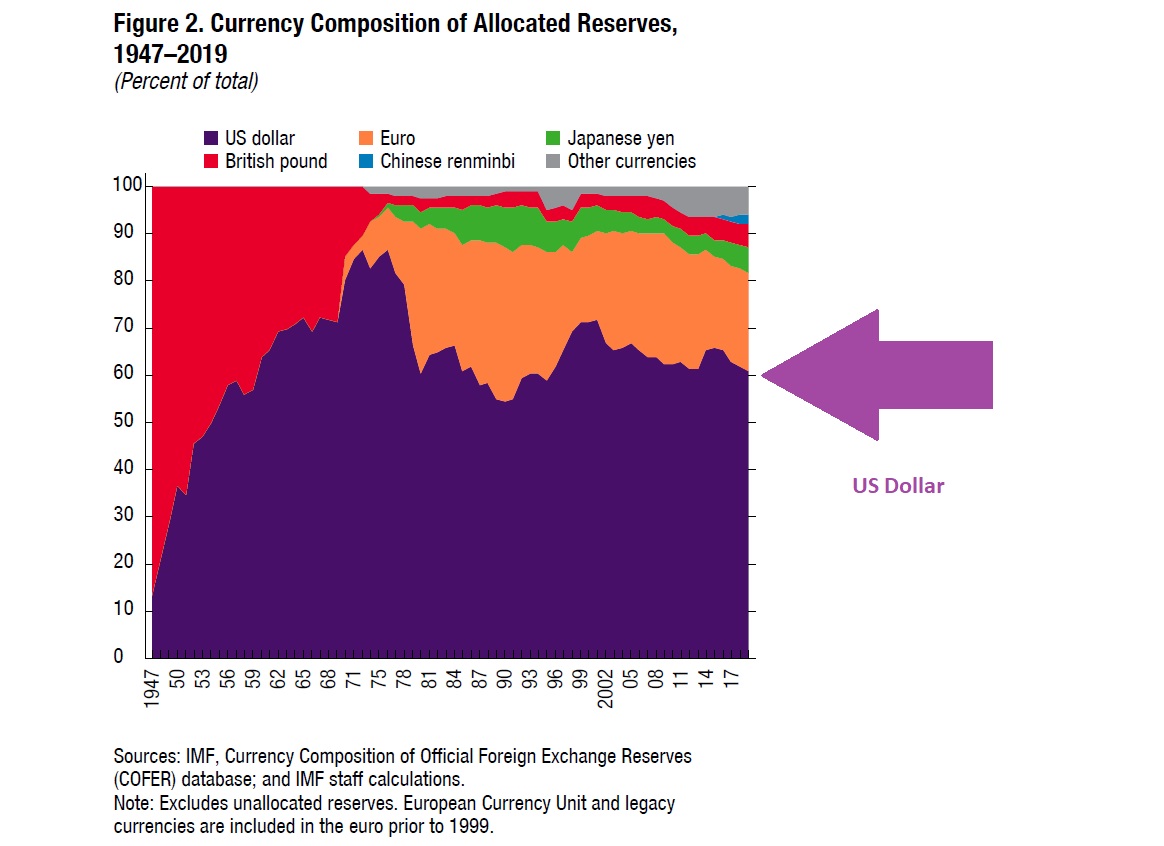
The dollar has lost a bit of its shine since the 1970s when it exceeded 80% of all foreign exchange holdings. But for the past few decades, the USD has remained north of 60% of all foreign reserves. The Argentine dollar has no such role in the global currency system.
The IMF paper shared this conclusion …
“The US dollar’s dominance as a reserve currency is expected to endure. However, the COVID-19 pandemic raises significant uncertainties concerning key trends in economic drivers of reserve configurations going forward. “
… and finished with this statement — apparently in a nod to my BLOG from last week:
“Furthermore, technological advances, particularly the emergence of digital currencies and advances in payment systems, could alter the importance of traditional drivers of reserve currencies, speed up the transition to alternative reserve configurations, result in the emergence of new reserve currencies, and even lessen the stability of future reserve currency configurations.”
Fascinating. Interestingly enough, many economists and large financial institutions who “track” inflation are not overly worried:
<> Goldman Sachs on 11/7/2020: “The underlying inflation reality, however, looks set to remain benign.”
<> JP Morgan on 11/10/2020: “Like our growth forecasts, our inflation forecasts are little changed….”
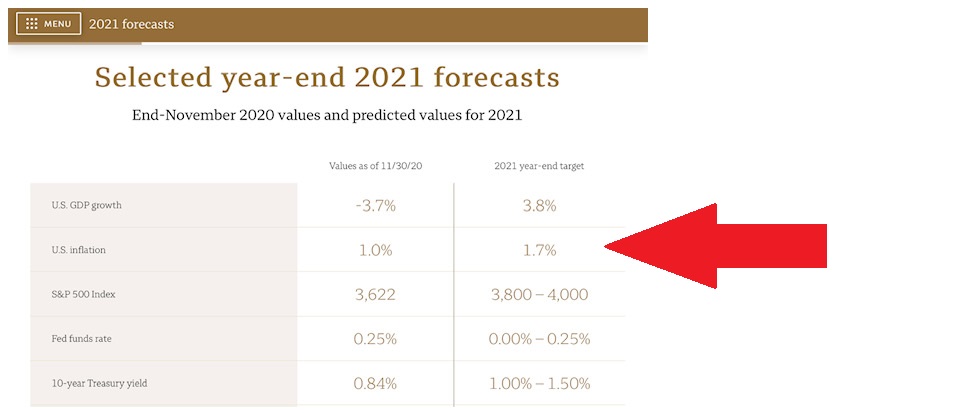
Here’s a more complete macro-economic 2021 forecast from Wells Fargo:
So the “big guys” are not overly concerned about the money supply explosion. Should we “mere mortals” be worried?
Consider an additional headline from The Economist magazine on December 9th:
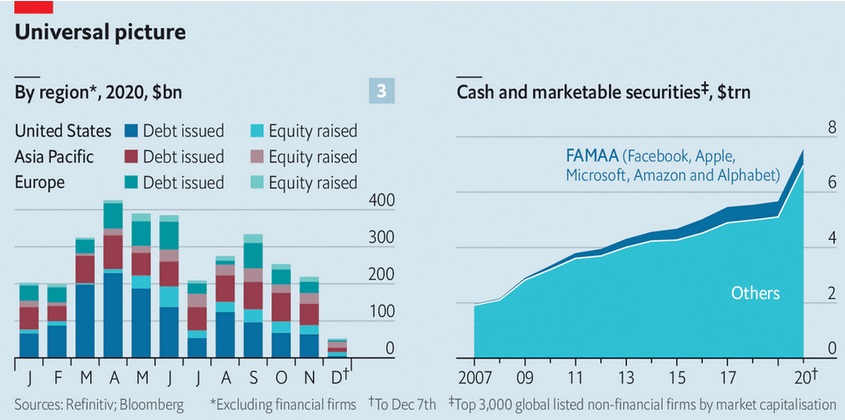
“Companies have raised more capital in 2020 than ever before.”
In 2020 the world’s non-financial firms have raised an eye-popping $3.6 trillion in capital from public investors. In fact, the cash now held by the world’s 3,000 most valuable listed non-financial firms has exploded to $7.6 trillion … Excluding America’s abnormally cash-rich technology giants—Apple, Microsoft, Amazon, Alphabet and Facebook—corporate balance-sheets are overflowing with liquidity.
There are piles and piles of cash everywhere.
It is still too early to tell what firms will do with all that cash. Stock buybacks? Special dividends? Investment? It’s hard to say. I suspect many companies will be content simply maintaining liquidity, at least until a covid-19 vaccine becomes more widely available.
Summarizing: Clearly there is an ocean of cash, sloshing around, looking for something to do. Does this create an inflation problem?
Milton Friedman, the most famous of all Monetarists, would probably say yes. Me? I will say maybe. In prior blogs I’ve talked extensively about systemic changes that may have blunted the relationships between labor, GDP growth rates and money supply growth. Things like:
- Demographic – aging population
- Labor – movement away from human labor / expansion of global labor force
- Systemic complexity and size – money supply is no longer a simple lever
The issue of what ultimately is done with all this cash also plays into the question. Consumers and companies really have only 2 options: Consumption or Investment.
If a large portion of the “new money” is used by consumers to consume — buy stuff, enjoy activities, etc. — then historic monetarist models suggest there may be a consumer price inflation issue. Alternatively, if “investment” becomes the major beneficiary, then we may not see a consumer price increase … but an asset value inflation issue. Which is precisely what I believe we’re seeing in the stock markets, increases in the price of gold and other metals, and the staggering value of Bitcoin.
Here’s a fun question: Is buying a car an “investment” or “consumption?”
It depends. A car purchased by a consumer is considered consumption, but a car purchased by a firm is considered investment. 🙂
So how will all this cash find its way into circulation? Consumption? Investment? Time will tell.
Here’s the bottom line: The past 9 months have added $5.5 trillion to our money supply — a 27% increase over the prior supply. It is now sloshing thru the US economy. As we discussed in prior blogs, much of it has been saved — probably close to $1.5 trillion.
Where has the rest of the money gone? If it’s not being spent on “stuff” — which could it’s filling up savings accounts, checking accounts, and wallets; it’s buying houses and common stocks; and, if it’s not yet out there working, it will be soon. Unspent and unused, these funds represent a ‘kinetic‘ inflation boost — once used, once put in play, they must cause some price or value inflation. In my opinion, this outcome is simply inevitable. In my opinion.
Sooner or later, either consumer prices or asset prices, or both, will ultimately increase due to the money supply spike.
In the final analysis, I expect much of this liquidity will bolster investment as opposed to consumption. If I’m right, all asset prices will continue to rise. By a sizable margin. Even as consumer inflation remains tame. As odd as that sounds, it is a likely future.
- Terry Liebman


