
SHI 2.12.2020 – Ride The Wave!

SHI 2/5/2020 – Sorry About That!
February 5, 2020
SHI 2.19.2020 – Confirmation Bias
February 19, 2020
“Look, I’m really happy the stock markets are hitting new highs every day.”
So ride that wave! I am. But if you’re gonna “stay in the market,” and keep riding, you should be armed with the facts. And maybe a life vest. Here we go …….
Welcome to this week’s Steak House Index update.
If you are new to my blog, or you need a refresher on the SHI10, or its objective and methodology, I suggest you open and read the original BLOG: https://www.steakhouseindex.com/move-over-big-mac-index-here-comes-the-steak-house-index/
Why You Should Care: The US economy and US dollar are the bedrock of the world’s economy.
But is the US economy expanding or contracting?
According to the IMF (the ‘International Monetary Fund’), the world’s annual GDP is about $85 trillion today. According to the most recent estimate, US ‘current dollar’ GDP now exceeds $21.7 trillion. In Q4 of 2019, first estimates suggest nominal GDP grew by 3.6%, following a 3.5% annualized growth rate in Q3. The US still produces about 25% of global GDP. Other than China — in a distant ‘second place’ at around $13 trillion — the GDP of no other country is close. In fact, the GDP output of the 28 countries of the ‘European Union’ has fallen behind, collectively now almost $2 trillion less that US GDP. Together, the U.S., the EU and China still generate about 70% of the global economic output.
The objective of this blog is singular.
It attempts to predict the direction of our GDP ahead of official economic releases. Historically, ‘personal consumption expenditures,’ or PCE, has been the largest component of US GDP growth — typically about 2/3 of all GDP growth. In fact, the majority of all GDP increases (or declines) usually results from (increases or decreases in) consumer spending. Consumer spending is clearly a critical financial metric. In all likelihood, the most important financial metric. The Steak House Index focuses right here … on the “consumer spending” metric. I intend the SHI10 is to be predictive, anticipating where the economy is going – not where it’s been.
Taking action: Keep up with this weekly BLOG update. Not only will we cover the SHI and SHI10, but we’ll explore related items of economic importance.
If the SHI10 index moves appreciably -– either showing massive improvement or significant declines –- indicating growing economic strength or a potential recession, we’ll discuss possible actions at that time.
The BLOG:
As I said last week, recession risks appear to have faded. Sure, we’re all unsure about the impacts of the Coronavirus, and if your a fan of capitalism — as I am — Bernie’s primary win in New Hampshire is a bit unsettling; but these wildcards aside, the US economy continues to chug along. Slowly but surely, like the “Little Engine that Could”, GDP growth keeps chugging up the hill. The longest economic expansion in US history continues unabated.
The stock markets keep chugging up too. Stock values are rising. almost every day. Valuations are WAY up. If you google ‘stock valuation,’ and then select the Wikipedia link, you’ll see this language on the Wiki page:
“In the view of fundamental analysis, stock valuation based on fundamentals aims to give an estimate of the intrinsic value of a stock, based on predictions of the future cash flows and profitability of the business.“
In last week’s BLOG, I commented that according to FACTSET the S&P500 “forward 12-month P/E Ratio” is at its highest level in almost 20 years – since 2002. In late January, it was pegged at 18.7X. In early 2010 — about 10 years ago — it was closer to 11, and slid down to around 10 in 2011. If you want a refresher, take a look at the chart toward the end of last weeks BLOG:
https://www.steakhouseindex.com/shi-2-5-2020-sorry-about-that/
Here’s the point: In the past 10 or so years, corporate profits (after tax) have increased only about 21%. In fact they’ve shown close to no growth since 2012. At the same time, the S&P500 has increased about 160% — and since 2012, about 140%. Said another way, during the time corporate profits were relatively unchanged, the S&P500 increased by almost 140%.
Of course, this doesn’t mean that revenue and profit growth has been flat for all companies. No, some companies — take Amazon and Apple, for example — keep piling on profits, quarter after quarter. For this analysis, we’re looking at all the companies in the S&P500, in the aggregate. So, you might be asking yourself, “how can the stock market continue to rise if corporate profits are flat?” Good question.
Here’s an interesting graph. It compares movement over the last 10-years of the S&P 500 Index against Corporate Profits during the same time period. Both metrics are measured quarterly. Take a look:
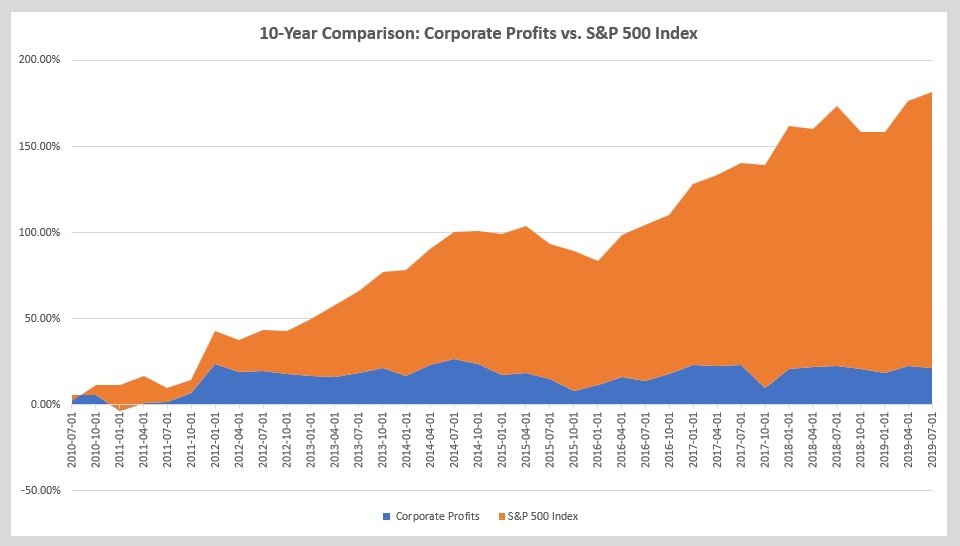
Corporate profits are in blue; the S&P 500 Index, in orange. Permit me two more clarifications:
- Corporate profits are after the payment of corporate taxes. So this is true profit. Further, they are un-adjusted for inventory valuation or what’s called ‘capital consumption.’ In other words, corporate profits would be a bit lower if adjusted for these two non-cash, “accounting” items.
- The S&P 500 Index is a quarterly average and does not reflect daily movement during the quarter.
It’s easy to see the wide divergence after 2012. So, let’s get back to your good question, “how can the stock market continue to rise if corporate profits are flat?” In two words, the a big part of the answer is ‘multiple expansion.’ That’s not the entire answer, mind you, but a big part of it. When the earnings multiple almost doubles, so does the value of the S&P500 index.
Is the almost-doubling of the S&P500 earnings multiple justified? This, too, is an important question. Because if it IS justified, then current stock valuations are not bubbleishous (is this even a word?) and are supported by fundamentals. Which means, frankly, we can keep “riding the wave” with some degree of comfort. But if valuations are NOT supported by fundamentals, we’re taking a lot of risk staying in the stock markets.
Here’s where I shift from fact to opinion:
The level of global interest rates is, far and away, the biggest single support factor for multiple expansion. As a long term reader of my blog, you know global rates are at — and remain at — 4,000 year lows. Yes, that’s 4,000 years. In fact, global rates, in the aggregate have never been lower. At least not for a protracted time. Rates have remained ultra low for about a decade. And the decade before that, they were fairly low by historic standards. Many ‘prime age’ workers (25 to 54 years old) have never seen double digit interest rates. Well, except on their credit card debt. As rates move lower, investors seek higher yield in ‘riskier’ assets such as public stocks and real estate. The increased demand for those risk assets increases P/E ratios, and in the case of commercial real estate, pushes capitalization rates lower, and asset values higher. If rates continue to remain at these low levels — something I expect to happen — then the multiple expansion may be justified. But if interest rates were to move up, across the globe, to a new significantly higher level, and sustain that level for 3 years or more, then I expect this paradigm would change. Keep an eye on rates.
On the other hand, there are plenty of threats out there. Notably the Coronavirus and Bernie Sanders. Putting it mildly, Bernie is not a fan of corporations or corporate profits.
And while the current White House has been a big supporter of US corporations, and corporate profits (the corporate tax cut was happily received by companies), the 2020 budget proposal has suggested we eliminate a number of existing corporate tax breaks, breaks that were ushered in just a few years ago. Because hidden inside that budget is the elimination of corporate deductions that may cost companies about $150 billion per year in additional taxes:
- R&D expending is proposed to change, possibly increasing corporate taxes by $120 billion;
- The budget eliminates the ability to expense capital investments — $38 billion; and,
- Calculations for ‘net interest deduction’ and foreign income taxes are proposed to change, adverse to corporate profits.
Sooooo …. it’s kinda hard to say if stock market valuations are justified. They might be. Another support for multiple expansion, frankly, might be GDP growth. If the economy is chugging stronger than I believe it is, then corporate profits may begin to rise again. What are the steakhouses telling us? Is our economy as hot as the grill at Ruths Chris?
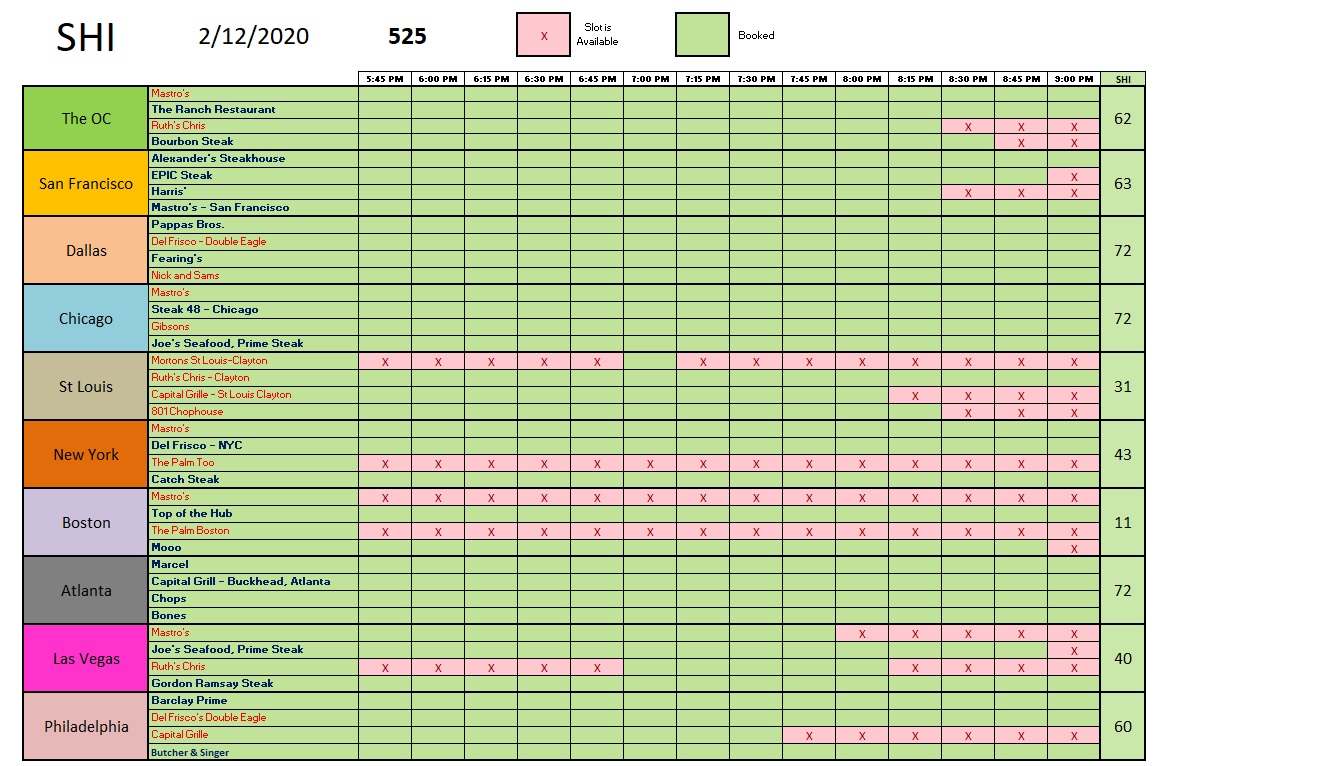
WOW! It is! I’m seeing a whole lot of green! And green on the SHI10 translates into green at the steakhouses — a bucket full of dollars and profits! Reservation demand this week is at an all time high. We’ve never seen an SHI10 reading of 525 before. Dallas, Chicago and Atlanta are FULLY BOOKED this Saturday evening. The OC, San Francisco and Philly have only a few reservations slots left — and these are all late in the evening. If this were an ordinary week, I’d be really impressed! But, alas, it is not an ordinary week.
No, this Friday is Valentine’s Day. (Gentlemen, consider this your reminder.) Which makes Saturday a prime date night. Across the US, folks-in-love will be making googly-eyes at each other over red-rare T-bones, a tannin-heavy Cabernet. And, as the evening ends, they will spend a lot of green. It’s a big weekend for our expensive steakhouses. Here’s the longer term trend:
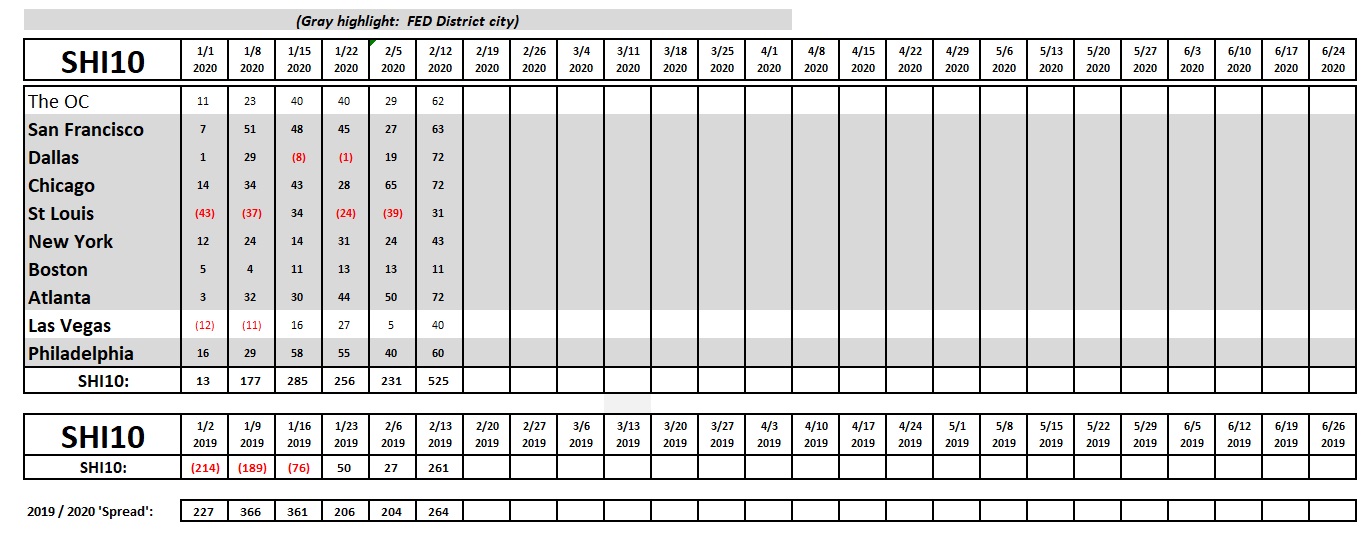
The steaks may be red … but there is no red in this weeks SHI10! We see the bump in this week’s SHI10 is consistent with this week last year. Makes sense. But take comfort from the fact that across the US people are feeling flush enough to head to our pricey eateries in droves. They could have stayed home. But the are not. This bodes well for our economy. Happy Valentines Day! Enjoy!
- Terry Liebman


