
SHI 2.19.2020 – Confirmation Bias

SHI 2.12.2020 – Ride The Wave!
February 12, 2020
SHI 2.26.20 – Reaching New Lows
February 26, 2020
“It’s easy to fall into this trap. Am I guilty?”
If you GOOGLE the term ‘confirmation bias’ you’ll get this response: “the tendency to interpret new evidence as confirmation of one’s existing beliefs or theories.” New evidence … that confirms my SHI and economic theories … hmmm … yep, spot on! Guilty as charged! 🙂
Welcome to this week’s Steak House Index update.
If you are new to my blog, or you need a refresher on the SHI10, or its objective and methodology, I suggest you open and read the original BLOG: https://www.steakhouseindex.com/move-over-big-mac-index-here-comes-the-steak-house-index/
Why You Should Care: The US economy and US dollar are the bedrock of the world’s economy.
But is the US economy expanding or contracting?
According to the IMF (the ‘International Monetary Fund’), the world’s annual GDP is about $85 trillion today. According to the most recent estimate, US ‘current dollar’ GDP now exceeds $21.7 trillion. In Q4 of 2019, first estimates suggest nominal GDP grew by 3.6%, following a 3.5% annualized growth rate in Q3. The US still produces about 25% of global GDP. Other than China — in a distant ‘second place’ at around $13 trillion — the GDP of no other country is close. In fact, the GDP output of the 28 countries of the ‘European Union’ has fallen behind, collectively now almost $2 trillion less that US GDP. Together, the U.S., the EU and China still generate about 70% of the global economic output.
The objective of this blog is singular.
It attempts to predict the direction of our GDP ahead of official economic releases. Historically, ‘personal consumption expenditures,’ or PCE, has been the largest component of US GDP growth — typically about 2/3 of all GDP growth. In fact, the majority of all GDP increases (or declines) usually results from (increases or decreases in) consumer spending. Consumer spending is clearly a critical financial metric. In all likelihood, the most important financial metric. The Steak House Index focuses right here … on the “consumer spending” metric. I intend the SHI10 is to be predictive, anticipating where the economy is going – not where it’s been.
Taking action: Keep up with this weekly BLOG update. Not only will we cover the SHI and SHI10, but we’ll explore related items of economic importance.
If the SHI10 index moves appreciably -– either showing massive improvement or significant declines –- indicating growing economic strength or a potential recession, we’ll discuss possible actions at that time.
The BLOG:
We are all guilty, right? I mean, who likes to be wrong? No one. So when we hear comments or data in support of our beliefs, we often say to ourselves, “Spot on! They agree with me … and so we must both be right!”
Everyone likes to be right … all the time … you know it and I know it. Unfortunately, everyone cannot be right all the time. Only certain people — people like me — can be right all the time. Ask my wife: She’ll confirm that I’m always right. 🙂
Actually, I doubt she would agree. For good reason. We’ve been married for a long time. But while I suffer from a confirmation bias tendency, just like you, that doesn’t mean I’m not occasionally actually right! The challenge, I feel, is maintaining enough personal objectivity while you to interpret new data to ensure you don’t fall into this trap. And so when I read the latest ‘FRBSB Economic Letter’ published yesterday, entitled “The New Stone Soup,” I had to pinch myself! For 2 reasons. First, who doesn’t love stone soup, right? At Mastros, I always order ‘New Stone Soup’ as an appetizer. Just kidding. But any food reference, as you know, fits right in with our beloved Steak House Index! What could be better than steak and soup?
But more importantly, and more seriously, the data within this Federal Reserve Bank of San Francisco ‘economic letter’ completely validates some of my economic musings of the past few years. Specifically, these points:
- Large structural shifts are reshaping our economy. First among them is population aging. The baby-boom generation is retiring. And this is having a profound effect on labor force growth—especially since subsequent birth cohorts are so much smaller.
- During the 1970s, as the baby-boom generation matured and entered the labor market in large numbers, the U.S. labor force grew by just over 2.5% per year. Today, labor force growth is closer to 0.5% per year. All else being equal, this shaves about 2 percentage points off potential GDP growth in the United States each year.
- This slower economic growth translates directly into lower interest rates.
- At the same time, an aging population increases the pool of available savings, as older individuals build and preserve their nest eggs. Together, these forces increase the supply of savings relative to the demand for investment, reducing real interest rates.
- Policies enacted to offset the global financial crisis have left many advanced nations with relatively high debt-to-GDP ratios. And most face looming obligations to support their aging populations at levels promised when growth was much faster
You have to admit, these comments by Mary Daly, the President of the San Francisco FED, are almost a mirror of my own over the past few years. Confirmation bias … here we come! (Here is the complete paper … if you wish to take a look. Remember: Right click, open a new window.)
But here’s the good news for me: I’m not simply taking Mary’s word for it. It’s not only Mary confirming my theories … many other experts have, too. Within her economic letter, she is relying on extensive data from numerous other published sources, such as:
- Congressional Budget Office
- The Federal Reserve Board and Federal Open Market Committee (FOMC)
- Economists Fernand and Li, 2019
- The previous President of the SF FED, now the President of the NY FED, John Williams
- Economists Carvalho, Ferrero, and Nechio in 2016
- Holston, Lauback and Williams, 2017 & Jorda, Taylor, 2019
And the list goes on. We can’t all be delusional, can we? 🙂
No, we can’t. The facts, unfortunately, are clear and incontrovertible: Looking 50 years ahead, developed nations around the world face a future that is very different than the economic experience of the past 50 years. And if developed nations face these challenges, so do for-profit corporations, and so do we as individual investors, business owners, or simply ‘interested parties.’
Unlike Mary, I am not prescribing stone soup as a remedy. And who the heck wants to eat stone soup anyway? Sounds horrible! To be frank, I don’t think we need a remedy. We simply need to understand the facts, the economic constraints we face, and deal with them appropriately. Let’s assume for a moment that the “new normal” for US GDP growth is about 2% per year. Said another way, that means the future long-term average for the ‘real’ growth rate is 2% and about 3.5% annually (assuming PCE inflation runs about 1.5%) when measured nominally, or in current dollars not adjusted for inflation. Assuming our population growth flattens out — ala Japan — and our population levels off around 350 million people, then we don’t need a 4% GDP growth rate to support a growing population. Because under these conditions, if population growth is flat, our GDP will grow faster than the population, continuing to improve the overall standard of living of each American. According to the government figures, US real GDP has been growing a bit faster than this “potential” GDP growth rate since 2009:
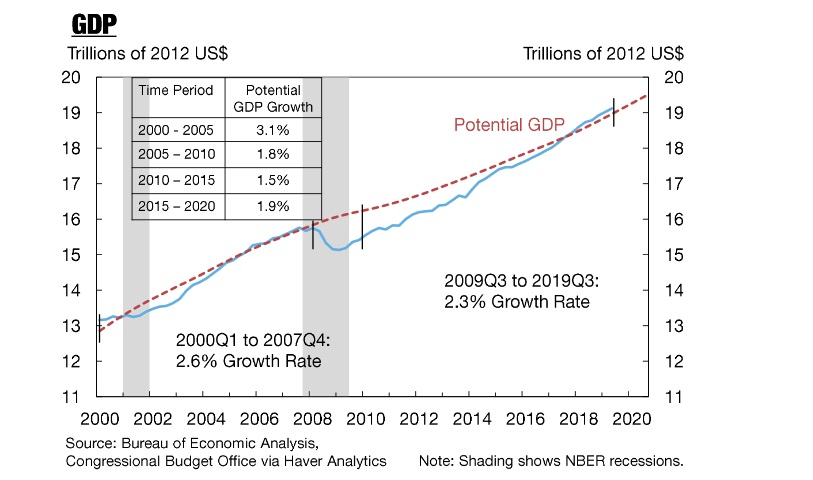
Since 2009 Q3, we’ve experienced about 2.3% annual growth. (Take a look at the chart to the right.) That’s pretty darn good … all things considered!
Of course, the “aging population” thing is a whole different challenge … and has potential long-term implications on consumer spending and senior retirement benefits. We’re gonna have to deal with this … and there are probably some tough choices to be faced by future politicians. This is a real challenge.
But, as I’ve been saying for a few years now, 2% ‘real’ annual economic growth is pretty good under these conditions! And right now, the potential headwinds aside, that’s about what I believe 2020 can produce. Well, my annual forecast is a bit lower. The Q1 GDP reading is likely to be weak. You may recall that every year Q1 does tend to be the weakest quarter. And make no mistake: The coronavirus will have negative impacts on US GDP, just as it is likely to lead Japan into its first ‘technical’ recession in about 10 years and, possibly, push China’s first quarter GDP growth reading close to zero. The east will bear the brunt of this challenge … but US business activity will be impacted too.
Looking longer term, I remain steadfast in my beliefs that during the next decade or two:
- The “speed limit” for US GDP is right around 2% per year.
- Annual inflation growth will muted and constrained, at or below 2% per year.
- ‘Developed world’ interest rates will remain at, or below, current levels.
If I’m right, and since these are predictions, while I believe I am, I could be wrong; but, if I’m right, then DOW 40,000 is probably 2 decades into the future, not 5 years (or less.) Sorry. And the search for yield will continue, as the older generation continues to solve their retirement income challenges that a high-savings, low-interest rate environment creates. Pension funds and life insurance companies will continue to struggle while they, too, search for that elusive combination of “high yield” and “safety.”
But we know where to find a great steak! No confirmation bias here! 🙂
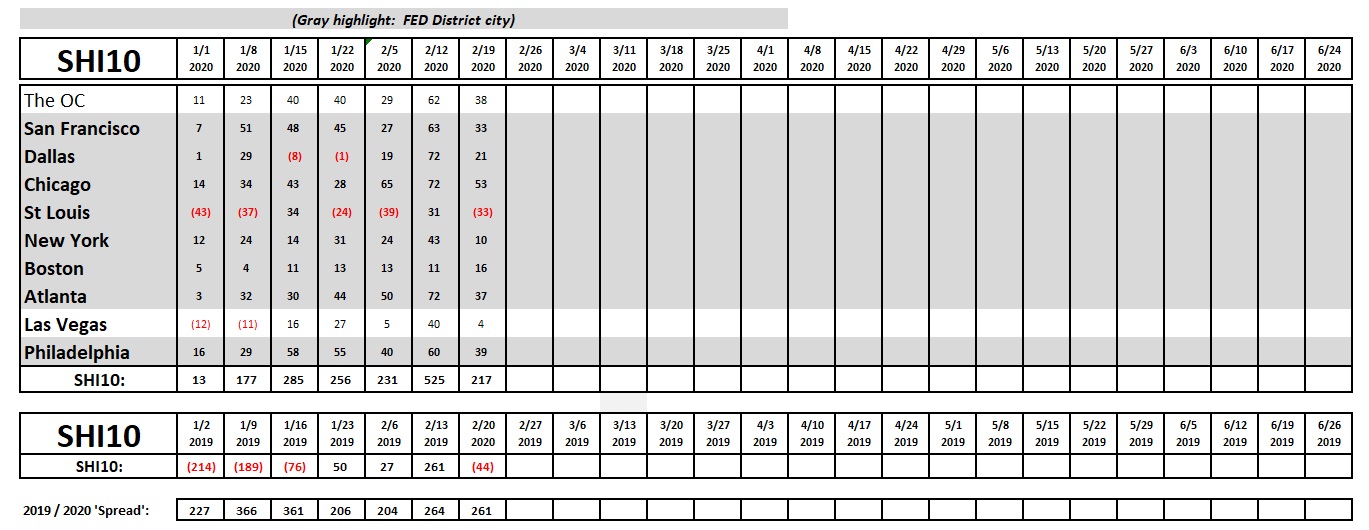
It looks like plenty of people know where to find a good, if not outrageously expensive, steak! While it’s clear Valentine’s Day is in the SHIs rear-view mirror, this weeks SHI10 reading remains quite strong. Reservation demand in St Louis fell of the map, unfortunately, but every other city in the index remains in the black. But it’s clear reservation demand for this Saturday, across the board, is down this week. Perhaps back to it’s trend level? It’s worth noting that the “spread” over 2018 is fairly consistent in the past two weeks, after a strong start earlier in the year. All in all, its clear to me reservation demand is strong at our pricey eateries. Here is the weekly tally:
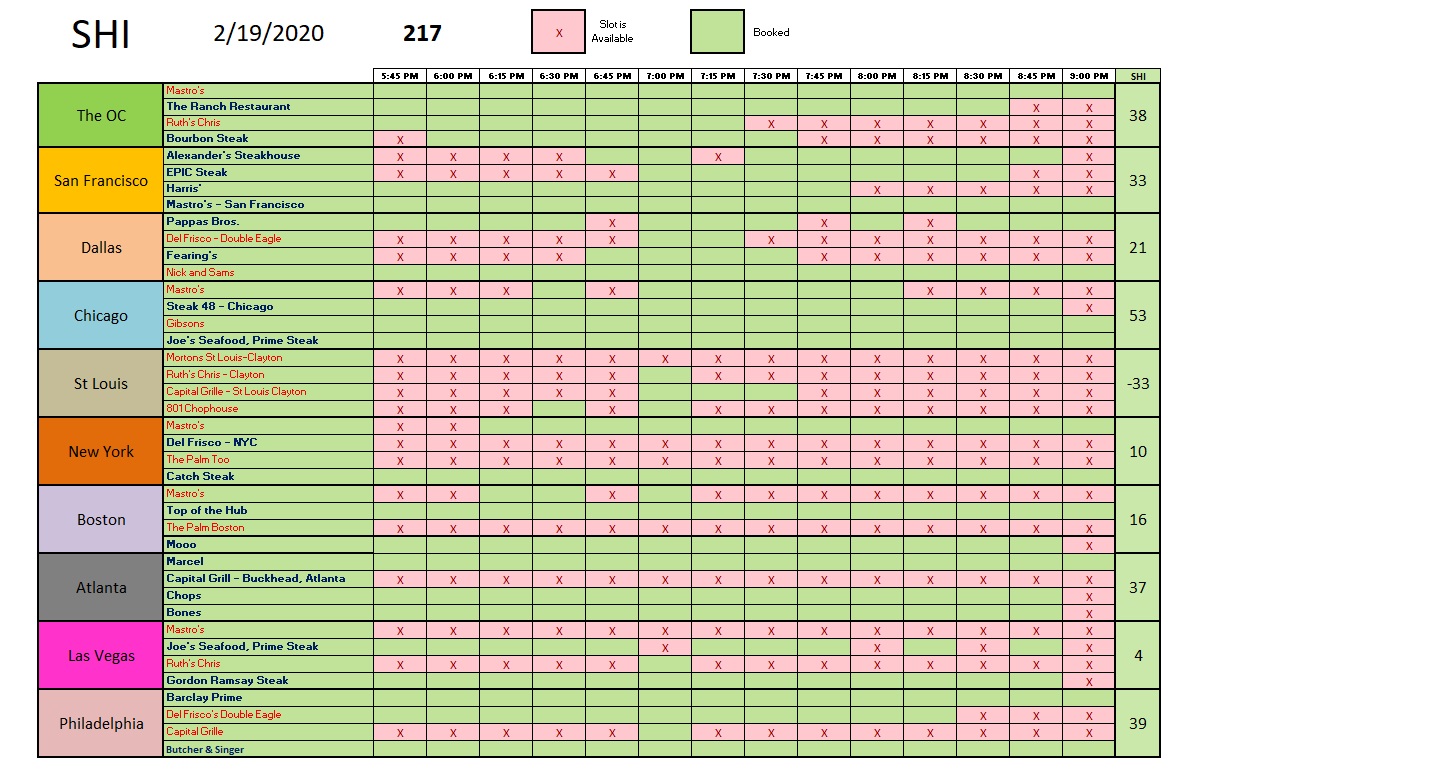
Chicago is living up to its reputation. Reservation demand in the OC is strong. Otherwise, it’s a checkered board.
All indicators are suggesting our economy remains steady, performing as one might expect in this 11th year of expansion, bolstered by a ‘friendly’ FED, but facing a few existential headwinds. Once again, steady as she goes.
– Terry Liebman


2 Comments
Terry, with all due respect, and after setting aside my incredibly well founded confirmation bias (much of which is supported by your valuable teachings), I can honestly say that you ARE always right. Except when you’re not. I’m certain your wife agrees with me.
Now I’m blushing. – T