
SHI 2.2.22 – This Doesn’t Happen Every Day

SHI 1.26.22 – “… What a Stupid Son of a Bitch.”
January 26, 2022
SHI 2.9.22 – Fun With Numbers!
February 9, 2022
Did you notice the SHI date above? 2.2.22? You don’t see that every day.
And with all the anxiety, FED fear, crypto-currency fluctuations, stock market gyrations and interest rate hand-wringing last week, you may have missed another seminal event too. Last Thursday, we learned that:
Real GDP grew at a 6.9% rate in Q4, 2021.
Wow. THAT IS STAGGERING. And I think most people missed it. Did you?
“
The US economy is on fire.“
“The US economy is on fire.“
Yes, the US economy is on fire. In a good way. Yeah, yeah, yeah, there are plenty of things to fret over, every day, but none of these change the fact that our economy is expanding at a rate not seen since Ronald Reagan was president. Remember him? 🙂
Of course not. You’re probably not old enough. Year over year, GDP in 2021 increased by 5.7% according the the US Bureau of Economic Analysis (BEA). US GDP hasn’t grown this much, year-over-year, since 1984 — almost 4 decades ago — during President Reagan’s first term as the US recovered from a long recession triggered by FED rate increases in an attempt to tame the run-away inflation of the 1960’s and 1970’s.
Here’s a fun fact: American’s last saw Halley’s Comet more recently than GDP growth at this rate. That’s right, the last time Halley’s Comet crossed our skies was 1986. I know you’re curious: It’s due back in 2061.
Welcome to this week’s Steak House Index update.
If you are new to my blog, or you need a refresher on the SHI10, or its objective and methodology, I suggest you open and read the original BLOG: https://www.steakhouseindex.com/move-over-big-mac-index-here-comes-the-steak-house-index/
Why You Should Care: The US economy and US dollar are the bedrock of the world’s economy.
But is the US economy expanding or contracting?
Expanding. Significantly. During 2021, nominal growth clocked in at $2.1 trillion. The US annual economic output was just under $23 trillion for the full year. The world’s annual GDP rose to about $95 trillion at the end of 2021. America’s GDP remains around 25% of all global GDP. Collectively, the US, the euro zone, and China still generate about 70% of the global economic output. These are the big, global players.
The objective of this blog is singular.
It attempts to predict the direction of our GDP ahead of official economic releases. Historically, ‘personal consumption expenditures,’ or PCE, has been the largest component of US GDP growth — typically about 2/3 of all GDP growth. In fact, the majority of all GDP increases (or declines) usually results from (increases or decreases in) consumer spending. Consumer spending is clearly a critical financial metric. In all likelihood, the most important financial metric. The Steak House Index focuses right here … on the “consumer spending” metric. I intend the SHI10 is to be predictive, anticipating where the economy is going – not where it’s been.
Taking action: Keep up with this weekly BLOG update. Not only will we cover the SHI and SHI10, but we’ll explore “fun” items of economic importance. Hopefully you find the discussion fun, too.
If the SHI10 index moves appreciably -– either showing massive improvement or significant declines –- indicating growing economic strength or a potential recession, we’ll discuss possible actions at that time.
The Blog:
Think about this achievement for a moment.
During a pandemic, the highest and lowest unemployment rates in — well forever — supply bottlenecks, commodity shortages, shipping and port disruptions, political firefights, global geopolitical instability, potential war in Asia, and ‘cancel culture’ … during all that and more … the US economy managed to grow at the fastest rate in almost 40 years. And it wasn’t just one area of the economy that grew. Almost all sectors experienced significant improvement.
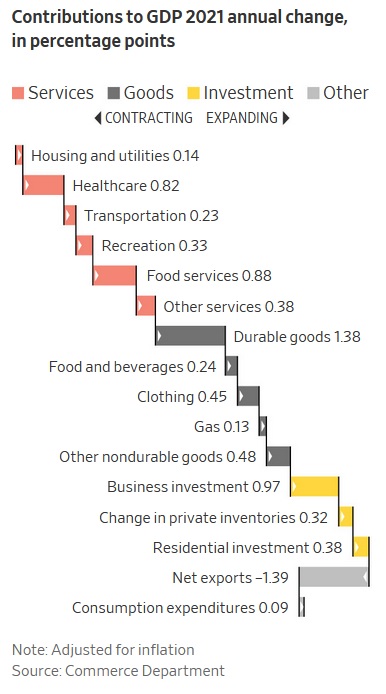
The graph to the right, courtesy of the Wall Street Journal, makes this clear. Take a look.
Durable goods — stuff that lasts more than 1-year (like a car, washing machine, etc) — saw the largest increase during 2021. ‘Business investment’ came in 2nd, followed by ‘Food services’ and ‘Healthcare.’
Remember: when we talk GDP, we’re talking “real” GDP. Meaning the 5.7% growth rate is the rate after adjusting downward for CPI inflation. Removing inflation from the calculation, meaning we’re talking ‘nominal’ or ‘Current-dollar’ GDP, we see that American’s economy expanded at a 10% rate during 2021. In nominal terms, America added $2.1 trillion in domestic economic output during 2021!
I’ve talked extensively about the difference between ‘real’ and ‘nominal’ from an economic perspective. I do so because the distinction is important. You and I live our lives in the nominal world. We pay for food using nominal dollars. We earn salaries in nominal dollars. We pay our mortgages with nominal dollars. In other words, we all experience inflation, but that doesn’t change the fact that the dollars we have and use are simply dollars. 100 cents each.
When was the last time you were in a store, at the cash register, preparing to pay for your purchase, and the cashier said to you, “OK, the total comes to 69.45 ‘real’ dollars.” Real dollars, you ask, what the heck are those. And shortly thereafter, you regret the question, because with a smug look the clerk then replies:
“Real dollars reflect the 2021 downward adjustment of 3.9% due to inflationary and the counter-effect of the PCE price index for the year; of course this also reflects seasonal adjustments and the final figure is quoted in chained 2012 dollars.”
That’s when you realize that while this rather erudite young lady may be working behind the counter, it is clearly a part-time job, because she must be attending Chapman University studying economics.
But, of course, this could never happen. Who the heck studies economics? No one studies economics! That’s crazy talk! 🙂
But if she actually did study economics, she’s knows that no one ever quotes consumer prices in ‘real’ terms — every price we see, for everything we buy, consume, invest in, or gamble, is done with nominal dollars. Inflation is a real thing, of course, and we see it every time we buy a gallon of milk or gasoline — using our nominal dollars — but while the word ‘inflation‘ is as ubiquitous and ever-present as ‘Omicron,’ the word remains poorly understood.
Inflation measures price changes in the ‘basket of goods’ making up the CPI index. The CPI is specifically designed to measure price changes in goods and services purchased for consumption. Note the word ‘consumption.’ That word is very different than the word ‘investment.’ The CPI does not measure price changes in things like homes, life insurance, stocks, bonds, industrial buildings, etc. Because those items are not consumed. Like cheese. Cheese is consumed. Changes in cheese prices are measured by the CPI. And apples. And eggs. And gasoline. And used cars. And we can’t forget steaks! Those are consumed too! I could go on and on … because the CPI measures monthly price changes in about 80,000 different consumed items. If you want to read more, right-click and open the following link in another tab:
https://www.bls.gov/cpi/questions-and-answers.htm
Returning to our GDP growth discussion, 2021 was a remarkable year. In one year, with all the headwinds, our economy grew by $2.1 trillion, to the level of just under $23 trillion. (If you look at the detail in the BEA charts, on table 3 you may notice this number: $23,992.4 billion … or almost $24 trillion. That number reflects the level of GDP if you annualized the 4th quarter results. It does not reflect the entire year’s actual results — but what a full year might look like if the economy grew for a full year at the Q4 rate. Sorry if this concept is a bit opaque … this is a difficult one to simplify.)
For the entire year, inflation aside, “personal consumption expenditures” were the star. Of the 5.7% real GDP growth, they clocked in at 5.30% — equally split between goods and services. Domestic investment — things like ‘non-residential’ structures and equipment — added another 1.67%. Which, if we do the math actually exceeds 5.7%. That’s because “net exports” negatively impacted 2021 GDP. Remember that net exports is a calculation — measuring the balance between US exports and goods imported. US imports far exceed exports during 2021, resulting in a ‘net exports’ number of negative 1.39% for the year. This may surprise you, but that long line of giant cargo ships in the LA and Long Beach harbors, waiting to unload their goods, does not increase America’s economic growth. As measured in the GDP calculation, significant increases in imports actually reduces GDP. At first blush, this may seem counterintuitive, but remember that GDP is Gross ‘DOMESTIC‘ Product. While the sale of an imported product might boost consumer spending, we have to remember that the product wasn’t produced in the United States.
Finally, government consumption was almost flat for the year.
Thus, once again, consumer consumption (of both domestic and imported goods) and domestic investment were the superstars in 2021. Yes, of course, consumer consumption was rocket-fueled by the trillions of dollars of US stimulus handouts, which is an entirely other discussion topic, but regardless of the reasons, and in spite of the headwinds, 2021 GDP growth was one for the record’s books.
Which suggests the steakhouses are full, right? After all, if the economy’s smoking hot, expensive steak house grills should be too. But this Saturday, many are near empty. In Boston, NYC and Philly, you can get almost any table you want this Saturday. Dallas, also, has far more reservation slots open this Saturday that I expected. Odd…..
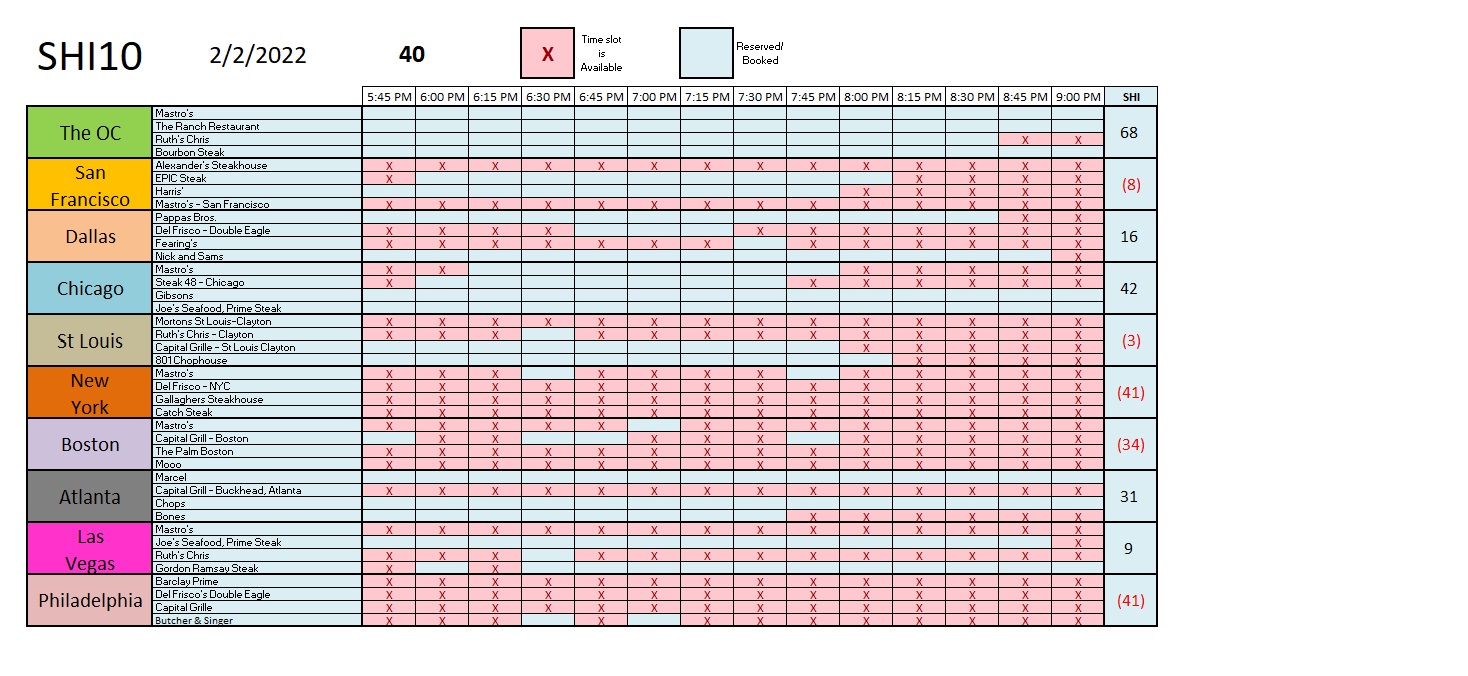
And then it hit me like a cold front: The economy and steak house grills may be hotter than a pistol, but the weather in parts of the country is downright dreadful and frigid. They’ve had sub-zero temperatures and piles of snow in the east, and more of the same is forecast for Texas and the east coast. Could weather be the reason for this week’s poor SHI showing? Perhaps. Here’s the longer term trend.
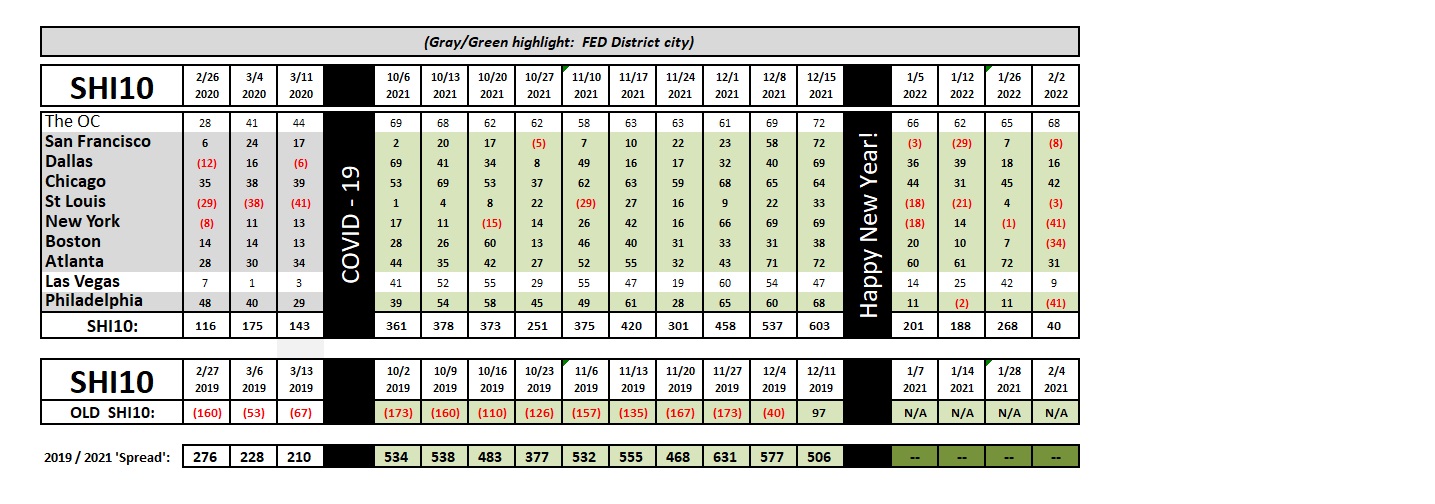
This week’s SHI reading of 40 is extremely weak. I find it hard to believe it correlates with current economic conditions … but time will tell.
Here’s a question to consider: Will we see a similar, massive GDP reading in 2022? Might we see a repeat of 2021 this year?
Unlikely. In my opinion. Why? Well, in the past year or so, governments across the globe handed out trillions of dollars in pandemic-inspired stimulus. Like the pig thru the python, those trillions of dollars are working their way thru global marketplaces — both consumption and investment marketplaces. Inasmuch as that governmental largess is unlikely to repeat itself any time soon, once those dollars are digested, the US economy should return to its longer term trend-lines. It’s unlikely GDP growth in 2022 will reach the heady levels of 2021. This image, again courtesy of the Wall Street Journal, can help visualize what happened in the past …
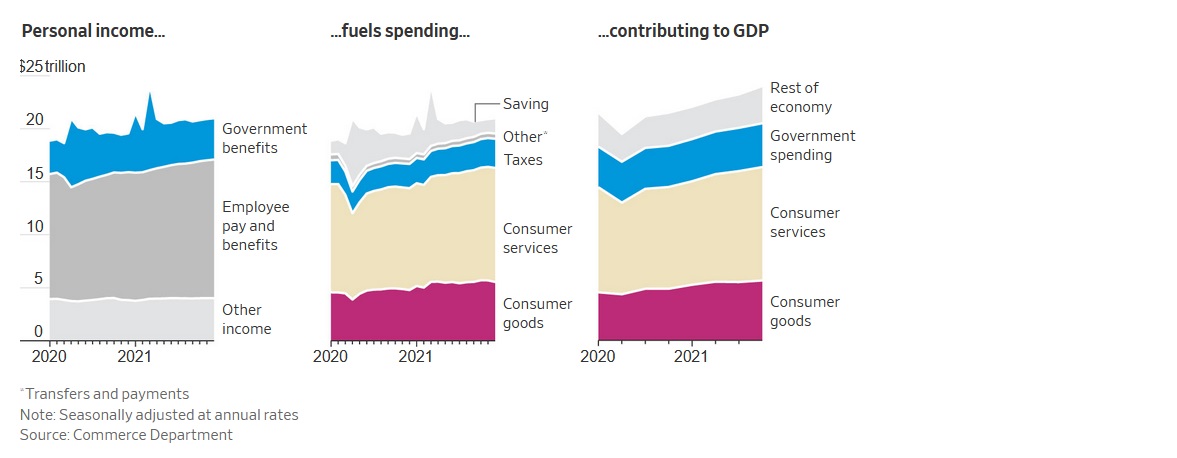
… but it won’t predict what WILL happen to GDP as the “government benefits” evaporate in coming years. If real GDP exceeds 3.5% in 2022 and 2.5% in 2023, I would be pleased. Time will tell. But whatever happens in coming years, keep in mind that current levels of US GDP, consumer prices, and the cost of labor (workers) have all reached new plateau levels. Plateaus that I expect will establish a new bottom … a new low point. In my opinion, it is unlikely any will return to pre-pandemic levels … but all should revert to the mean in the coming years. Don’t fret: Annual GDP growth in the 2% range is realistic … and that’s a pretty robust level when beginning at $23 trillion!
Of course, I could be wrong. The US economy could continue to grow like a weed. But I think we are more likely to see Halley’s comet again before we see real US GDP growth near 6%. 🙂
<:> Terry Liebman


