
SHI 2.9.22 – Fun With Numbers!

SHI 2.2.22 – This Doesn’t Happen Every Day
February 2, 2022
SHI 2.16.2022 – A War of Words
February 16, 2022
Superbowl Sunday is almost here. Will you watch the game?
Of course you will. And so will another 100 million or so Americans. Did you know that superbowl viewership peaked in 2015? That year, almost 115 million people watched the game on TV. Last year the number was only slightly over 91 million, the lowest number since 2007. This year, I expect a bunch of Steak House Index affectionarios to shun TV and go to the game. Why? Because only the rich … the famous … or those with an exceptionally high credit-card limit are going to see the game at Sofi Stadium. Tickets are EXTREMELY expensive this year. Just like that perfectly grilled T-bone at Mastros. 🙂
“
What’s the economic impact of a Superbowl?“
“What’s the economic impact of a Superbowl?“
For the host city, it’s a lot. Billions is probably the answer. Airlines, hotels, restaurants, UBER, the stadium, etc, all get a piece of the pie. And this year the pie is quite big. Beginning with the stadium itself. According to ticketiQ:
-
<.> The cheapest single ticket available right now is $5,735
-
<.> The cheapest lower-level ticket is $8,754
-
<.> The average ticket price for all tickets is $9,193
-
<.> The most expensive single-ticket is $906,795 for a 24-Person Suite.
Which means Superbowl fans, in attendance at the 70,240 seat capacity Sofi Stadium, might spend over
$645 million
just for seats. For just one football game. Wow.
The average pro football game lasts 3 hours and 12 minutes. Which means attendees will pay about $200 million per hour, collectively, to view the game from a stadium seat. Or about $3.3 million per minute … and just under $56,000 per second. Not counting food, drinks and swag, of course. Dinner for 4 at Mastros is cheap by comparison! 🙂
Welcome to this week’s Steak House Index update.
If you are new to my blog, or you need a refresher on the SHI10, or its objective and methodology, I suggest you open and read the original BLOG: https://www.steakhouseindex.com/move-over-big-mac-index-here-comes-the-steak-house-index/
Why You Should Care: The US economy and US dollar are the bedrock of the world’s economy.
But is the US economy expanding or contracting?
Expanding. Significantly. During 2021, nominal growth clocked in at $2.1 trillion. The US annual economic output was just under $23 trillion for the full year. The world’s annual GDP rose to about $95 trillion at the end of 2021. America’s GDP remains around 25% of all global GDP. Collectively, the US, the euro zone, and China still generate about 70% of the global economic output. These are the big, global players.
The objective of this blog is singular.
It attempts to predict the direction of our GDP ahead of official economic releases. Historically, ‘personal consumption expenditures,’ or PCE, has been the largest component of US GDP growth — typically about 2/3 of all GDP growth. In fact, the majority of all GDP increases (or declines) usually results from (increases or decreases in) consumer spending. Consumer spending is clearly a critical financial metric. In all likelihood, the most important financial metric. The Steak House Index focuses right here … on the “consumer spending” metric. I intend the SHI10 is to be predictive, anticipating where the economy is going – not where it’s been.
Taking action: Keep up with this weekly BLOG update. Not only will we cover the SHI and SHI10, but we’ll explore “fun” items of economic importance. Hopefully you find the discussion fun, too.
If the SHI10 index moves appreciably -– either showing massive improvement or significant declines –- indicating growing economic strength or a potential recession, we’ll discuss possible actions at that time.
The Blog:
Numbers are fun.
Typically. But this number isn’t very much fun: The United States national debt just surpassed the $30 trillion mark. That’s right. Thirty. Trillion. Dollars.
Many economists and commentators will try to diminish the magnitude of this pile of debt with comments like:
“Sure $30 trillion is a lot, but only about $23.5 trillion is ‘debt held by the public.'” That’s correct: A shade under $6.5 trillion is actually intragovernmental holdings — debt owed from one US agency to another.
Or, you might hear:
“Sure, $30 trillion is a lot, but that number has never been adjusted for inflation.” Correct again. This is not a “real” number, but nominal.
Or …
“The debt actually owned by the public is only 100% of the US GDP.”
And that would be correct again. You’ll recall that US GDP was about $23 trillion in 2021.
But regardless of the justification or lens, I can say without equivocation, no matter how you look at it, that is one huge pile of debt. No, our national debt has never been higher. Nor, has the interest cost to carry that debt ever been lower. I’ve used the word unprecedented so often in the past few years that I feel I’ve blunted the meaning … but once again I must use it. Our national debt level is unprecedented. Of course, we all know why we’re here now. Mostly Covid. Or more precisely, the US response to the Covid pandemic, piled atop an already huge debt load. But regardless of why we’re here, or how we got here, we’re here. So now, we ask, what do we do now? Anything?
Sure. Increase it again. Yes, the White House is projecting a budget deficit of $1.66 trillion in 2022. 🙂
Should we be worried? Sure. I am. I worry about our future as a country. And as this “American experience” is not unique to America, I worry about global debt levels.
Yesterday I was the invited speaker for a business group. One of the attendees mentioned that the US had passed the $30 trillion debt milestone and asked me these questions, “Why is the FED trying to bring down inflation? Shouldn’t the FED be pro-inflation inasmuch as higher inflation rates make it easier to repay this debt?” Great questions. I wish I could say yes, but, alas, the FED is unfortunately national-debt agnostic. They just don’t care. Their mandate is price stability and full employment … not keeping debt levels in check. Perhaps it should be … but that job, in theory, is in the hands of the White House and our legislators. That’s where the annual budget originates … and that’s where deficits or surpluses are born. And since a fairly large number of Senators and Congresspeople appear to support the principals of Modern Monetary Theory, deficits have always been more common than surpluses.
Hey, since numbers are supposed to be fun today, let’s stop all this depressing talk and take a look at a really cool — and relatively accurate — image and website.
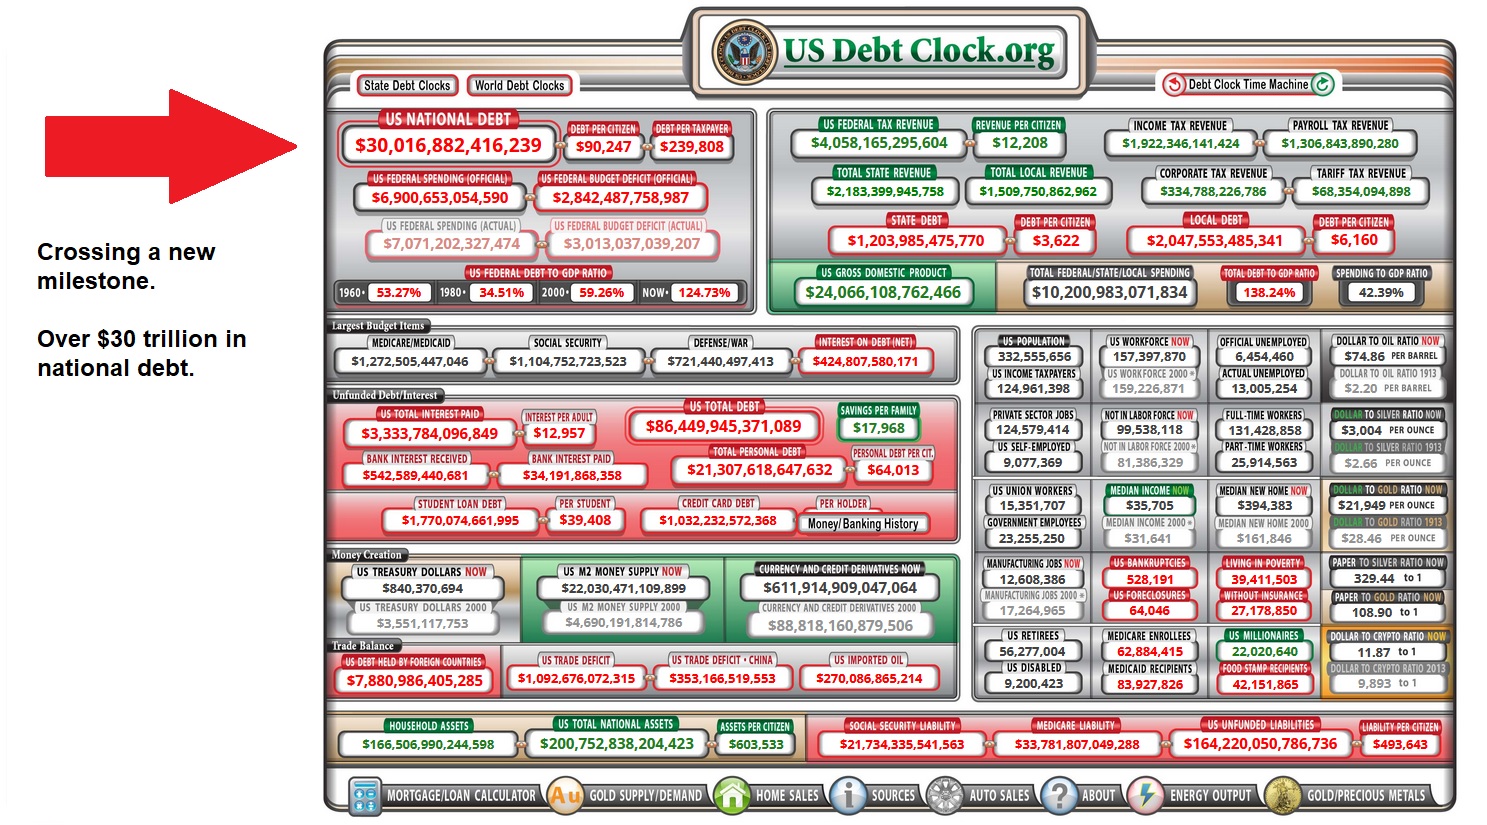
I clipped this screen shot from this website. I suggest you right-click and open it in a new tab: https://www.usdebtclock.org/
First, you’ll notice the numbers today are slightly higher on the website. The image above is from a few days ago. But even then, the “US NATIONAL DEBT” number shown was slightly overstated. I checked it at the source, a website called “Debt to the Penny,” a product of the US Treasury. As you can see on their site, the number is a bit lower (right-click, open in a new tab) … take a look: https://fiscaldata.treasury.gov/datasets/debt-to-the-penny/debt-to-the-penny
But no matter how you slice it, our national debt now exceeds $30 trillion. Moving on, the US Debt Clock site has some other fun numbers. For example, you can watch people being born! Well, not their actual birth, but you can watch the “US POPULATION” number increase. 3 people have been born since I began typing this paragraph! Take a look at the “US M2 MONEY SUPPLY NOW” box … and, at the same time, the number shown for the year 2000. Pretty staggering, right? If you’re wondering why asset prices are high, and consumer inflation is a problem, you needn’t look any further than right there.
The chart has a number of other fun or interesting numbers. Take your time and thread your way thru. I think you’ll find it worthwhile.
My point? Simply this: Money isn’t worth what it used to be. Obviously. Inflation is a real thing … and it has significantly lifted the cost of almost everything around us. So, thru this lens, should we be worried about a $30 trillion debt load? I’ll leave that answer to you.
Ray Dalio, a US billionaire investor and hedge-fund manager, in his book entitled “Principles for Dealing with THE CHANGING WORLD ORDER,“ seems to suggest we shouldn’t worry about it. Not necessarily because it’s not worth worrying about, but because the rise and fall of nation-states is inevitable. Here’s an image I copied from his book to prove his point … yes, the patterns looks as though a bunch of multi-colored snails slithered across the page, leaving these colorful trails, without direction or purpose. Take a look:
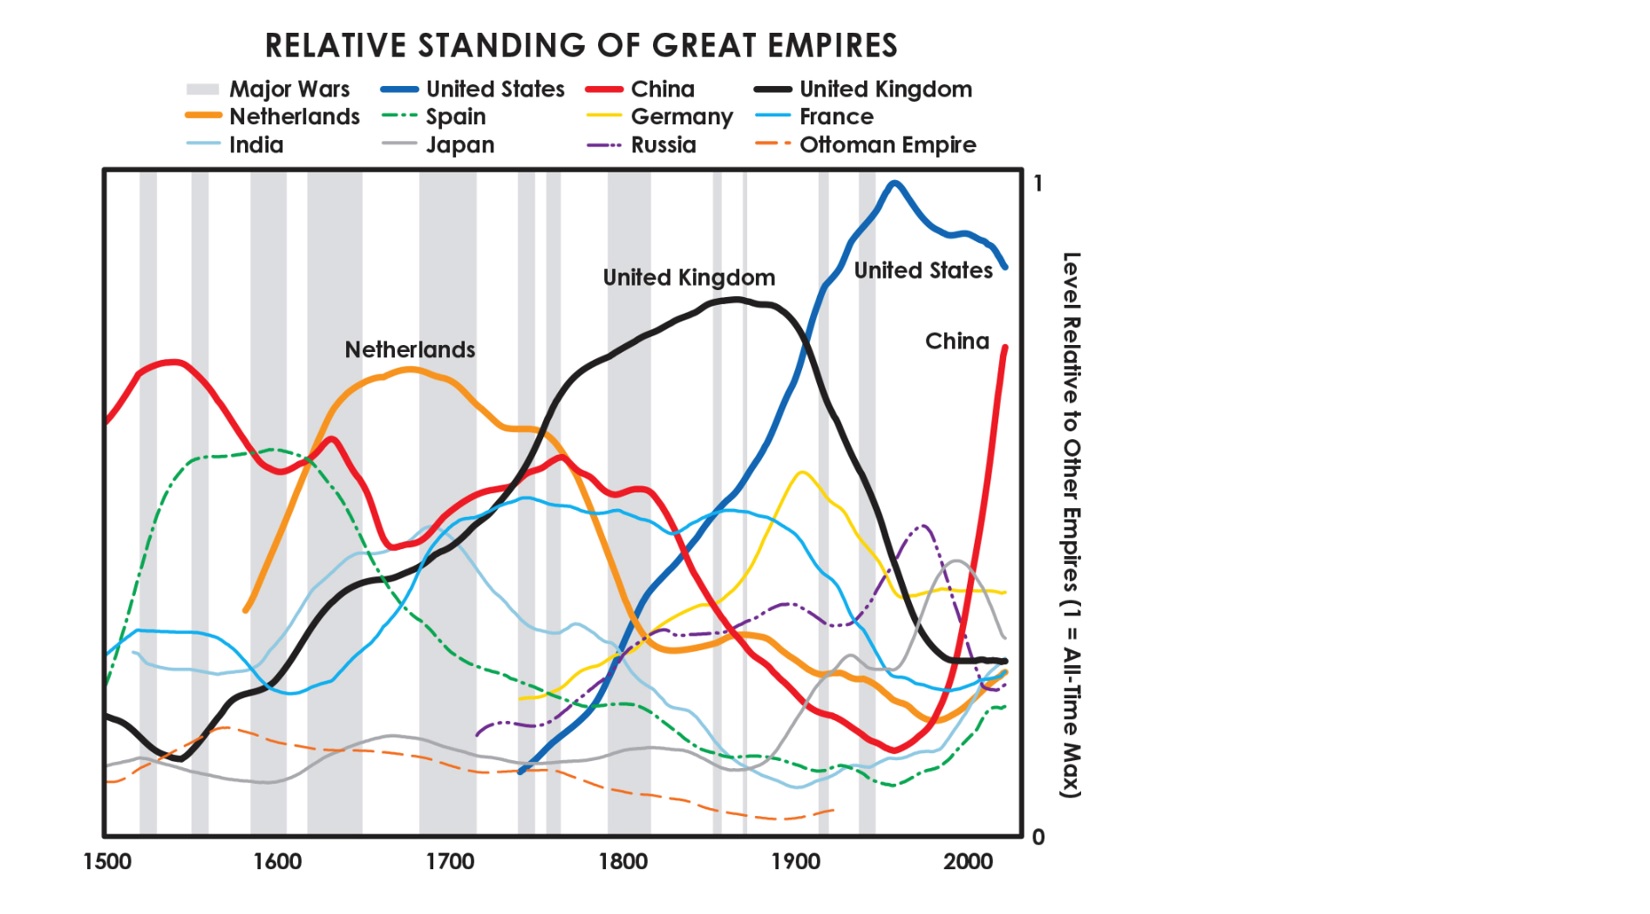
As you can see in this 500-year chart, before the US dollar became the world’s reserve currency post-WW2, the United Kingdom’s currency, the pound, was preeminent. And centuries before that, the Netherland’s guilder was the world’s reserve currency. I’m sure you noticed that the “Relative Standing” of the United States, according to Dalio, has been declining since around the year 2001 … which, perhaps not ironically, is the year China became transcendent. What else happened in 2001? Yes, that was the year of “2001: a Space Oddessy.” But it was also the year that China joined the WTO and quickly became a manufacturing — and exporting — powerhouse.
The take-away? From his book, I get the sense that Mr. Dalio believes that (1) things change and (2) change is inevitable. Over time. So, perhaps, the essential message here for us all is don’t worry, be happy. Not such a bad message, right?
But in the interim, we still have to figure out how to manage our money, our businesses, our families and our lives. So here at the Steak House Index we will remain focused and vigilant. We will not be deterred by inevitability — we’re here for you, our loyal reader! 🙂
And with that, we’ll head to the steakhouses. After a soft showing last week, will the SHI rebound today? I know! The excitement is palpable!
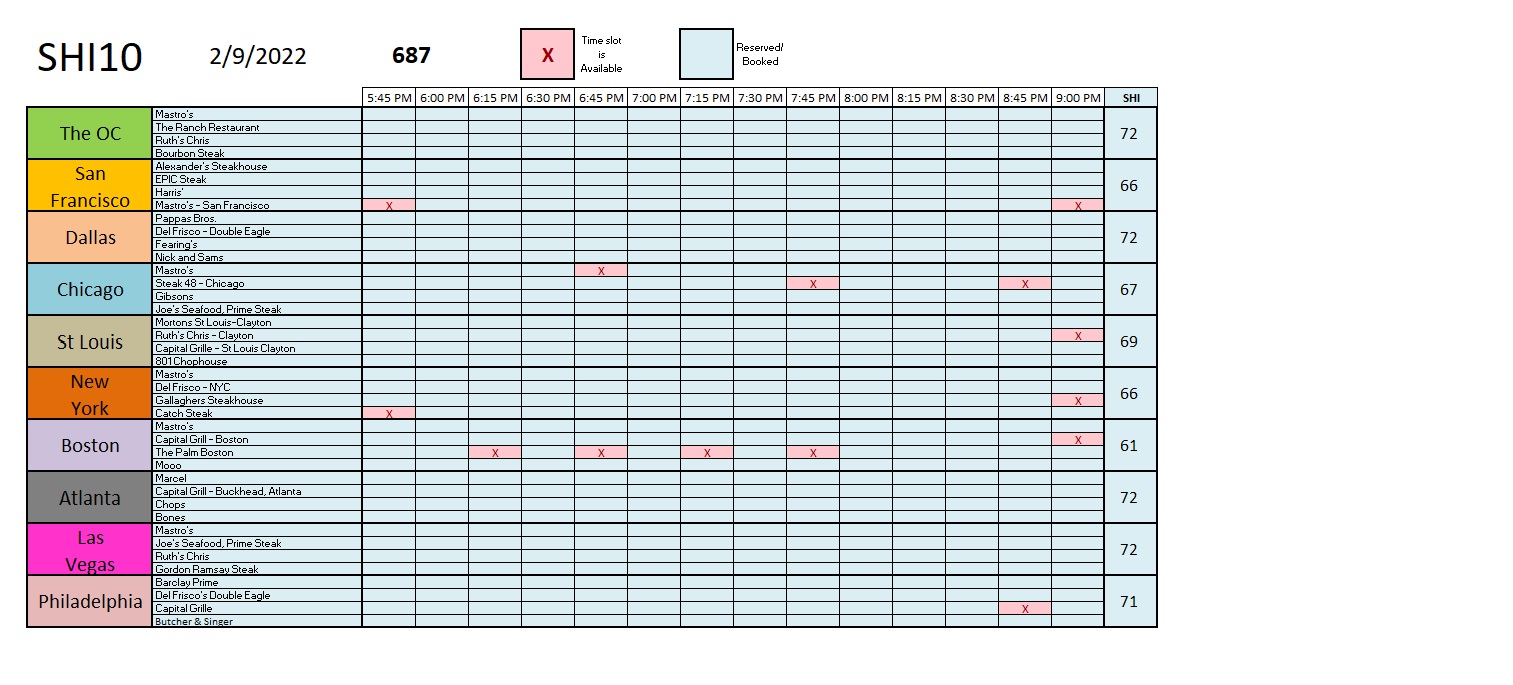
And for good reason! Check out this week’s SHI10 number: A whopping 687! Wow! That’s a first. I believe that’s the highest SHI10 reading we’ve ever seen. Remember: The maximum reading — if all our 40 SHI restaurants were fully booked for Saturday — is 720. Three of our ten markets are fully booked for Saturday. And very, very few tables are available at the other 7. Amazing. Even with beef prices up everywhere, expensive eatery prime steaks are flying off the grill all across America. Here’s the longer term trend … take a look:
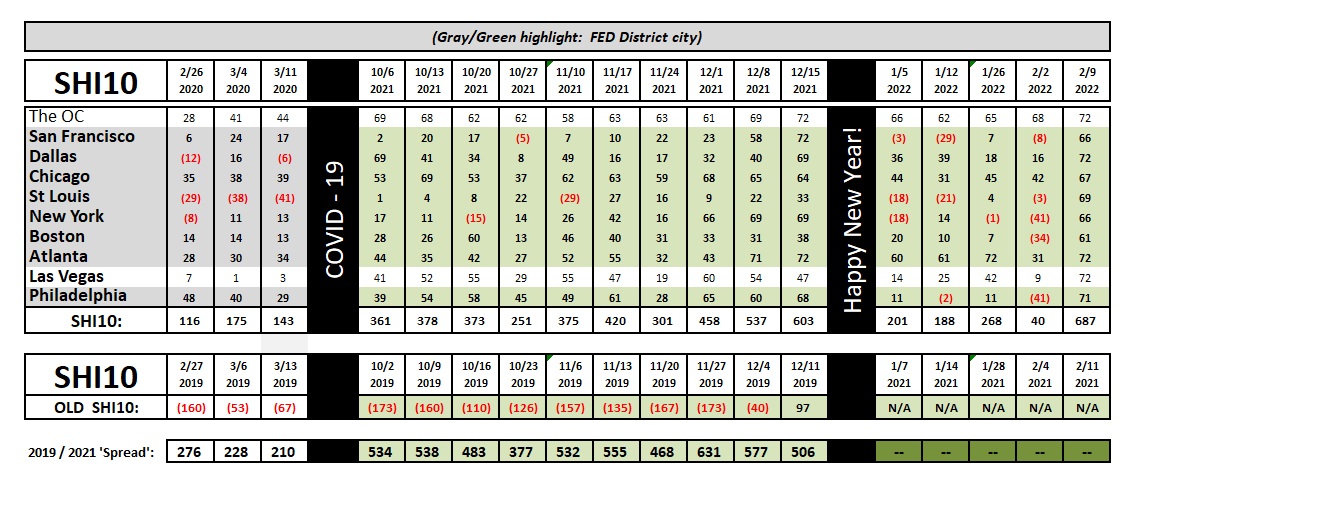
Amazing. From an SHI10 reading last week of 40, this week’s number is simply staggering. Sure, last week folks stayed in their warm homes while bad weather made travel difficult in much of the US. And this weekend, many are sure to be celebrating Valentines Day with their sweetheart. But by any measure, and for whatever reason, the steakhouses are cooking this Saturday! As measured by reservation correlation, the US economy is cooking too!
The latest CPI reading will make its debut tomorrow, Thursday, at 5:30 am PST. Will the 2021 trend reverse … or will the CPI stay at it’s lofty levels? Be the first on your block to be in the know! Get up early and check! Here’s the hyperlink to the report site: https://www.bls.gov/cpi/
<|> Terry Liebman


