
SHI 2.20.19 – Forget GDP … America Should Measure GNH!

SHI 02.13.19 – Hungary is Hungry … for Children
February 13, 2019
SHI 2.27.19 – Crosscurrents and Conflicting Signals
February 27, 2019
“It’s been said money can’t buy you happiness … which is why they don’t measure economic growth in Bhutan. They measure happiness.”
“Don’t Worry, Be Happy.” Everyone knows this one. But in Bhutan, they take this expression seriously. Very seriously. But not so seriously it impacts their happiness. Look at the happy kids in the image above!
High in the Himalayas, above 8,000 feet, between India and China, Bhutan is home to about 735,000 people. Bhutan’s economic model has incorporated Buddhist philosophy since the early 1970s. The core values of this philosophy include preserving the environment and emphasizing the role of happiness and collective well-being in peoples’ lives.
So they don’t focus on ‘Gross Domestic Product’ growth in Bhutan. Their driving concept is ‘Gross National Happiness’ or GNH. They have created a GNH index that they use to guide public Bhutan policymaking.
Most Bhutanese are vegetarians … so I doubt they follow my Steak House Index blog. That’s OK. As long as they’re happy. 🙂
Welcome to this week’s Steak House Index update.
If you are new to my blog, or you need a refresher on the SHI10, or its objective and methodology, I suggest you open and read the original BLOG: https://www.steakhouseindex.com/move-over-big-mac-index-here-comes-the-steak-house-index/
Why You Should Care: The US economy and US dollar are the bedrock of the world’s economy. This has been the case for decades … and will continue to be true for years to come.
Is the US economy expanding or contracting?
According to the IMF (the ‘International Monetary Fund’), the world’s annual GDP is about $80 trillion today. US ‘current dollar’ GDP now exceeds $20.66 trillion. In Q3 of 2018, nominal GDP grew by 4.9%. We remain about 25% of global GDP. Other than China — a distant second at around $12 trillion — the GDP of no other country is close.
The objective of the SHI10 and this blog is simple: To predict US GDP movement ahead of official economic releases — an important objective since BEA (the ‘Bureau of Economic Analysis’) gross domestic product data is outdated the day it’s released. Historically, ‘personal consumption expenditures,’ or PCE, has been the largest component of US GDP growth — typically about 2/3 of all GDP growth. In fact, the majority of all GDP increases (or declines) usually results from (increases or decreases in) consumer spending. Consumer spending is clearly a critical financial metric. In all likelihood, the most important financial metric. The Steak House Index focuses right here … on the “consumer spending” metric. I intend the SHI10 is to be predictive, anticipating where the economy is going – not where it’s been.
Taking action: Keep up with this weekly BLOG update. Not only will we cover the SHI and SHI10, but we’ll explore related items of economic importance.
If the SHI10 index moves appreciably -– either showing massive improvement or significant declines –- indicating growing economic strength or a potential recession, we’ll discuss possible actions at that time.
The BLOG:
To establish the indicators in the GNH index, the Center for Bhutan Studies developed a detailed questionnaire covering the nine key “domains” considered crucial for reflecting the values and principles of national happiness:
- psychological well-being,
- health,
- time use,
- education,
- culture,
- good governance,
- ecological resilience,
- community vitality, an,
- living standards.
And interestingly enough, as Bhutan’s ‘Gross National Happiness’ increased, so did their GDP! Take a look at this chart, courtesy of the International Monetary Fund (IMF):
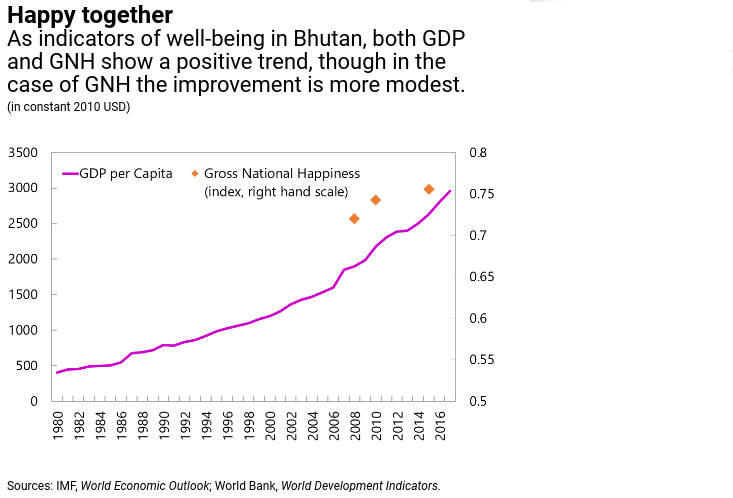
The ‘Gross National Happiness’ index is reflected by the gold-colorered diamonds. I find it interesting that GDP per capita is growing faster that GNH — fully supporting the belief that money does not — in fact — buy happiness. If it did, we’d expect to see a similar growth rate in both, right? But as GDP is growing faster in Bhutan than GNH, clearly money does not buy happiness. Too bad.
If you’re interested in reading more on this topic, check out the IMF Working Paper: https://www.imf.org/en/Publications/WP/Issues/2019/01/17/Gross-National-Happiness-and-Macroeconomic-Indicators-in-the-Kingdom-of-Bhutan-46460
Here’s something to be unhappy about: Negative-yielding government bonds.
The outstanding balance has increased 21% since October, reversing a steady decline that took place over the course of 2017 and much of last year, according to data from Merrill Lynch. Negative-yielding sovereign debt peaked at about $13 trillion in 2016, according to Bank of America, about 25% of all sovereign debt.
You’ll recall a security with a negative yield guarantees the owner will receive less in repayment and periodic interest than they originally paid when the security was issued. That can’t make the holder happy. Yet they do it. Why? Because these traders believe a slowing global economy will cause rates to begin a declining trend once again. If rates do, the value of the underlying bond will increase. That’s why. Here’s a great chart, courtesy of the Wall Street Journal:
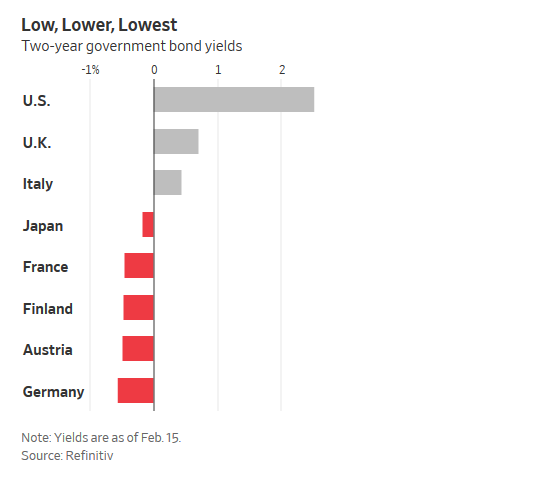
I continue to be amazed that investors in the “red” countries above would buy a 2-year bond that will return less than the original purchase price when the bond pays off. But they do.
I agree with ML and BofA’s reasons behind the recent surge in the quantity of negative yielding bonds. There is a general sense, across the globe, that economies are slowing. Europe is definitely slowing. Japan is slowing. It appears China is also slowing, in spite of the fact that precise and accurate data is hard to find. Every major economic resource — including the IMF, the World Bank and the BIS — believes the global economy is slowing. Slowing, mind you, doesn’t mean recession. It simply means the higher previous growth rates are shrinking. Of course, in Bhutan, they don’t care … because they’re happy! But we money-grubbing capitalists care! Right?!? Darn those happy Bhutanese! 🙂
All right, you fellow capitalists, let’s get happy! Cheer up and follow me to the steakhouses!
You’ll recall last week was an all-time high for the SHI: With a reading of 261, our opulent, expensive steak houses were cheering. If last year’s trend holds, this week those same pricey eateries might be groaning … since all those young (or young-at-heart) lovers blew a month’s disposable income last Saturday at Mastros. Let’s see how this reservation demand looks this week:
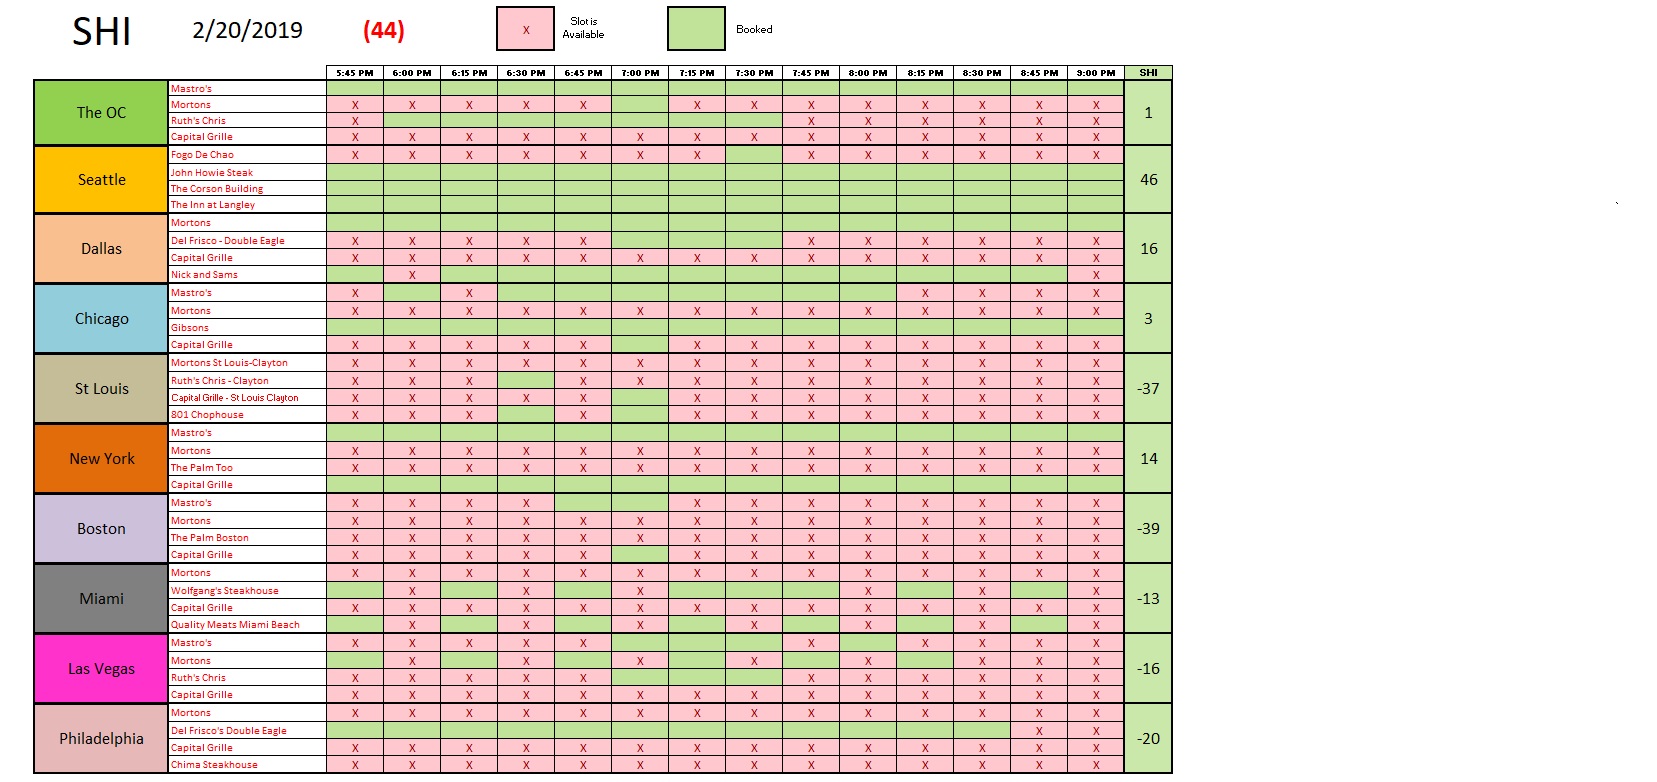
As expected, reservation demand is down across the board. As you’ll see below, this week’s SHI10 reading of (44) is very much in line with this week’s result back in 2018. Reservation demand held up fairly well in the east coast cities of New York and Philly, but fell off the map in Boston. St Louis, too, experienced a large decline in demand.
That said, I believe the decline in demand is more of a ‘reversion to the mean’ than a severe drop. As we can see from the data below, last week was the outlier. Not this week. Here’s the longer term trend report:
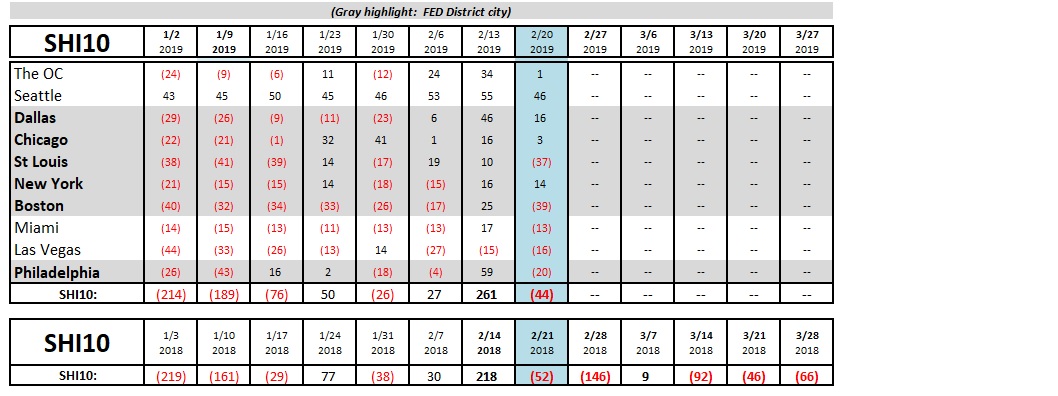
Once again, the SHI data supports consistent consumer spending patterns. I see nothing in this data to suggest consumers are changing their behavior.
– Terry Liebman


