
SHI 2.7.18: Bonds, Bunds and Gilts

SHI 1.31.18: Pirates in China
January 31, 2018
SHI 2.14.18 Happy Valentines Day
February 15, 2018
Central banks in the US, Europe and Japan own a mountain of financial assets. Now, the mountains are growing slower and in some cases, shrinking. These actions, and a few wildcards, are changing the playing field.
At the end of January, the FED, European Central Bank (ECB) and the Japan Central Bank (JCB) — combined — owned $14.3 trillion of assets. A veritable mountain of assets.
The FED is shrinking their $4.5 trillion balance sheet, albeit very slowly. Currently, they are not reinvesting pay-offs up to about $20 billion a month. This amount will become $30 billion per month shortly. The ECB announced they may soon slow their ‘stimulus’ buying of bonds early this year, assuming the European economy continues to strengthen. And early in January the Bank of Japan announced they were reducing their purchases of longer-dated bonds.
Combine the effect of these actions with the likely larger US deficits caused by the new tax bill and the global debt markets took notice. Why?
In a word, supply.
Welcome to this week’s Steak House Index update.
If you are new to my blog, or you need a refresher on the SHI10, or its objective and methodology, I suggest you open and read the original BLOG: https://www.steakhouseindex.com/move-over-big-mac-index-here-comes-the-steak-house-index/
Why You Should Care: The US economy and US dollar are the bedrock of the world’s economy. This has been the case for decades … and will continue to be true for years to come.
Is the US economy expanding or contracting?
According to the IMF (the ‘International Monetary Fund’), the world’s annual GDP is almost $80 trillion today.
During the calendar year 2017, US nominal GDP increased by $833 billion … by an amount approximately equal to the market capitalization of Apple. At the end of 2017, US ‘current dollar’ GDP was about $19.749 trillion — about 25% of the global total. Other than China — a distant second at around $11 trillion — no other country is close.
The objective of the SHI10 and this blog is simple: To predict US GDP movement ahead of official economic releases — an important objective since BEA (the ‘Bureau of Economic Analysis’) gross domestic product data is outdated the day it’s released.
Historically, ‘personal consumption expenditures,’ or PCE, has been the largest component of US GDP growth — typically about 2/3 of the total. In fact, the majority of all US GDP increases (or declines) usually result from (increases or decreases in) consumer spending. This is clearly an important metric. The Steak House Index focuses right here … on the “consumer spending” metric.
I intend the SHI10 is to be predictive, anticipating where the economy is going – not where it’s been. Thereby giving us the ability to take action early.
Taking action: Keep up with this weekly BLOG update. Not only will we cover the SHI, but we’ll explore related items of economic importance.
If the SHI index moves appreciably -– either showing massive improvement or significant declines –- indicating growing economic strength or a potential recession, we’ll discuss possible actions at that time.
The BLOG:
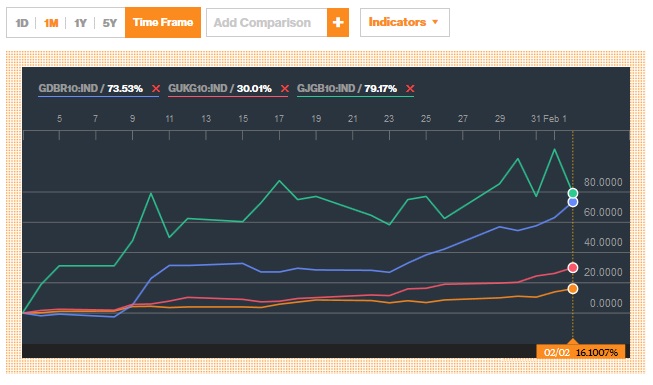
Supply fears. That’s your culprit. Since the beginning of the year, long-term interest rates around the globe have shot up. Take a look:
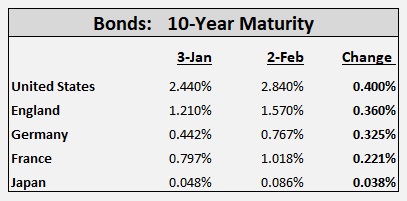
Here’s an interesting bond yield comparison chart courtesy of Bloomberg. The chart shows the percentage increase in the yield of 10-year securities from the US, over their January 3rd yields. Said another way, yields in Japan have increased by 79.17% — but the actual increase was from .048% to .086% (see above). Here’s the chart:
Here is the most recent update of central bank asset holdings, courtesy of Dr. Edward Yardeni (https://www.yardeni.com/pub/peacockfedecbassets.pdf)
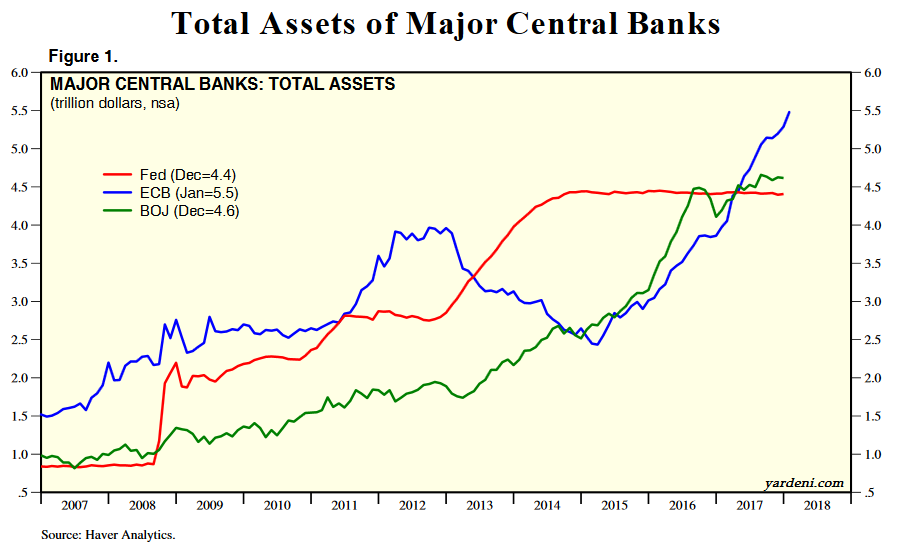
Did you notice? Look at that blue line: The ECB now owns about $5.5 trillion in assets — more than the FED by $1 trillion! Into this bubbling cauldron, throw in anticipated deficits from the new tax act, and a dash of inflation fear, and VIOLA! Suddenly, the 10-year Treasury is 2.9%.
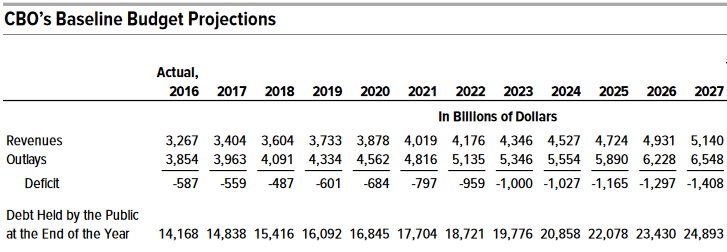
Why? Well, add it up: By the time the FED hits their stride, and reduces their asset purchases by about $600 billion a year; the ECB reduces their purchases by $360 billion a year; Japan, well, no true reduction there; and, per the Congressional Budget Office (CBO), by 2023 the US annual deficit will exceed $1 trillion. That’s about $2 trillion ANNUALLY of new supply. Here’s the CBO deficit forecast:
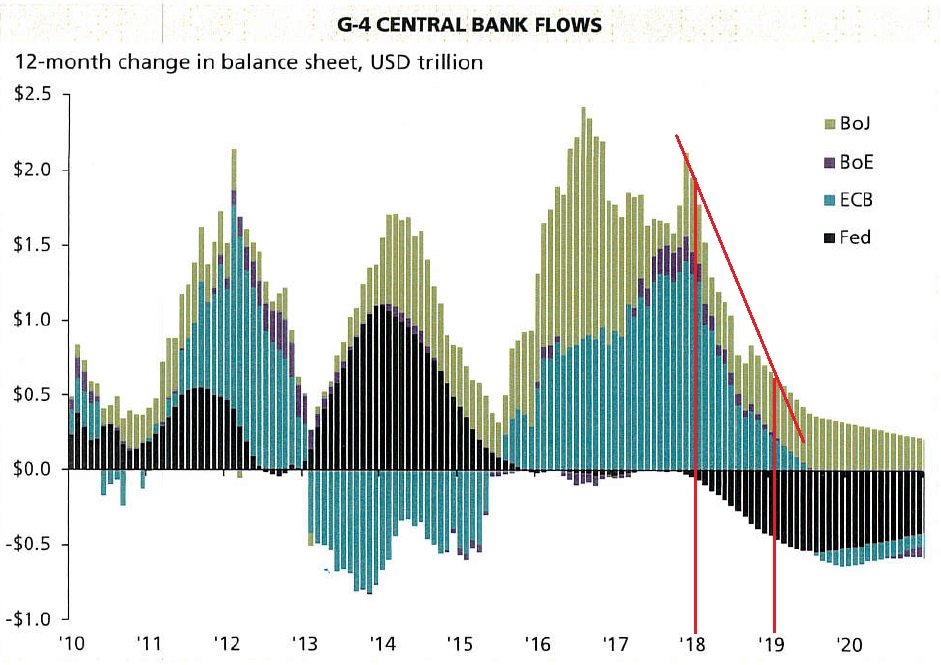
A $2 trillion per year increase isn’t chickenfeed. On the other hand, as the sovereign debt marketplace is about $80 trillion in total, it’s only about a 2.5% increase. But it is meaningful. As the chart below, courtesy of our friends at JPM Chase, demonstrates. I’ve added the red lines — they help show direction.
At the beginning of this year, central banks in the US, Europe, England and Japan were adding securities at a rate of about $2 trillion per year to their already sizable balance sheets. By the end of 2018, this graphic suggests only Japan will continue their prior pace of acquisition. The ECB will be winding down to almost zero … and the FED will be shrinking.
Supply fears, and a dose of inflation fears. These are your culprits. Fear is behind the spike in rates — here and abroad.
Are the fears justified? Perhaps. Frankly, I continue to believe the US deficit problem is the greatest ‘fear generator’ among bond investors. It certainly is for me.
I remain concerned the new tax act will dramatically reduce the ‘Revenues’ received by the Treasury. Remember, historically ‘Revenues’ have tended to be about 18% of the nominal GDP for the year (plus or minus a percent). With nominal GDP near $20 trillion, a forecast of $3.6 trillion in ‘Revenue’ by the CBO during 2018 (see the chart above) is historically accurate.
But right now, as you read this blog, CPAs and tax attorneys across the country are combing thru and dissecting the new tax act, looking for ways to reduce their clients’ tax bill. I believe they will be successful. Now, suppose the collection rate falls a bit, say, to 16%. As a result, Treasury ‘Revenues’ will fall by $400 billion in 2018 — to $3.2 trillion in total. In which case, the deficit in 2018 will NOT be a shade under $500 billion but closer to $900 billion. Ouch. I really, really hope I’m wrong.
Phew. I need a steak.
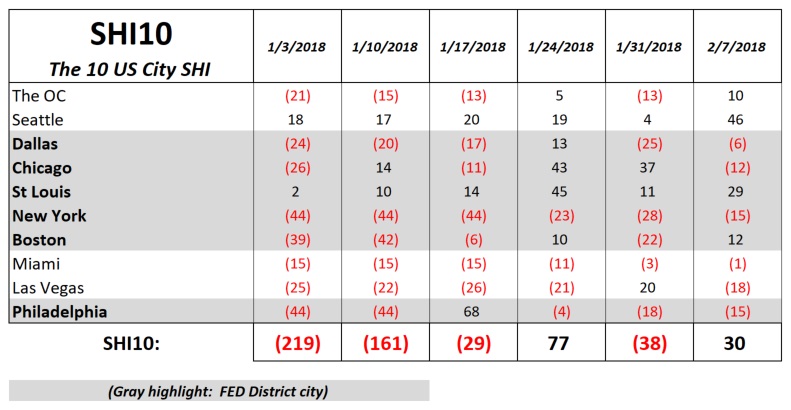
It looks like the many omnivores and carnivores around the country agree! This week, the SHI10 has improved significantly: We’re up to a positive 30! Take a look:
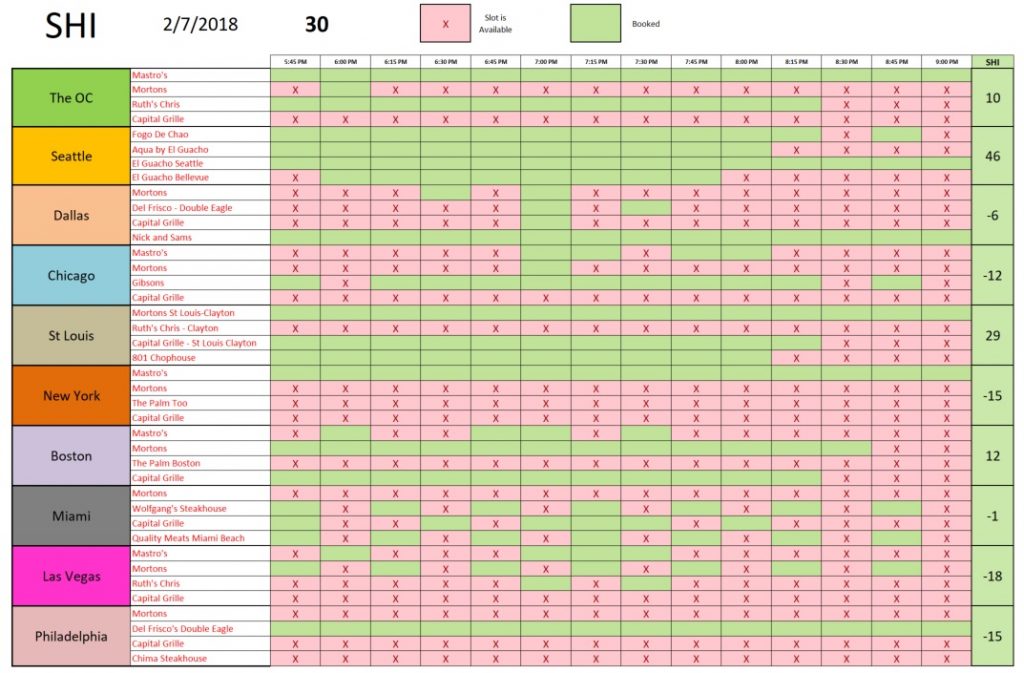
This week, only Chicago and Las Vegas failed to improve. The SHI in our other 8 markets were better week-over-week. Folks in Seattle are definitely hankering for a pricey steak this Saturday! Here’s our longer term trend:
Permit me to summarize with these comments.
- The US economy remains strong. And the economies of countries around the globe remains in a synchronized global expansion.
- Even with the recent US rate increase, rates remain low and accommodative. Will rate increases continue? Probably. Supply fears will not dissipate soon. Investor inflation fears, too, are likely to remain heightened. But the combination of (a) low European and Japanese long-term rates; (b) moderate actual inflation when measured by the PCE; and, (c) the shrinking of the ‘term premium’ (see the SHI 1.24.18: The Rate of Return on Everything) should keep the 10-year Treasury anchored at low levels when measured by historic standards.
- And the “good times” will continue — which is precisely the picture the SHI10 paints above.
Thanks for reading…as always, send any comments my way!
- Terry Liebman


