
SHI 3.13.19 – A Serious Crisis

SHI 3.6.19 – Gross Domestic Product
March 6, 2019
SHI 3.20.19 – Antifragile: Things that Gain from Disorder
March 20, 2019
“Feel like really digging in? I’m not talking steaks. I’m talking DATA. Check out the ‘Yardeni Research’ website.”
Ed Yardeni is a great resource for quality economic data. Here’s the link: https://www.yardeni.com/ Quite frankly, I don’t know how he does it. He must have an army of researchers. For example, click on this link: https://www.yardeni.com/what-i-am-reading-2019/ I may read as much as he does … but I certainly don’t have enough time in the day to post everything he does … and to keep up the rest of his website! Pretty impressive, right?
Let’s move on … to the “crisis” I mention above.
Welcome to this week’s Steak House Index update.
If you are new to my blog, or you need a refresher on the SHI10, or its objective and methodology, I suggest you open and read the original BLOG: https://www.steakhouseindex.com/move-over-big-mac-index-here-comes-the-steak-house-index/
Why You Should Care: The US economy and US dollar are the bedrock of the world’s economy. This has been the case for decades … and will be true for years to come.
But is the US economy expanding or contracting?
According to the IMF (the ‘International Monetary Fund’), the world’s annual GDP is about $80 trillion today. US ‘current dollar’ GDP now exceeds $20.89 trillion. In Q4 of 2018, nominal GDP grew by 4.6%…following a 4.9% increase in Q3. We remain about 25% of global GDP. Other than China — a distant second at around $12 trillion — the GDP of no other country is close. We can’t forget about the EU — collectively their GDP almost equals the U.S. So, together, the U.S., the EU and China generate about 2/3 of the globe’s economic output. Worth watching, right?
The objective of the SHI10 and this blog is simple: To predict US GDP movement ahead of official economic releases — an important objective since BEA (the ‘Bureau of Economic Analysis’) gross domestic product data is outdated the day it’s released. Historically, ‘personal consumption expenditures,’ or PCE, has been the largest component of US GDP growth — typically about 2/3 of all GDP growth. In fact, the majority of all GDP increases (or declines) usually results from (increases or decreases in) consumer spending. Consumer spending is clearly a critical financial metric. In all likelihood, the most important financial metric. The Steak House Index focuses right here … on the “consumer spending” metric. I intend the SHI10 is to be predictive, anticipating where the economy is going – not where it’s been.
Taking action: Keep up with this weekly BLOG update. Not only will we cover the SHI and SHI10, but we’ll explore related items of economic importance.
If the SHI10 index moves appreciably -– either showing massive improvement or significant declines –- indicating growing economic strength or a potential recession, we’ll discuss possible actions at that time.
The BLOG:
Back in February, Yardeni wrote a blog on the topic of ‘stock buybacks.’ The title of the blog was “The Government is Here to Help,” a quip made famous by Ronald Reagan, when he claimed those words are “the most terrifying words in the English language.”
Agree or not, it was pretty funny at the time. That Reagan. Such a card!
Politicians love the opportunity a serious crisis creates. As Yardeni said in his blog post:
“Journalist H.L. Mencken famously observed: ‘The whole aim of practical politics is to keep the populace alarmed (and hence clamorous to be led to safety) by menacing it with an endless series of hobgoblins, all of them imaginary.’
Once again, agree or disagree, that’s an interesting perspective from a guy who passed away in 1956. Distilling Mencken’s comment to its essence, he’s suggesting politicians have mastered the art of “fake news.” He didn’t call it that … but that’s what he meant.
6 decades later, the problem of ‘fake news’ hasn’t gotten any better. It’s clearly worse. Fake news abounds. Even from economists.
For example, consider these two publications:
- https://www.cbo.gov/publication/53764
- https://www.whitehouse.gov/wp-content/uploads/2018/02/spec-fy2019.pdf
The first is published by the Congressional Budget Office. The second, by the Office of Management and Budget. These two organizations sounds similar, but they couldn’t be any more different. The CBO is a government agency tasked with providing economic and budget information to Congress. The OMB is an “Executive Office” within the U.S. President’s administration.
And their forecasts couldn’t be further apart. In almost every respect. Whether we’re talking about GDP forecasts, budget deficits, the level of national debt, the divergence between the two reports is staggering. Feel free to dig in your self, but I have to warn you: The OMB document is 338 pages. 338. Dense. Pages.
First let me say I believe they are both wrong. But for different reasons. Let me illustrate. Here’s a graph from page 23 of the OMB report:
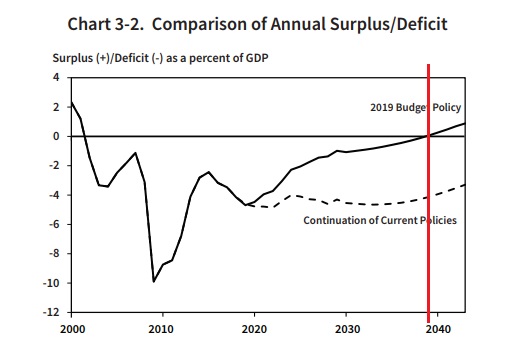
According to this graph, should the U.S. follow the policies set forth in this OMB document, “An American Budget,” our annual budget deficit will begin to shrink immediately … and the U.S. will achieve a balanced budget by late in the 2030s (red line added by TL). Little would thrill me more … but alas, I’m a cynic.
The OMB forecast relies on this GDP forecast:
“In the medium term the rate of real GDP growth is expected to remain strong at 3.0 percent as the effects of growth-enhancing policies play out in terms of an increasing capital stock per employed worker and consequently higher labor productivity growth. As the economy settles into a new steady state with higher capital stock per worker, the annual rate of real GDP growth is expected to edge down to a pace of 2.8 percent by 2026. While expected GDP growth of 2.8 percent per year at the end of the forecast is below the average growth rate seen in the post-World War II period, it is consistent with present-day and expected demographic trends for the U.S.”
Man, I wish. That would be fantastic! But I think Mars will be colonized by Elon Musk before we see a decade-long ‘real’ GDP growth rate close to 3%.
On the other hand, the here is the CBO forecast:
“In CBO’s projections, real GDP expands by 3.3 percent this year (2018) and by 2.4 percent in 2019. Most in output in the next two years is driven by consumer spending and business investment, but federal spending also contributes a significant amount this year. After averaging 1.7 percent from 2020 through 2026, real GDP growth is projected to average 1.8 percent in the last two years of the 2018–2028 period.”
That difference in growth rates — about 1.2% per year — adds up. For example, the CBO is forecasting 2028 ‘nominal’ GDP of $30.087 trillion. The OMB: $32.991 trillion. The OMB forecast is almost 10% greater.
And since U.S. tax collections are equal to about 18% of GDP, Treasury revenues are quite a bit lower under the CBO forecast. Said another way, the CBO expects the “federal debt held by the public” to balloon to nearly 100% of GDP by 2028:
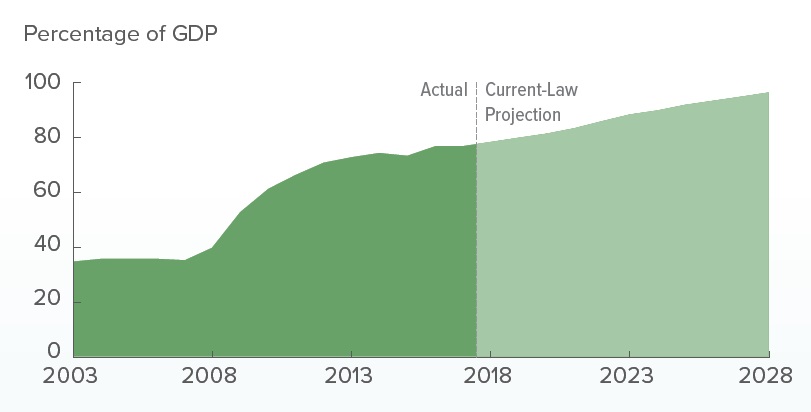
Who’s right? Probably neither forecast is accurate. Forecasting is inherently difficult since the underlying models are complex beyond reason.
Neither forecasts a recession…and, in fact, the word is given only scant mention in both documents. That’s quite a departure from the stark economic reality. The OMB document, at least, makes this comment on “Economic Assumptions” on page 16:
“… if the economy were to suffer an unexpected recession, the rules of thumb suggest that tax revenues would decline and that spending on programs such as unemployment insurance would go up. In such a situation, however, policy makers might cut tax rates to stimulate the economy, and such behavior would not be accounted for by the historical relationships captured by these rules of thumb.“
An unexpected recession, eh? Well, here’s a news flash for you, Mr. OMB: The U.S. will almost certainly suffer a recession. During the next 10 years. You might as well forecast one. 🙂
But for my money, I think the CBO is a lot closer to reality than the OMB. On the other hand, both are government projections … so … are both forecasts “political fake news?” You be the judge.
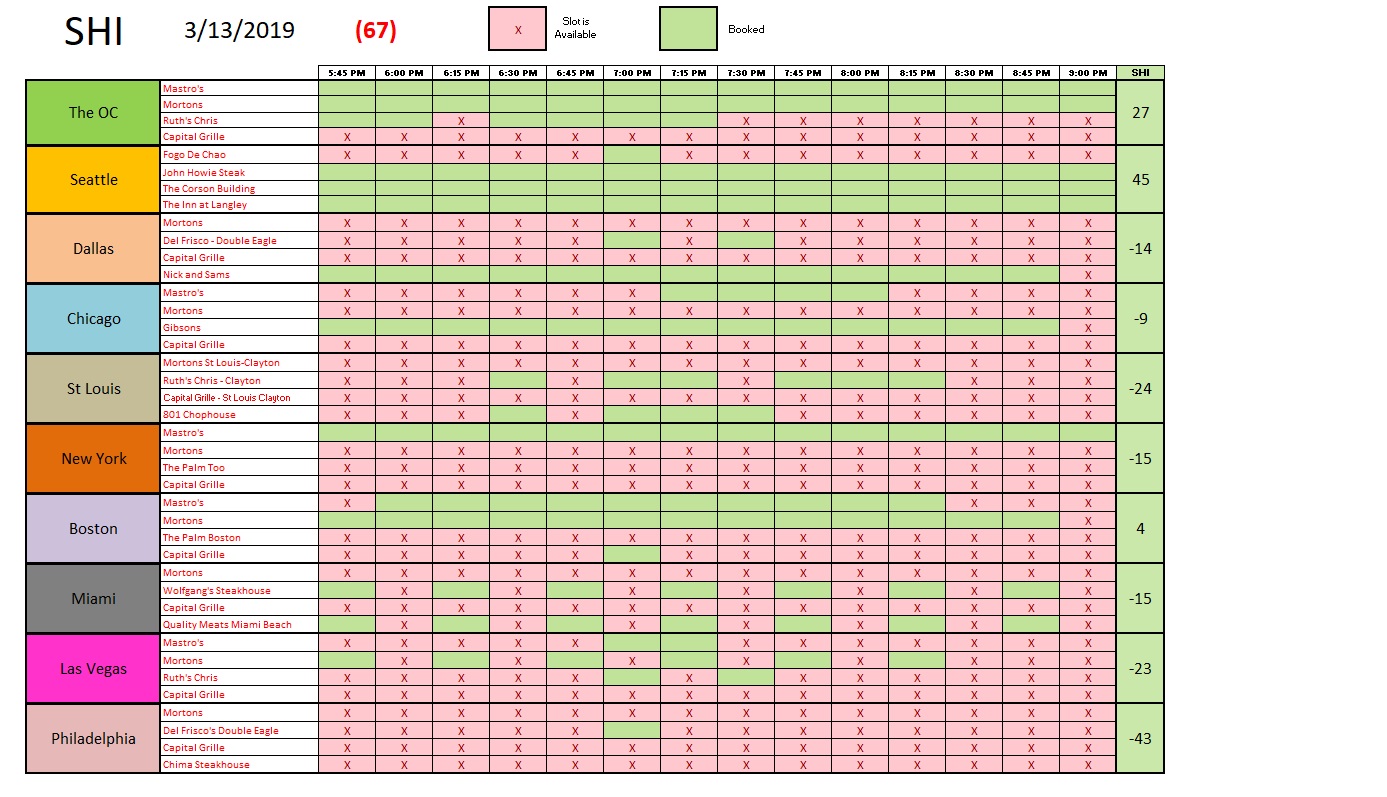
In the interim, let’s cut into something we really understand: Steaks! Here is this week’s long-term trend chart:
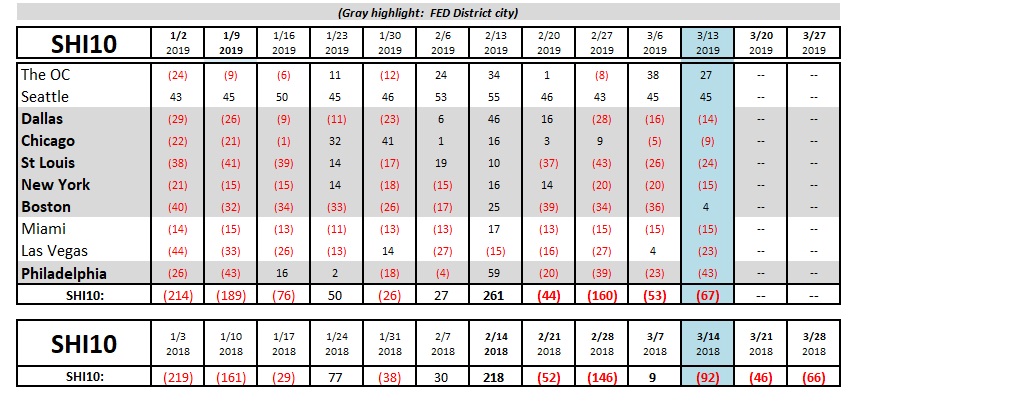
Once again, the trend is holding consistent with last year. But here, locally, reservations in our expensive OC steakhouses are in high demand! Mastros, of course, is still selling out of “Seafood Towers,” but this week even Mortons is grilling on high. Take a look at the individual restaurant results:
Recent economic news reports have been filled with worry and concern. There is no shortage … from the FED’s decision to “pause” rate increases and slowdown (or stop) balance sheet runoff … to poor December consumer consumption results. There is no doubt: the economic seas are turbulent.
But don’t mistake turbulence with the oceans of “fake news” floating around. The sky is not falling. Like the FED, here at the SHI we remain “data dependent” and call it as we see it. Using the most accurate data we can find.
In the interim, here’s my take-away for you: Take all data — economic included — with a grain of salt. “Fake news” is nothing new … and we have to work hard to distinguish between real data, obviously “fake” data, and everything in between.
Yes, even SHI data … who knows? Maybe I’ve been bribed to post “fake news” … in exchange for a guarantee that my granddaughter will be admitted to Harvard! 🙂
- Terry Liebman


