
SHI 4.14.21 – The Steakhouse is BACK!

SHI 4.7.21: Circles, Cycles and Bubbles
April 7, 2021
4.21.21 – Economy? Sizzling !!! Steaks? Nope.
April 21, 2021
At long last, the SHI-10 returns!
The SHI10 was last updated on 3/11/2020. Until today. Today, the SHI10 returns — more than 13 months later. If you are unclear on ‘why,’ then you are either (1) a new reader or (2) you’ve been living alone until this moment, in an igloo, far north of the Arctic Circle, without contact to the world below.
“
Woo Hoo! The SHI-10 is back, baby!“
“Woo Hoo! The SHI-10 is back, baby!“
Does the index have much predictive value or application today? Probably not. Each of the SHI cities has unique restaurant capacity limitations. Texas, of course, has none. Hey: It’s Texas. They are 100% open without capacity limits. You may be surprised to hear that NYC is 75% “open.” Chicago? 50% at present — just as we are here in the OC. And, of course, with fine dining tables littering parking lots and sidewalks, what precisely do the capacity limits mean to the SHI10 anyway? Both are new variables that are not, and will not, be incorporated into the SHI algorithm. Alas. But, nonetheless, we’re back baby! And I think you’ll agree: The numbers are fascinating!
Welcome to this week’s Steak House Index update.
If you are new to my blog, or you need a refresher on the SHI10, or its objective and methodology, I suggest you open and read the original BLOG: https://www.steakhouseindex.com/move-over-big-mac-index-here-comes-the-steak-house-index/
Why You Should Care: The US economy and US dollar are the bedrock of the world’s economy.
But is the US economy expanding or contracting?
Before COVID-19, the world’s annual GDP was collectively about $85 trillion. Then it shrank … then bounced back! We can thank global fiscal and monetary policy for the bounce. According the the Q3, 2020 ‘preliminary’ numbers, annual US GDP is back UP to about $21.1 trillion. And still, together, the U.S., the EU and China continue to generate about 70% of the global economic output.
The objective of this blog is singular.
It attempts to predict the direction of our GDP ahead of official economic releases. Historically, ‘personal consumption expenditures,’ or PCE, has been the largest component of US GDP growth — typically about 2/3 of all GDP growth. In fact, the majority of all GDP increases (or declines) usually results from (increases or decreases in) consumer spending. Consumer spending is clearly a critical financial metric. In all likelihood, the most important financial metric. The Steak House Index focuses right here … on the “consumer spending” metric. I intend the SHI10 is to be predictive, anticipating where the economy is going – not where it’s been.
Taking action: Keep up with this weekly BLOG update. Not only will we cover the SHI and SHI10, but we’ll explore related items of economic importance.
If the SHI10 index moves appreciably -– either showing massive improvement or significant declines –- indicating growing economic strength or a potential recession, we’ll discuss possible actions at that time.
The Blog:
Let’s jump right in. But first, a brief review. What, precisely, is the SteakHouseIndex?
In 1986 The Economist magazine invented “The Big Mac Index” as a toungue-in-cheek currency valuation technique. Their theory was this: In that a Big Mac has identical ingredients – regardless of where it’s made – it should cost exactly the same amount, regardless of where in the world you buy it. Well, it turns out that after converting the price of the Big Mac from the local currency (where the Big Mac is being sold) into US dollars, the price is actually quite inconsistent. And this Big Mac price variation, the theory holds, indicates the degree to which the local currency is over- or under-valued.
The SHI was born with a similar, if far less pedestrian, objective: In that about 70% of the US economy is consumption based, by tracking reservation demand at the priciest of steak houses, a well-designed, consistently-applied index may offer an alternative economic yardstick to measure and predict the direction of the US economy.
In the macro, when viewed thru the lens of our collective behaviors, those behaviors are generally rational. Meaning, when faced with danger, we generally pull back, away from danger. When faced with ‘financial’ danger, we do the same: we adapt our behavior to the conditions and/or circumstances in which we find ourselves. If you – or your company (for those of you on a company ‘expense account’) – are feeling financially pinched, would you take a party of 4 people to an expensive steak house for dinner on a Saturday night? Nope. Probably not. Conversely, if we’re feeling flush, sure, we’ll go to Ruth’s Chris Steak House on Saturday night and spend $150 to $300 — per person — for dinner, right?
So the availability of reservation ‘slots,’ at expensive steak house restaurants, might be a good indicator of current economic strength. If the restaurant is booked … demand is high and our economy is sizzling — just like those steaks! But if most tables are “open” and available, reservation demand is clearly light, and well-heeled diners are probably down-sizing to a Big Mac or a Double-Double. Perhaps for financial reasons?
Even better, a weekly ‘index’ reading that is compiled using consistent and precise methodology could, over the long term, help us gain some idea of whether or not the economy is growing or is under stress, and might begin to shrink. That’s what the SHI is designed to predict.
Here is my methodology for the SHI 10 City Index:
1. Using OpenTable to identify restaurants open to digital reservations, I selected forty (40) well know, very expensive (four $$$$ meaning >$50 per person) and highly rated steak houses (by consumers), operated by larger operators, in ten (10) cities across the United States — from San Francisco to Boston. 8 of those cities are FED district cities, discussed at length by the FED in their Beige Book 2X-per quarter economic analysis:
https://www.federalreserve.gov/monetarypolicy/files/BeigeBook_20210414.pdf
2. Saturday night is the most popular night of the week to eat out. That’s when restaurants are typically in peak demand. And while at home most Americans tend to eat dinner between 6:00 and 7:30 pm, 7:30 pm is the apex demand point, and the most popular ‘reservation time’. Which means, at times of high demand, those time slots will not be available….but ‘lower’ demand time-slots might be available.
3. Using OpenTable to identify digital availability, I check Saturday night reservation availability on the Wednesday immediately preceding the ‘dinner date.’ For a party of 4. I do this between 10 and 11 am.
4. I created a matrix (chart) with reservation ‘slots’ in 15 minute increments beginning at 5:45 pm thru 9:00 pm.
5. I have created an algorithm with a time-weighted value for each of the 14 time slots for each of the 40 restaurants. For example, if a 7:30 slot is available at Ruth’s Chris, this is a bad sign — and this fact will adversely impact the SHI. Remember, this is the most popular time. So a “vacancy” at 7:30 is assigned a negative value of (-2). If this slot is booked, this value is a +0.5. And so on. (Complete index model methodology is available – ask and I’ll gladly post it…or send it to you personally.)
6. Using this methodology, the possible weekly range for the collective totality of outcomes is (-440) to a positive 720. Meaning if EVERY reservation slot for the forty restaurants – between 5:45 and 9:00 pm – is available, the reading is a -440. If they’re all taken – meaning NO reservations are available, the reading is a positive 720. More likely would be a reading, or index outcome, between these two end points.
7. Finally, I charted the availability – or lack thereof – for each of the 40 steak houses at each of the time slots. 14 time slots for each restaurant, or 560 possible reservation slots total. And I developed a grid to reflect the index reading for that week.
8. This process will be repeated every week – on Wednesday – so that we can create a meaningful index history which, hopefully, will prove useful in portraying current, and predicting future, economic activity.
So, without further ado, let’s sink our teeth into today’s data. Below is the SHI10 chart from today:
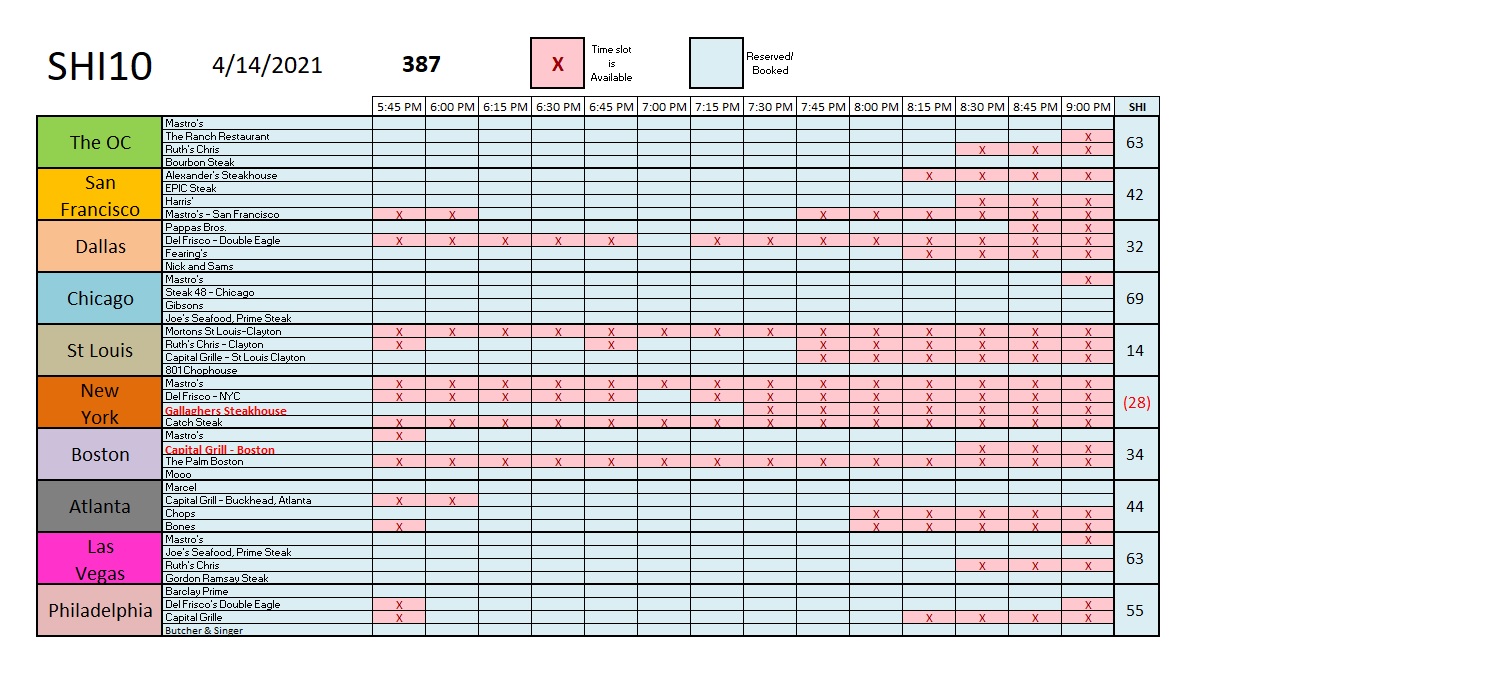
I was shocked to see demand this strong. Is this predictive or meaningful? Probably not. Well, on one hand, clearly expensive eateries are in high demand this Saturday. But as this is the first SHI10 in over 13 months, we have no data trend to use as a comparison. It’s also worth noting that of the forty (40) tantalizing grills in the SHI10 way back in March of 2020, thirty eight (38) appear to have survived the COVID closures. Two, I’m sorry to report, have perished. They have been replaced in the grid above — one in NYC and one in Boston — and the new restaurant names appear in red text.
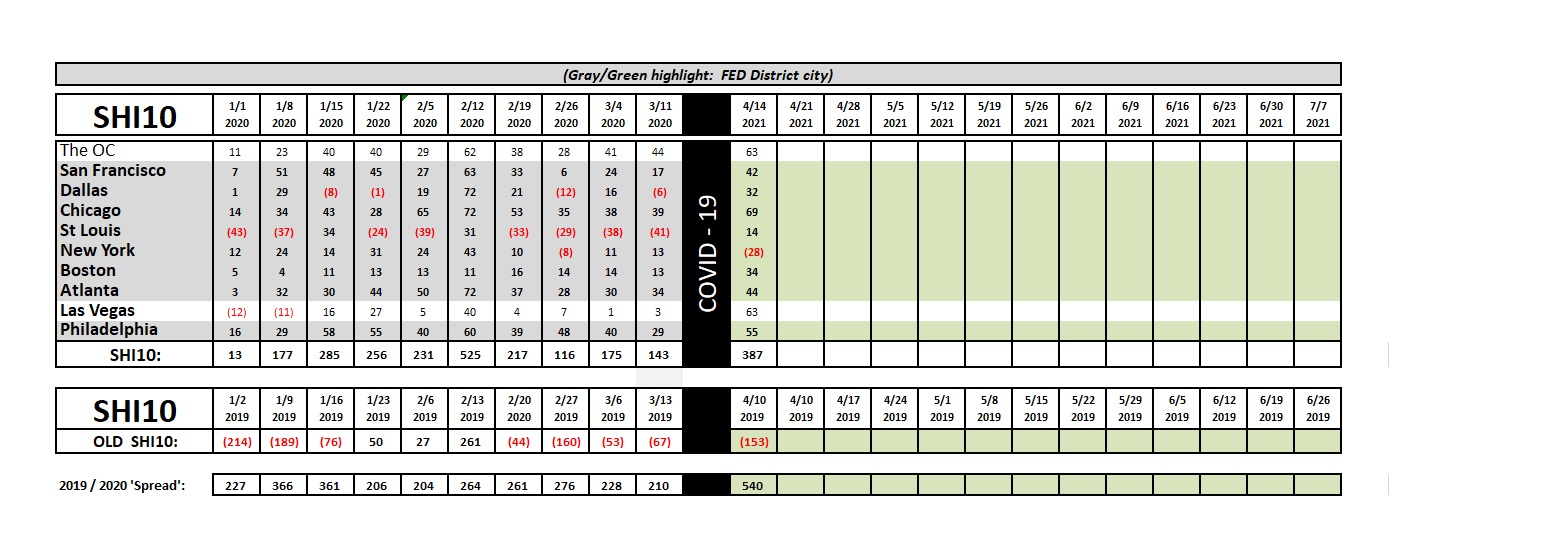
Back to that “trend” issue. We do have a trend grid. But the last recorded SHI10 date was 3/11/2020. You may recall that here in California, the governor issued his “stay at home” order on 3/19/2020. So, while we have a grid for comparison, the “black bar” of COVID-19 separates the older data from the new. See below:
So, what can we glean from this week’s SHI data? A few things, I believe.
First, if you thought diners would be reluctant to return to restaurants, post-COVID, you would be wrong. Meat lovers are swarming back to our swanky steak houses. Clearly, they are throwing both masks and caution to the wind — GRILL ME A STEAK, BABY! is today’s rally cry.
With the exception of NYC, reservation demand this Saturday is exceptionally strong. But it is worth noting that NYC has 428 steak houses, with 95 in the ‘$$$$’ category. Compare this to another heavy tourist destination, Las Vegas. Vegas has 100 steak houses … 47 of which meet the ‘very expensive’ four-$ metric on OpenTable. Clearly, NYC has extensive competition in the expensive eatery category. And, of course, Manhattan “business” has been essentially closed for months now. This must adversely impact reservation demand.
Second, take a look at the “”2019 / 2020 Spread” metric above. Post COVID-19, this is really a 2019 / 2021 spread … and the “540” reading is the highest reading we’ve ever had. On April 10, 2019, the SHI reading was a negative (153.) Today, the index reading was 387. That is a massive increase.
So, while index trending is unavailable, and the “capacity” issue muddies up the precision of the index reading, this week’s SHI message is still quite clear: Expensive American steak houses are open for business … and they are packed with patrons and American Express cards!
- Terry Liebman


