
SHI 4.18.18: This is Not Your Grandfathers …

SHI 4.11.18 Back to Basics
April 11, 2018
SHI 4.25.18 Lumber, Reach for the Sky!
April 25, 2018
Today’s ‘unemployment rate’ calculation is quite different than in years past.
Unemployment rate data was first collected during the 1930s. Just a few years after the beginning of the Great Depression.
The first unemployment survey results were issued by the WPA in 1940. The early surveys were rudimentary and, well, highly inaccurate. Here’s a Bureau of Labor Statistics (BLS) comment on the early survey techniques:
“Many early surveys relied on a person’s stated interest in work to determine whether or not that person was unemployed. Asking people without work if they were able and/or wanted to work was fraught with value judgments, as the questions were largely hypothetical. …Whether a person not currently working wanted or was able to take a job—even if liberally interpreted as indicative of current labor market attachment—arguably could vacillate from day to day with changing perceptions about the state of the job market or changes in one’s current living situation.”
Over the decades, survey methodology has clearly improved — as has the data collected. This is not your grandfather’s unemployment rate. 🙂
Welcome to this week’s Steak House Index update.
If you are new to my blog, or you need a refresher on the SHI10, or its objective and methodology, I suggest you open and read the original BLOG: https://www.steakhouseindex.com/move-over-big-mac-index-here-comes-the-steak-house-index/
Why You Should Care: The US economy and US dollar are the bedrock of the world’s economy. This has been the case for decades … and will continue to be true for years to come.
Is the US economy expanding or contracting?
According to the IMF (the ‘International Monetary Fund’), the world’s annual GDP is almost $80 trillion today.
During 2017, US nominal GDP increased by $833 billion … by an amount approximately equal to the market capitalization of Apple. At the end of 2017, US ‘current dollar’ GDP was about $19.749 trillion — about 25% of the global total. Other than China — a distant second at around $11 trillion — no other country is close.
The objective of the SHI10 and this blog is simple: To predict US GDP movement ahead of official economic releases — an important objective since BEA (the ‘Bureau of Economic Analysis’) gross domestic product data is outdated the day it’s released.
Historically, ‘personal consumption expenditures,’ or PCE, has been the largest component of US GDP growth — typically about 2/3 of the total. In fact, the majority of all US GDP increases (or declines) usually result from (increases or decreases in) consumer spending. This is clearly an important metric. The Steak House Index focuses right here … on the “consumer spending” metric.
I intend the SHI10 is to be predictive, anticipating where the economy is going – not where it’s been. Thereby giving us the ability to take action early.
Taking action: Keep up with this weekly BLOG update. Not only will we cover the SHI, but we’ll explore related items of economic importance.
If the SHI index moves appreciably -– either showing massive improvement or significant declines –- indicating growing economic strength or a potential recession, we’ll discuss possible actions at that time.
The BLOG:
This is an important issue.
If the unemployment figures we now see each month were inaccurate, or if the methodology used were constantly changing, the data would be of little value. Today’s methodology and accuracy make the data quite valuable.
A brief side note: You will recall the employment survey tracks “non-farm payroll” figures. Why ‘non-farm?’ Because agriculture employment used to be a much larger share of overall employment than it is today. Back in the 1940s, about 1 in 5 workers worked in agriculture, compared with fewer than 1 in 50 now. Times change. This graph below is interesting — check out the unemployment rate in 1940:
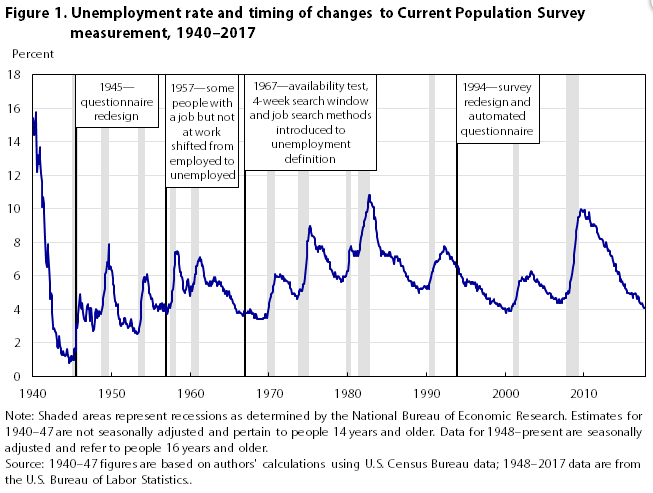
Note the unemployment rate back in 1944. Almost everyone had a job.
Today’s unemployment rate is 4.1% As you can see above, this is very low by recent standards. Here is a recent, 1-year chart of both the unemployment rate and the number of monthly jobs created:
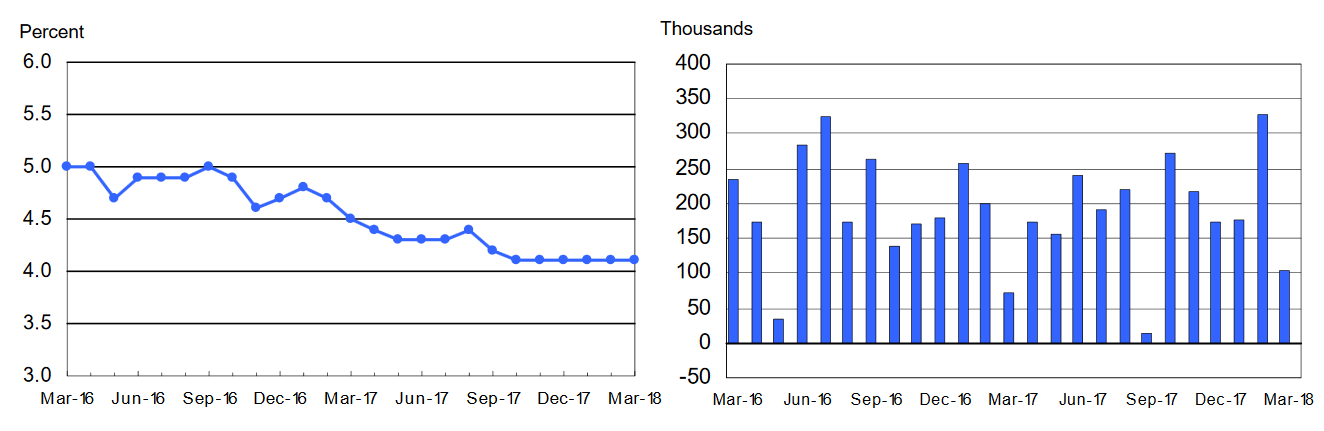
Clearly, many Americans are working. More than 155 million, to be precise. But the ’employment-population ratio’ — the number of people working divided by the number of people who could (in theory) work — is only about 60%. 40% of American who could work — over 100 million of ’em — are not holding down a job. For one reason or another.
The bottom line: Sure, we should be concerned about possible wage inflation as the unemployment rate falls. But I believe we still have a long way to go before wage inflation becomes a reality.
Let’s see if the 155 million folks with jobs are spending their money on expensive steaks this week.
Not as many as last week, it appears. Steak sales remain robust in The Big Apple, but Philly has slipped a bit.
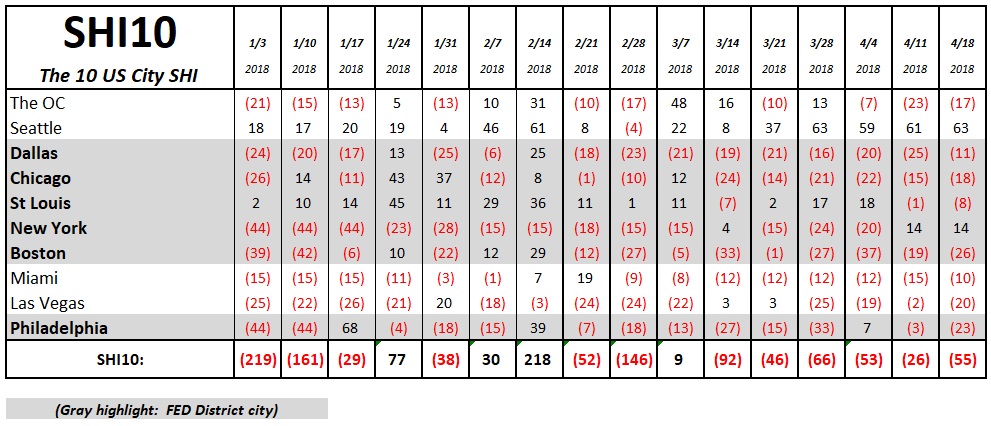
Here are the weekly results:

This week follows the longer-term trend we’ve been observing for a month or two: Yes, well-heeled steak lovers are definitely booking Saturday evening tables at their favorite expensive eatery. This is a fact. But equally obvious is the fact that all SHI10 markets — with the sole exception of Seattle — have plenty of Saturday night reservations slots available. Consumers are spending, but not with reckless abandon.
For this reason, I continue to believe the ‘real’ Q1 GDP reading will be tepid at best.
Which, in my opinion, isn’t necessarily a bad thing. The Trump administration keeps trumpeting (no pun intended) their expectation for a 3% or more ‘real’ growth rate. Which would likely put the nominal GDP growth rate above a 5% annual rate.
That’s a bit too ‘hot’ for my liking. It could trigger a more aggressive response from the FED, move us closer to (or into) an inverted yield curve scenario, and possibly trigger the next recession, sooner than later.
No, slow and steady is just fine with me. The current economic expansion is now one of the longest on record. The prior record is 120 months – 10 years. If we can keep our GDP growing thru May of 2019, we can set a new record! Let’s go for it!
– Terry Liebman


1 Comment
Thanks for the question, Ty. No, I don’t think we will. We may not even see 4 hikes.
But there is a battle of opposing forces at present: Will the tax cuts and trade wars fuel a new inflationary burst? Or, in opposition, will the rising input costs and rising short term rates (the FED has already made 6 25bp rate increases totaling 150 bp) so severely trim corporate profits and employment growth that the economy slips into a contraction? Let’s see how the drama unfolds. – T