
SHI 7.26.23 – A Clash of Titans

SHI 7.12.23 – A Gigantic Meal
July 13, 2023
SHI 8.2.23 – Broken China
August 2, 2023
Investors are warned: “Never fight the FED…”
I’m sure you’ve heard this admonition before. Same with, “Never bet against the FED.” For good reason. Generally, you will lose.
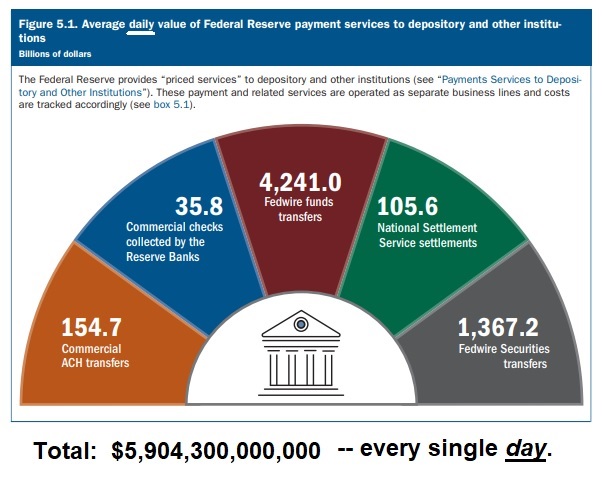
Since its creation about 110 years ago, the Federal Reserve has become the largest and most powerful financial force in the world. The size, scale and reach of the United States federal reserve system is absolutely awe inspiring.
Every. Single. Day.
“
The FED and Uncle Sam are duking it out.’“
“The FED and Uncle Sam are duking it out.’“
This number is so staggeringly large, it bears repeating:
The Federal Reserve system moves almost $6 trillion of US dollars across the global banking system every single day!
And yet, the FED is derivative of the United States as a whole. So consider this: If the ‘sum of the parts’ must be greater than the individual parts themselves, the United States, in totality, must be much more powerful than the FED.
So when the FED and Uncle Sam ‘duke it out’ so to speak, who wins? Should we bet against the FED when the FED is fighting Washington DC? When DC is in the fight, will they win? … or will the FED still be victorious.
Welcome to a modern-day version of the Clash of the Titans. The battle is unfolding as we speak … the FED is diligently working to crush the economy, raising rates at record speeds and shrinking their balance sheet. Uncle Sam, on the other hand, has been tossing trillions of US dollars out of helicopters for more than three years now. And the profligate spending continues today .. and into the future!
OK, before we jump into the blog, I have to warn you: It’s a bit long and dense. So grab a seat, maybe a glass of wine, and — hey! — a perfectly grilled filet would be nice, too. Plow in folks. 🙂
Welcome to this week’s Steak House Index update.
If you are new to my blog, or you need a refresher on the SHI10, or its objective and methodology, I suggest you open and read the original BLOG: https://www.steakhouseindex.com/move-over-big-mac-index-here-comes-the-steak-house-index/
Why You Should Care: The US economy and US dollar are the bedrock of the world’s economy.
But is the US economy expanding or contracting?
Expanding. Even as the FED rapidly raises rates! At the end of Q1, 2023, in ‘current-dollar’ terms, US annual economic output rose to an annualized rate of $26.53 trillion. After enduring the fastest FED rate hike in over 40 years, America’s current-dollar GDP still increased at an annualized rate exceeding 6% during the first quarter of 2023. No wonder the FED is so concerned. The world’s annual GDP rose to over $100 trillion as 2022 began. And according to the IMF, in June of this year, current-dollar global GDP eclipsed $105 trillion! IMF forecasts call for global GDP to reach almost 135 trillion by 2028. America’s GDP remains around 25% of all global GDP. Collectively, the US, the euro zone, and China still generate about 70% of the global economic output. These are the 3 big, global players. They bear close scrutiny.
The objective of this blog is singular.
It attempts to predict the direction of our GDP ahead of official economic releases. Historically, ‘personal consumption expenditures,’ or PCE, has been the largest component of US GDP growth — typically about 2/3 of all GDP growth. In fact, the majority of all GDP increases (or declines) usually results from (increases or decreases in) consumer spending. Consumer spending is clearly a critical financial metric. In all likelihood, the most important financial metric. The Steak House Index focuses right here … on the “consumer spending” metric. I intend the SHI10 is to be predictive, anticipating where the economy is going – not where it’s been.
Taking action: Keep up with this weekly BLOG update. Not only will we cover the SHI and SHI10, but we’ll explore “fun” items of economic importance. Hopefully you find the discussion fun, too.
If the SHI10 index moves appreciably -– either showing massive improvement or significant declines –- indicating growing economic strength or a potential recession, we’ll discuss possible actions at that time.
The Blog:
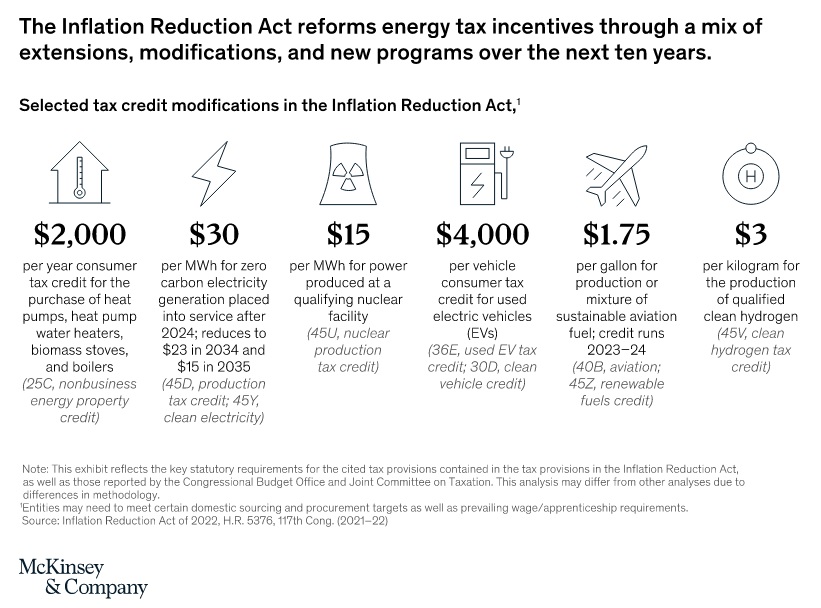
The Infrastructure Investment & Jobs Act (“IIJA”) was approved in November of 2021. The IIJA will pump up to $1.2 trillion into the economy over the next 10 years, including $550 billion of brand-new spending.
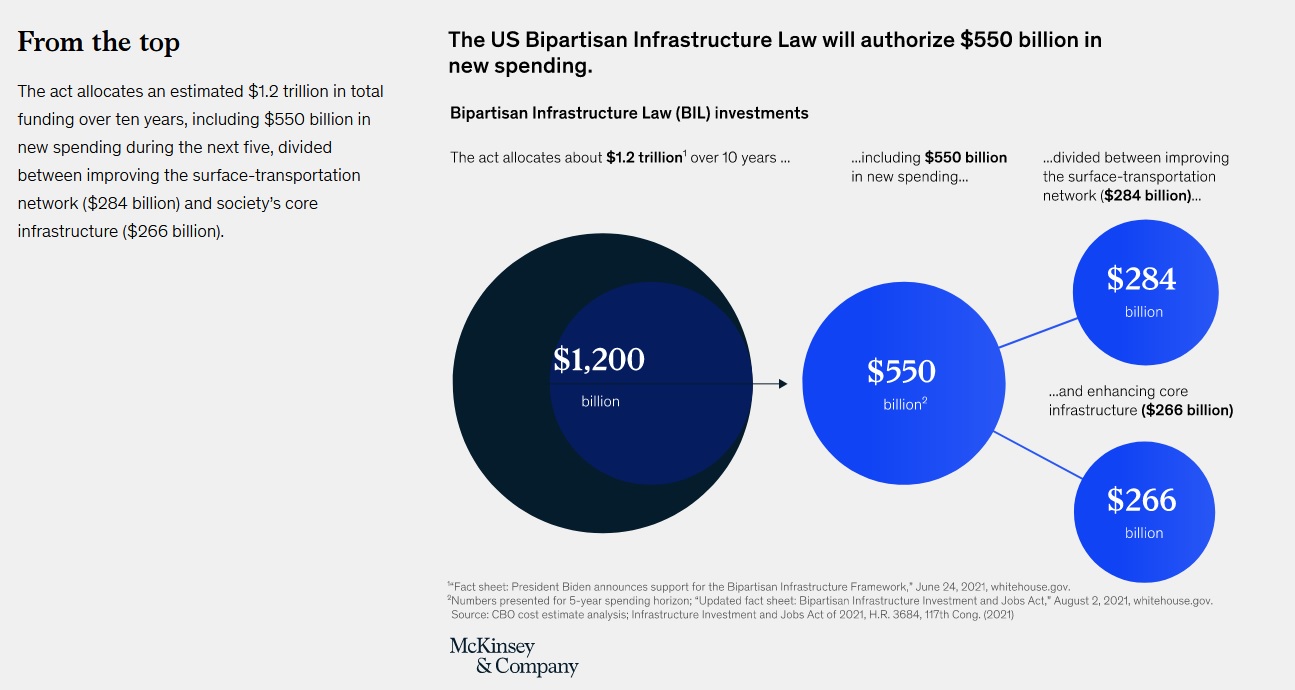
McKinsey produces some excellent research that dissects many of the federal spending bills. The image above was clipped from this one (right click, open in new tab):
The “Bipartisan Infrastructure Law” is part of the IIJA. The BIL authorizes $108 billion for public transportation. Check out these links (right click, open in new tab):
https://www.transit.dot.gov/BIL
https://www.whitehouse.gov/build/
Here’s an interesting fact from the third link above:
“To date, nearly 35,000 projects have been awarded funding from the Bipartisan Infrastructure Law. They range from repaving roads and water system upgrades funded through formula grants to states to competitive funding for massive bridge and transit projects.”
35,000 approved projects. Wow. Staggering. Are you curious where they are? Check out the map provided by whitehouse.gov:
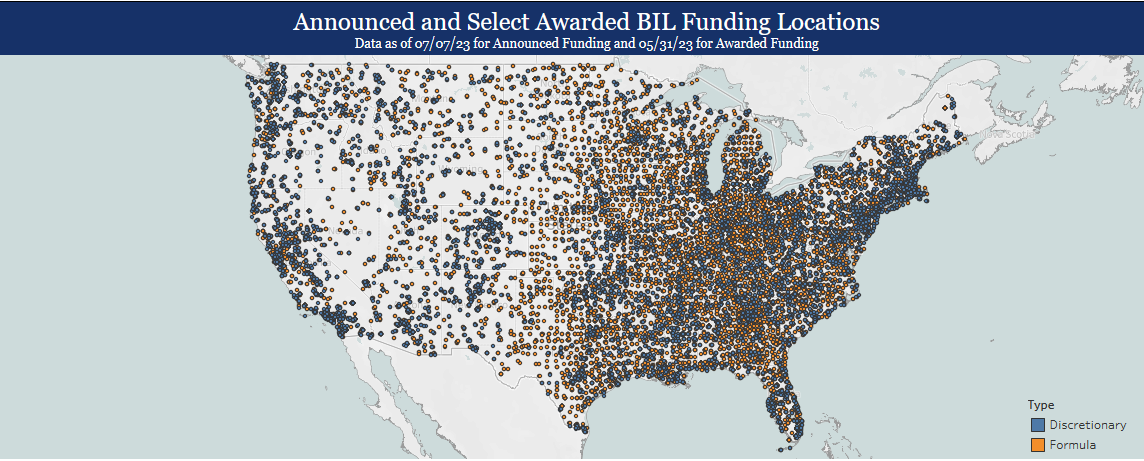
The short answer? Just about everywhere in the United States.
The CHIPS legislation adds another $278 billion onto the pile of cash. This almost $1.5 trillion will be spent over many years … and when passed, Congress hoped both would provide significant infrastructure and economic lift — far beyond the capital investment by the US government. The Chips and Science Act focuses on scientific research and development of technologies the administration deems critical to the U.S. It allocates $52.7 billion in spending and tax credits to chip manufacturing. Its 25% tax credits have sparked a building boom in chip-making facilities and electrical power and energy projects.
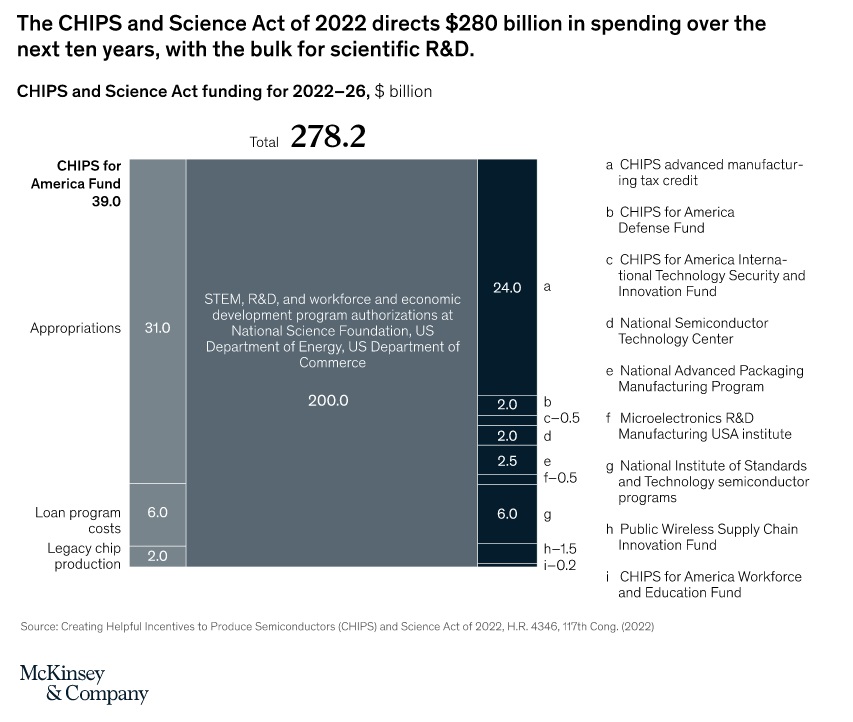
Today, the United States makes just 12% of the world’s semiconductors. In the 1990’s, we made 37%, according to US government statistics. The pandemic uncovered the fragility of international supply chains. Research estimates that worldwide chip demand will continue growing, with global annual semiconductor spend expected to clear $1 trillion by the end of the decade. In the final analysis, our leaders in DC decided this is a national security issue.
The Inflation Reduction Act – now known as the IRA – which, ironically is neither reductive nor anti-inflationary – is providing $499 billion in tax credits and other subsidies, such as:
The Energy Department’s heavily subsidized loan guarantees are spurring big increases in private business investment.
All together, these initiatives represent one of the largest US government spending initiatives directed at the nation’s infrastructure and industry since the 1930s. The goals include bolstering manufacturing, shifting production and consumption toward renewable energy, creating jobs that pay well, and expanding government’s role in the economy.
Meanwhile, a portion of the federal government’s $5 trillion in Covid spending continues to slosh around the economy. Remember: once injected into the economy, these funds generally remain there. Let me explain. As 2020 began, the US had about $15.5 trillion floating around in money supply (M2). A little more than 2 years later, thanks to a variety of Covid stimuli, by April of 2022, that number had increased to just over $22 trillion – a $6.5 trillion increase. In percentage terms, this was a 42% increase. An increase that large is unprecedented in all of American history.
Today, money supply is down – slightly. Actions by the FED drained off about $1.2 trillion as of July of this year. But at $20.8 trillion, M2 is still far higher than it was back in January of 2020. Visualize a swimming pool. Once filled, the elevated water level generally remains constant, a little evaporation aside. The added water simply sloshes around the entire pool.
Money in our economy works much the same way. Even if person (a) spends their savings and person (b) receives income as a result, the net effect is these funds remain in the “financial pool” and simply slosh around the economy … and a little flows into other parts of the global economy.
Households may have spent some of their savings cushions; however, state and local governments saved almost all the $500 billion they received in federal grants. Their holdings of U.S. Treasury securities have surged to $1.55 trillion from their pre-pandemic average of $775 billion. And so, in addition to the plethora of federal spending discussed above, as state and local governments spend their excess savings, economic activity will be stimulated long after federal deficits are recorded.
Uncle Sam is putting up a good fight.
Against this tidal wave of money, the FED is actively engaged in quantitative tightening with the stated goal of reducing inflation to their 2% target. In other words, they are raising interest rates and shrinking their balance sheet.
Their objective is to reduce ‘financial accommodation’ from the economy. This is working, too. The balance sheet is shrinking:
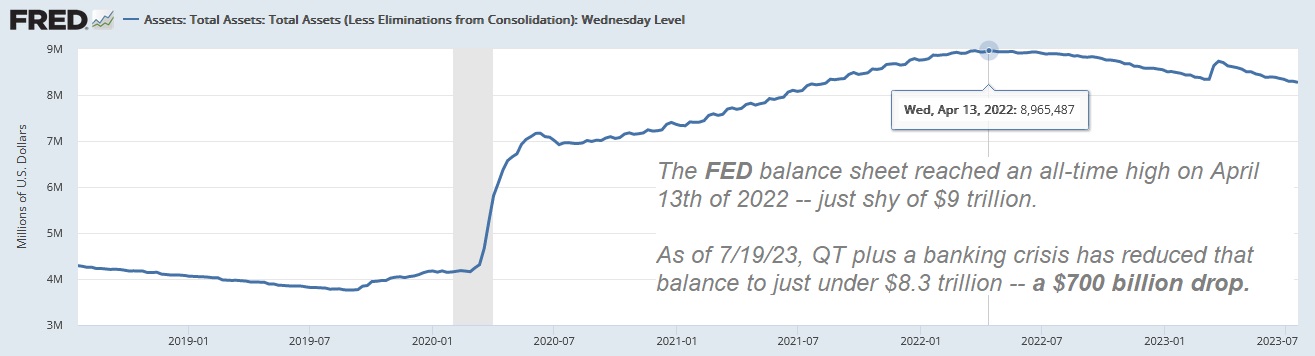
From the NY FED annual report entitled, “Open Market Operations During 2022,” the New York FED suggests this future for the balance sheet: “After falling by about $2.5 trillion from the peak size reached in the first half of 2022, the portfolio stops declining in mid-2025, at which point it is maintained at roughly $6.0 trillion….”
Assuming the FED assets shrink from almost $9 trillion to about $6 trillion in about 3 years … I would say, yes, that is definitely ‘quantitative tightening.’ The FED is slugging away as Uncle Sam bobs and weaves.
So, in summary, in one corner of the ring we have Uncle Sam in DC, handing out cash like a profligate spendthrift. He’s already handed out $5 trillion of pandemic stimulus and ‘Unc’ will “spend” up to $1,977 billion over the next 10 or so years, or about $200 billion per year, (the IIJA, the CHIPS act, and the IRA)
… and in the opposite corner …
.. we have the FED, scrapping away furiously … scrimping, trimming and removing about $1 trillion per year from America’s economy (in theory) over the next three years.
Who will win?
The results we’ve seen from this current FED tightening cycle are unlike any before. In all prior cycles, a more than 500 basis point boost in rates would have dramatically increased unemployment and slowed the economy. Not this time. Why? Thank Uncle Sam. All the money ‘Unc’ is tossing around the economy continues to flow from company to person, back to company and wages, etc, etc. The net effect is financial stimulus that seems to be equal, or greater, to the tightening by the FED. People remain employed. The US economy, so far, seems OK.
And inflation is falling.
Some day — who knows when — Uncle Sam’s outsized spending may come back to haunt us. Remember, the source of all this spending is debt — the national debt to be more precise. But that’s a problem and discussion for another day.
It’s steak time.
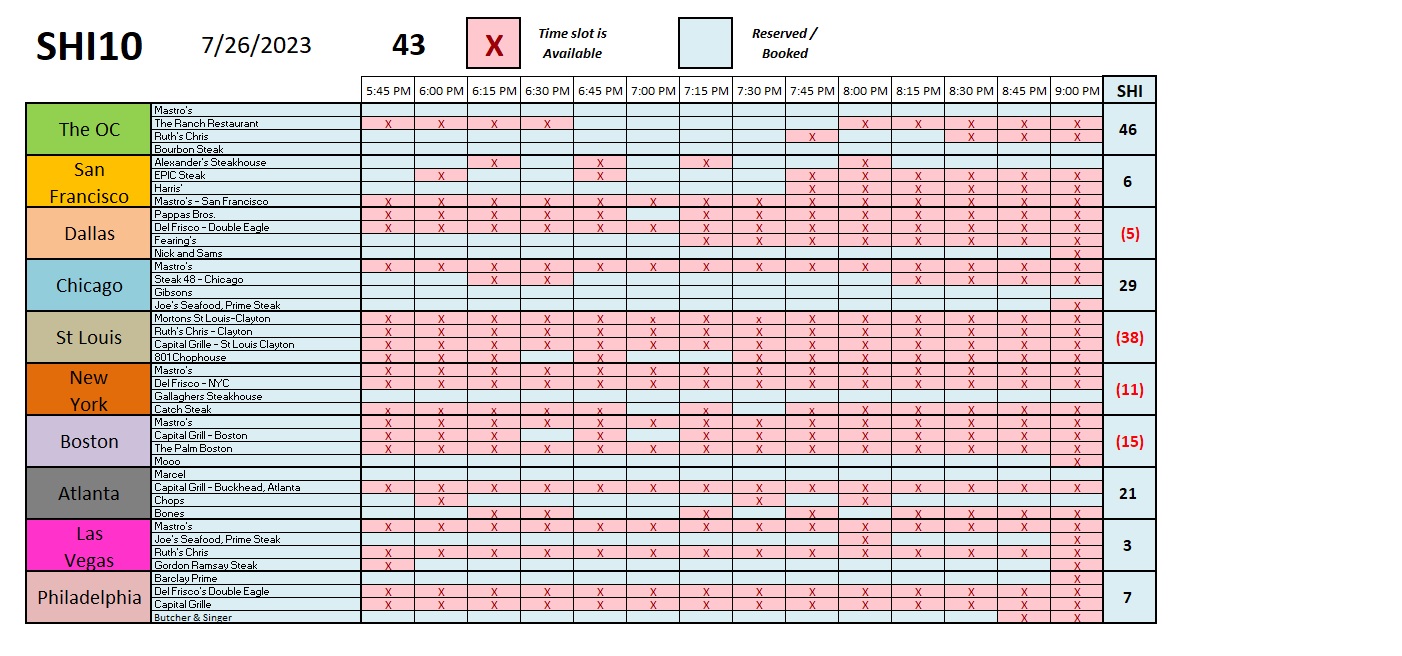
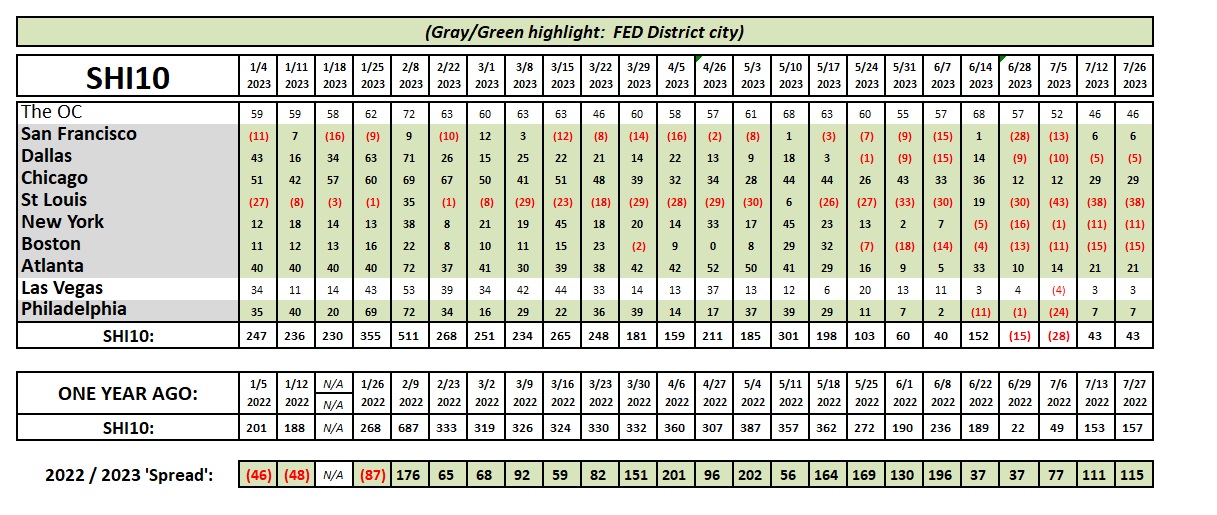
Reservation demand at our expensive eateries is only fractionally lower this week. Here is the longer-term trend chart:
As you now know, the FED announced a 25 basis point increase in interest rates. You’ll recall in an earlier blog I earlier predicted they would not raise rates further. Oops. Wrong. They did.
Apparently they, too, are surprised by the resilience of the US economy in spite of the exceptional headwinds of significantly higher interest rates and removal of financial accommodation. Against this backdrop, I’m not overly surprised with today’s hike.
And we can expect more fireworks tomorrow!
Tomorrow morning, the US Bureau of Economic Analysis – the BEA – will release it’s “first” estimate of Q2, 2023 GDP. I know I’ve repeated this ad nauseam … but remember the official GDP number is always quoted in real terms.
Will the number show a growing economy? In theory, right now no one knows. Not even the FED. So as I complete today’s blog, we don’t know how strong the real GDP number will “look” tomorrow.
However, as of July 19th, the Atlanta FED GDPNow model estimates the number is 2.4%. That would be an impressive outcome, given the FEDs relentless assault on the economy. And remember that’s the ‘real’ number. If we adjust it back up, adding in an estimate for the GDP deflator – an inflation adjustment used to arrive at the real number – 2.4% ‘real’ translates to close to 6% nominal GDP growth!
Wow. That would be a far hotter economy than the grills at Mastros suggest. If our nominal US economy is growing at 6%, that suggests the financial largess from DC is winning the fight to keep American working, investing, and growing. I guess you can fight the FED and win – if you are the behemoth known as the United States of America.
Let’s all wake up tomorrow at 5:30 am (pacific), grab a cup of Joe, and watch the news! Exciting times! 🙂
<:> Terry Liebman


