SHI 7.26.23 – A Clash of Titans
July 26, 2023SHI 8.9.23 – 2 Sides of the Same Coin
August 9, 2023
Excessive inflation and its diametric opposite — stubbornly anchored deflation — are both extremely problematic for any economy.
For different reasons, of course. But of the two, I believe deflation is a much more difficult dragon to slay. Japan has struggled to get out from under deflation for the past three decades. And now it appears that dragon may have left Japan and flown over to China. It’s too early to tell for sure … but it doesn’t look good.
Inflation and deflation are closely related. Little separates them — just a few percentage points. One might even say they are two sides of the same coin.
Consumer price inflation here in America may be “running” a bit hot today, around the 3-4% range, but it wasn’t that long ago that the FED was complaining they were unable to raise the inflation rate up to their 2% target. You may have forgotten, but for almost a decade or longer, the FED tried just about every tool in their toolbox to push up inflation to 2%. Nothing worked. Not even zero percent interest rates.
And then, America found something that worked exceptionally well – too well, it turns out. Simply flood the US economy with cash. Quoting myself from last week’s blog:
“ … a large portion of the federal government’s $5 trillion in Covid spending continues to slosh around the economy. Remember: once injected into the economy, these funds generally remain there. Let me explain. As 2020 began, the US had about $15.5 trillion floating around in money supply (M2). A little more than 2 years later, thanks to a variety of Covid stimuli, by April of 2022, that number had increased to just over $22 trillion – a $6.5 trillion increase. In percentage terms, this was a 42% increase. An increase that large is unprecedented in all of American history.
Today, money supply is down – slightly. Actions by the FED drained off about $1.2 trillion as of July of this year. But at $20.8 trillion, M2 is still far higher than it was back in January of 2020. Visualize a swimming pool. Once filled, the elevated water level generally remains constant, a little evaporation aside. The added water simply sloshes around the entire pool.
And there it remains. Until more ‘water’ (read: money) is added … or drained away. Every economic system has this very same ‘pool.’ But that doesn’t mean each system behaves identically. Similar, perhaps, but not identically.
“
China faces serious issues today.‘“
Of course, the inflation story is not unique to the United States. Flooded with their own currency, from their own central bank, the annual consumer price inflation rates in Turkey (38%), Egypt (36%), Pakistan (29%), and the big-winner Argentina (116%) remain out of control. Imagine this: The consumer price inflation rate in Argentina is about 10% per month.
But of the two, deflation is much harder to get rid of. Once entrenched, deflation becomes the unwanted house guest that just won’t leave. And I think it just took up residency in Beijing.
Welcome to this week’s Steak House Index update.
Why You Should Care: The US economy and US dollar are the bedrock of the world’s economy.
But is the US economy expanding or contracting?
Expanding. Even as the FED rapidly raises rates! At the end of Q1, 2023, in ‘current-dollar’ terms, US annual economic output rose to an annualized rate of $26.53 trillion. After enduring the fastest FED rate hike in over 40 years, America’s current-dollar GDP still increased at an annualized rate exceeding 6% during the first quarter of 2023. No wonder the FED is so concerned. The world’s annual GDP rose to over $100 trillion as 2022 began. And according to the IMF, in June of this year, current-dollar global GDP eclipsed $105 trillion! IMF forecasts call for global GDP to reach almost 135 trillion by 2028. America’s GDP remains around 25% of all global GDP. Collectively, the US, the euro zone, and China still generate about 70% of the global economic output. These are the 3 big, global players. They bear close scrutiny.
The objective of this blog is singular.
It attempts to predict the direction of our GDP ahead of official economic releases. Historically, ‘personal consumption expenditures,’ or PCE, has been the largest component of US GDP growth — typically about 2/3 of all GDP growth. In fact, the majority of all GDP increases (or declines) usually results from (increases or decreases in) consumer spending. Consumer spending is clearly a critical financial metric. In all likelihood, the most important financial metric. The Steak House Index focuses right here … on the “consumer spending” metric. I intend the SHI10 is to be predictive, anticipating where the economy is going – not where it’s been.
Taking action: Keep up with this weekly BLOG update. Not only will we cover the SHI and SHI10, but we’ll explore “fun” items of economic importance. Hopefully you find the discussion fun, too.
If the SHI10 index moves appreciably -– either showing massive improvement or significant declines –- indicating growing economic strength or a potential recession, we’ll discuss possible actions at that time.
The Blog:
My wife and I have a couple of cats. Yeah, we’re cat people. What can I say? 🙂
Anyway, it was my turn to pick up some cat food, so I shot over to PetSmart. I was gob-smacked by the prices. In many cases, cat food prices were double pre-pandemic prices. At a minimum, they were up 50%. This, folks, is inflation!
Do I believe cat food prices will come down any time soon? No. Like most other consumer goods within the US economy, I fear cat food prices are now and forever higher.
The CPI-u – the broadest measure of consumer price inflation – increased 18.2% between June of 2020 and June of 2023. So, in theory, I can attribute some portion of the increase to inflation. Using an “inflation deflator” to convert the average 60% cat food price increase from ‘nominal’ dollars – the ones I pay at the check-out counter – and ‘real,’ or inflation-adjusted, dollars, I’m still paying at least 40% more for the same cat food I bought 3 years ago. Well, it’s not the same food, of course. You know what I mean.
Here’s the the thing about inflation in the US: Its impact across the 80,000 items measured monthly by the BLS vary significantly. Some items show little change; others, massive increases. Apparently cat food is in the latter group.
Over in China, however, consumer prices did not rise at all in the year to June. In fact, as measured by the country’s GDP deflator the price of goods and services fell by 1.4% in the second quarter, compared with a year earlier. That is the biggest decline since 2009. Price declines, once entrenched, create their own vortex or negative feedback loop, so to speak. Over time declines erode corporate profits, and stock market prices tend to fall consistently thereafter. Price declines typically depress consumer confidence, and reduce both consumer and corporate borrowing … which then only adds to the building deflationary pressures. The negative feedback loop is easy to see.
In systems with high inflation, debtors make out like bandits. Borrowed money, as we all know, is repaid in the future with ‘nominal’ dollars — not those ‘real’ inflation adjusted dollars. For example, suppose you borrow $1 million as part of a home purchase at a time when inflation is running, say, 10% per year. Essentially, ignoring principal reduction for the moment, one year after you bought your home, you still owe $1 million. But if we adjust that loan balance for the 10% inflation, one year later, you only owe $900,000 in inflation-adjusted dollars. Year after year, inflation erodes the ‘real’ value of the loan held by your lender. They lose. You win. And this ignores the value appreciation caused by inflation! Of course, the value increase only reflects the ‘nominal’ or current-dollar value of the home. Inflation adjusted, your home is still worth what you paid for it. But no homeowner thinks of their home value in inflation-adjusted terms. Market value ignores inflation adjustments.
The opposite is true, of course, in a deflationary economy. In this same example discussed above, one year later, you still owe the original $1 million. But if deflation is running 10% per year, one year later you essentially owe $1.1 million in ‘real’ dollars after inflation-adjustment. Year after year, deflation increases the ‘real’ value of the loan held by your lender. They win. You lose. And your home will likely lose value too. Assets often lose value in a deflationary economy. In this world, the consumer quickly learns borrowing money is a mistake. New loan demand shrinks, consumer spending falls, corporate profits suffer, and so on. GDP falls. Wealth declines … and so does overall standards of living.
Why might China be entering this downward price spiral? The seeds were planted almost 50 years ago. Post-Covid consumer anxiety in a very different China may have been the recent catalyst.
I primarily blame the problem on their “one child policy” enacted in 1979 to curb the country’s rapid population rise. Remember: Economically speaking, China was a very different country back then. Fears of overpopulation and potential starvation were blamed for the draconian policy, which was finally reversed in 2016. However, by then, the damage was done. China is quickly becoming an “old” country. Overall population is already shrinking today.
Consider this chart, courtesy of the New York Times.
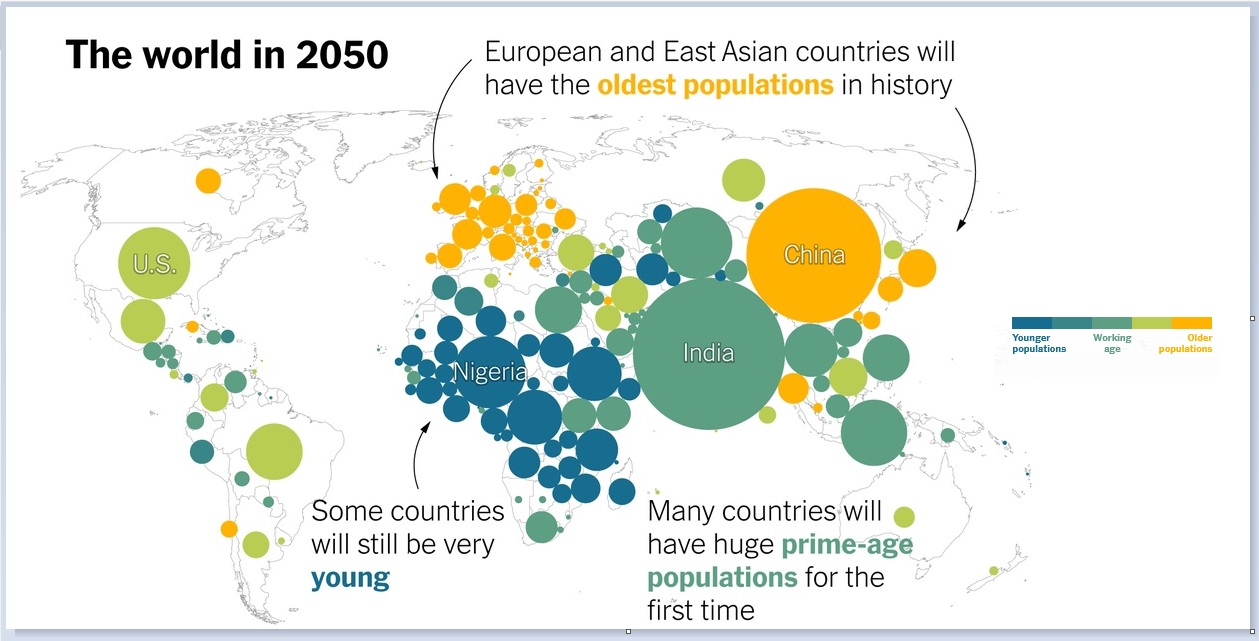
By 2050, the average age in western Europe and China will be high. Assuming fertility and immigration rates in both regions remain at their exceptionally low levels, this outcome is unlikely to change. This outcome was baked into their long-run demographic choices years ago.
Japan has struggled under similar conditions and constraints. Deflation has been entrenched in Japan for decades. Until very recently, at best, consumer prices remained flat. Usually, year after year, they fell. Japan’s GDP is lower today than it was in the early 1990s.
We may not love inflation very much here in the United States. But inflation is a far better outcome — even the moderately excessive inflation we’re experiencing today. Because in the current American scenario, consumer spending, consumer borrowing, corporate profits, and the stock market all have the potential to grow. If China enters a deflationary spiral, they will not. If they follow Japan into entrenched deflation, China’s economy will be broken.
Japan’s stock market index, the JP225, has climbed from below 10,000 in 2010 to over 32,000 today. However, the index peaked back in 1989 at almost 39,000. Which means today, Japan’s stock index value is lower than it was more than 30 years ago. $1 dollar invested in 1989 is worth about 82 cents today. And this is a ‘nominal’ number, unadjusted for the effects of inflation.
I love this quote: According to John Templeton a famous American stock-picker from almost a century ago, “bull markets are born on pessimism, grow on skepticism, mature on optimism and die of euphoria.”
Bull markets are impossible in a deflationary, shrinking economy. So are growing economies. Inflation is a good thing. Even if cat food costs a lot more.
Let’s head to the steak houses. We have another week of fairly consistent results.
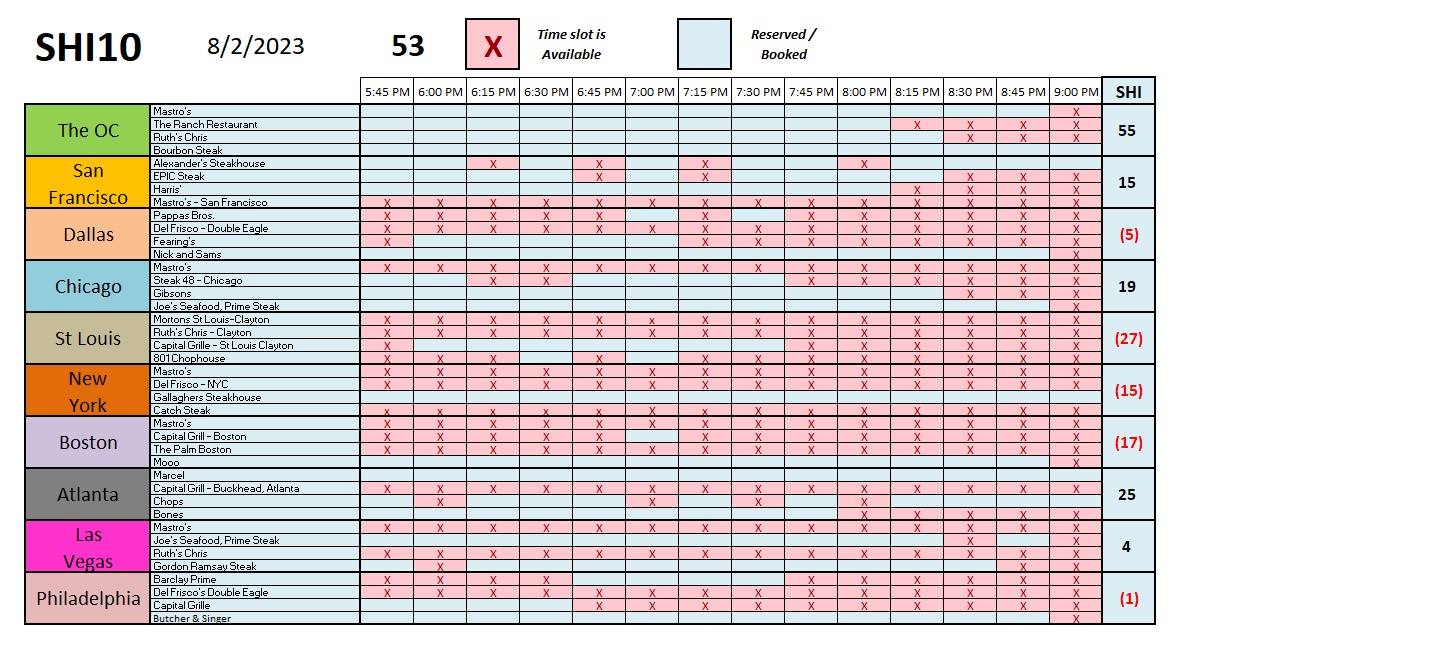
For the third week in a row, the SHI10 is right around 50. Stable. Consistent. Here the longer-term chart.
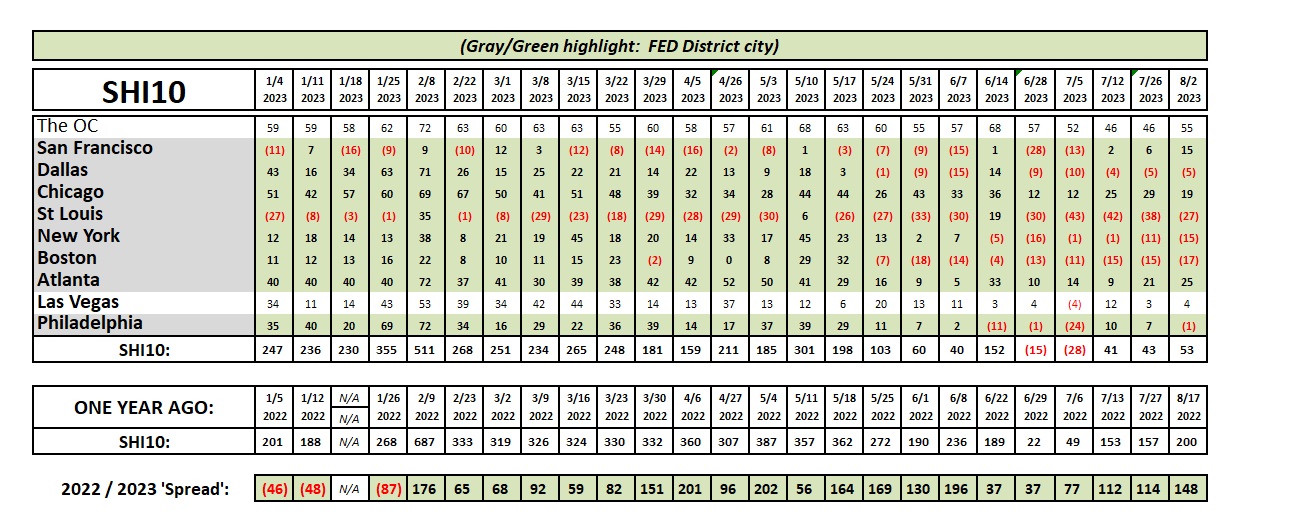
The ‘advance’ estimate of second quarter United States GDP was ‘released’ the day after last week’s blog. Growth for the quarter was 2.4% ‘real’ and 4.7% ‘nominal’ — or current dollar before inflation adjustment. I had commented in prior blogs the SHI10 was suggesting GDP was slowing. This is true. GDP growth did slow. In Q1, nominal GDP grew 6.1%. But make no mistake, a 4.7% nominal growth rate is still quite robust. This is a preliminary result and it will likely be adjusted as additional data becomes available in future months. But thru any economic lens, Q2 growth was stellar.
Will Q3 follow the same course? Probably not … I think the ‘lag effects’ from the FED rate hikes will become more prominent over time. However, I still expect positive GDP growth … and I see no recession on the horizon at this time.
Enjoy your steak.
<:> Terry Liebman