SHI 8.2.23 – Broken China
August 2, 2023SHI 8/16/2023 – Housing, Prepared 3 Ways
August 16, 2023
Debt is a good thing.
Debt fuels economic growth. Without it, consumer spending is muted … businesses cannot expand … governments cannot operate.
Debt is a bad thing.
Excessive debt can slow economies, trigger a deflationary spiral, and bankrupt individuals and governments. Cheap or easy debt sometimes inspires poor or irrational choices.
So which is it? Good or bad?
The answer, of course, is both. Debt is simply a tool. Used properly, it can improve individual lives and social conditions. Used to excess, it has the power to destroy. And throughout history it often has.
“
Are we in a debt crisis?’“
The US consumer now carries about $17 trillion in total debt on their collective balance sheets. $1 trillion of that is credit card debt, according the the New York FED.
By the end of this fiscal year, the US government will owe over $25 trillion in “public debt”.
Without context, these exceptionally large numbers are frightening. Without additional data, you have every right to be worried, asking questions like, “Is the consumer in debt trouble?” And “How about America? Are one or both on the edge of a debt cliff … about to fall over, triggering default and pain for American citizens?”
The recent credit downgrades of both US Treasury debt and many of our community banks might suggest the answers are yes. Let’s take a look.
Welcome to this week’s Steak House Index update.
Why You Should Care: The US economy and US dollar are the bedrock of the world’s economy.
But is the US economy expanding or contracting?
Expanding. Even as the FED rapidly raises rates! At the end of Q1, 2023, in ‘current-dollar’ terms, US annual economic output rose to an annualized rate of $26.53 trillion. After enduring the fastest FED rate hike in over 40 years, America’s current-dollar GDP still increased at an annualized rate exceeding 6% during the first quarter of 2023. No wonder the FED is so concerned. The world’s annual GDP rose to over $100 trillion as 2022 began. And according to the IMF, in June of this year, current-dollar global GDP eclipsed $105 trillion! IMF forecasts call for global GDP to reach almost 135 trillion by 2028. America’s GDP remains around 25% of all global GDP. Collectively, the US, the euro zone, and China still generate about 70% of the global economic output. These are the 3 big, global players. They bear close scrutiny.
The objective of this blog is singular.
It attempts to predict the direction of our GDP ahead of official economic releases. Historically, ‘personal consumption expenditures,’ or PCE, has been the largest component of US GDP growth — typically about 2/3 of all GDP growth. In fact, the majority of all GDP increases (or declines) usually results from (increases or decreases in) consumer spending. Consumer spending is clearly a critical financial metric. In all likelihood, the most important financial metric. The Steak House Index focuses right here … on the “consumer spending” metric. I intend the SHI10 is to be predictive, anticipating where the economy is going – not where it’s been.
Taking action: Keep up with this weekly BLOG update. Not only will we cover the SHI and SHI10, but we’ll explore “fun” items of economic importance. Hopefully you find the discussion fun, too.
If the SHI10 index moves appreciably -– either showing massive improvement or significant declines –- indicating growing economic strength or a potential recession, we’ll discuss possible actions at that time.
The Blog:
Debt is not a new thing. It’s been around almost as long as humans. In their book, “THIS TIME IS DIFFERENT” … Eight Centuries of Financial Folly, by Carmen Reinhart and Ken Rogoff, the authors study 66 countries across about 800 years and conclude financial disasters are the result of consistent patterns. Of course, each time, the experts have chimed, “this time is different”―claiming that the old rules no longer apply and that the new situation bears little similarity to past disasters. The authors ultimately concluded, however, those experts are wrong. Same disaster, new century.
Of course, things are always different, changing, evolving. However, one thing is not different … and probably never will be: The fact that a larger pile of debt eventually and inevitably costs the debtor more than a smaller pile of debt. Such is life.
According to the NY FED, here are the most current consumer debt numbers:
“Total household debt rose by $16 billion to reach $17.06 trillion in the second quarter of 2023, according to the latest Quarterly Report on Household Debt and Credit. C redit card balances saw brisk growth, rising by $45 billion to a series high of $1.03 trillion. Other balances, which include retail credit cards and other consumer loans, and auto loans increased by $15 billion and $20 billion, respectively. Student loan balances fell by $35 billion to reach $1.57 trillion, while mortgage balances were largely unchanged at $12.01 trillion.”
Along with the written data above, they posted this image:
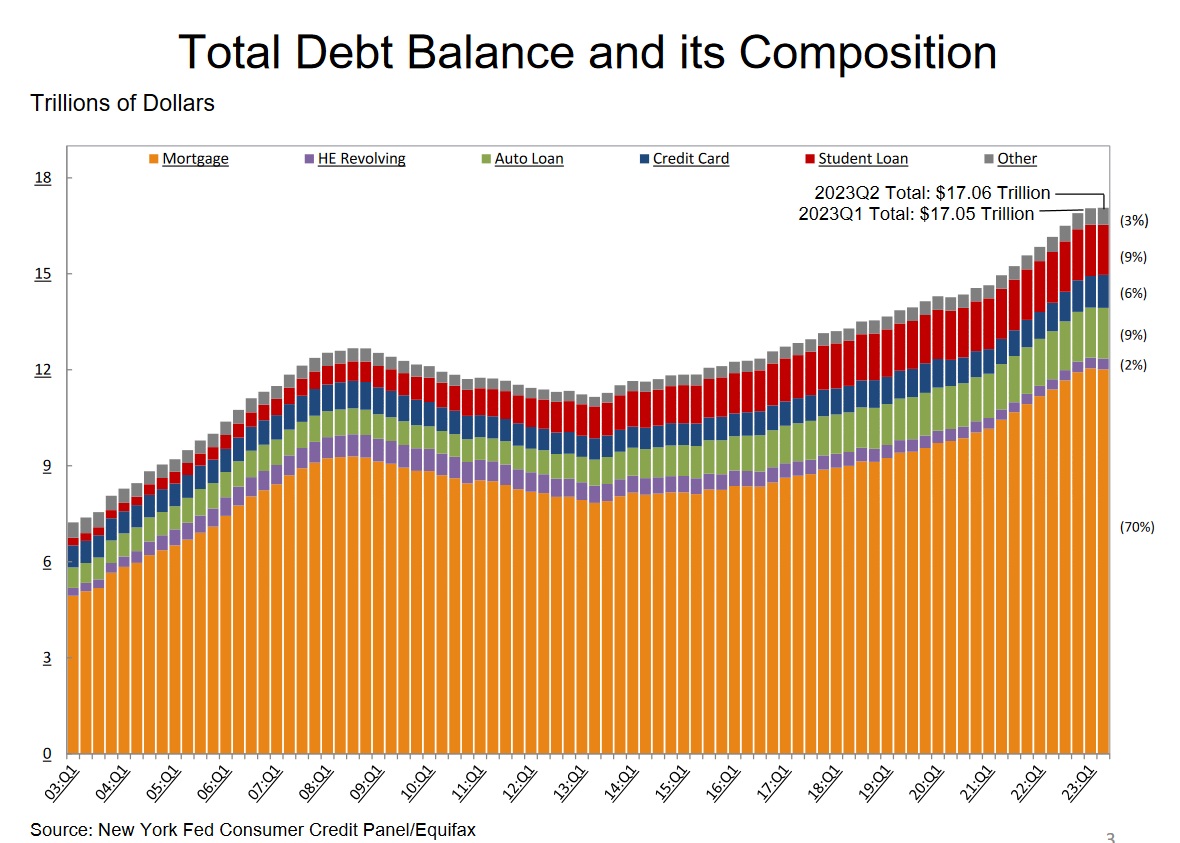
At $17 trillion today, consumer debt levels are high — higher, in fact, than they have ever been. Once again, however, we need to consider context. First, do you remember those two supremely important metrics used when reporting GDP growth? I’m talking about the words “real” and “nominal,” or current-dollar? This $17 trillion “Total Debt Balance” number is nominal — meaning it has not been adjusted for inflation. The prior peak, reached in 2008, was about $12.7 trillion. Since that time, consumer price inflation has increased 43%. So, if we “deflate” that $17 trillion into 2008-equivalent dollars, the number shrinks to $11.8 trillion — almost $1 trillion less than that prior peak. Thus, after adjusting for inflation, today’s consumer is actually carrying a smaller debt load than back in 2008.
Is this the correct lens to use for context here? Sure, this is helpful. However it doesn’t answer the question the all-important question about debt service levels — the actual monthly carrying cost of the consumer debt. The good news here is that monthly carrying cost is also down significantly. In the image above, housing debt is around $12 trillion. In 2008, housing debt carried a significantly higher interest rate than today. In fact, according to Bankrate, mortgage debt averaged over 6.3% in 2008 … but only about 3.2% today. That’s a 300 basis point difference — actually, that’s about half the interest expense experienced in 2008. In my opinion, housing debt costs are under control.
Credit card debt, however, is another story. It is quite a bit more expensive today. Depending on who you ask, today average rates are over 20%. Ouch. That’s expensive. Is this a problem? Well, certainly for the credit card debtors. But — I know this sounds bad — it’s only $1 trillion. Only. Right? 🙂
Let’s move to the federal debt question:
Are we nearing the tipping point where annual deficits and rising interest costs threaten to push US debt levels to ever accelerating and unsustainable levels … eventually resulting in a collapse?
No. I don’t think so. Not yet, anyway. Consider this image from data and forecasts of the Congressional Budget Office:
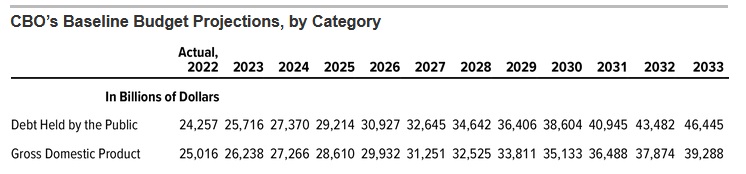
By the end of fiscal 2023, the US spending deficit will push the “debt held by the public” to almost $26 trillion. At this level, public US debt is almost equal to 100% of our annual GDP. Using annual GDP as a yardstick is a useful measure.
Once again, it is critically important to discuss the metrics “real” vs “nominal,” or current-dollars. The public debt number above is not inflation adjusted. Thus it is a current-dollar, or nominal, figure. The same is true with the GDP figures shown. These figures, too, are current-dollar. It’s critically important to compare “apples to apples” in this type of analysis.
The CBO‘s numbers for “Debt Held by the Public” should concern you. The CBO forecast suggests number will almost double in the next 10 years. Wow. I don’t know about you … but I’m concerned. Without context, that sounds like a run-away train to me.
So let’s find some context: America’s GDP — again, our ‘nominal’ or ‘current dollar‘ annual GDP — has been growing significantly in the past decade — with the exception of 2020, of course. Remember, the current-dollar figure is always higher than the “real” number. Why? Because the current-dollar GDP number is the sum of the real GDP number plus inflation. So if the real GDP figure clocks in at, say, 2.6% … and if inflation is 3% … then the nominal GDP figure is the sum of the two, or 5.6%.
I prepared the chart below from a variety of different data sources. It’s a lot of numbers … I know … but let’s try to plow thru the numbers as this is a meaningful analysis. At least I think it is. 🙂
OK, take a look at the left column. These are the years 2012 thru 2022. These are actual numbers. The numbers highlighted in green reflect the actual annual GDP growth rate during each year. Remember: These are ‘current-dollar’ or nominal annual percentage numbers:
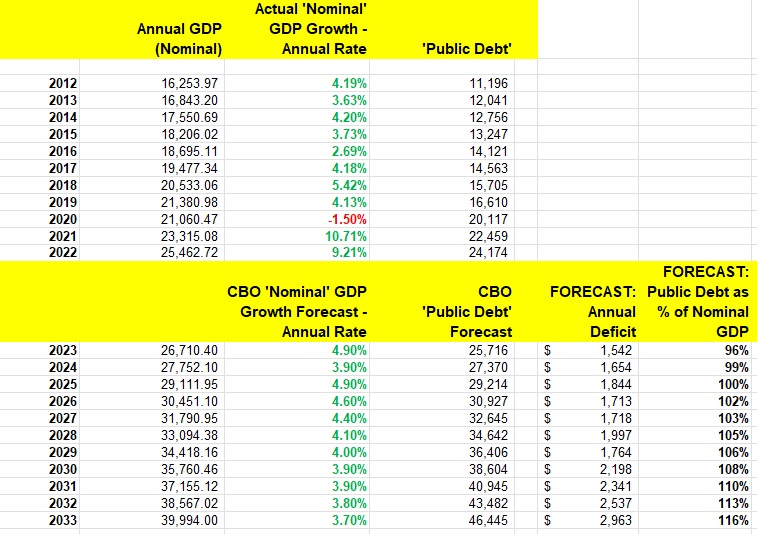
By any measure, nominal GDP growth has been robust in the past 10 years. This may surprise you. The official GDP number is always the real number … and as such, always much lower. However, we live in a nominal world. The US public debt is always reported in nominal figures. As are all budget and deficit numbers. The conversion to ‘real’, or inflation adjusted, is simply a methodology to assess economic growth without inflation.
But inflation is a fact of life. And thus, nominal public debt numbers must be compared to nominal GDP growth rates. That comparison takes place in the forecast for 2023 thru 2033 above. Yes, the public debt numbers are projected to grow at a staggering rate. Downright frightening.
But if the nominal GDP numbers follow the projected path shown above, public debt as a percentage of GDP does not accelerate uncontrollably. By the end of 2023, the percentage is forecast at 96%. Ten years later, at the end of fiscal 2033, that number is forecast to grow to 116%. This is a worrisome trend, of course, but not a cause for financial hysteria. Like you, I’d rather see it go the other direction. Time will tell.
However, it’s important to highlight the fact that both consumer and federal debt levels are high. Quite high. But at least consumer debt levels are falling as a percentage of total consumer assets. In other words, the “net worth” of Americans, in the aggregate, has grown significantly in the past 10 years. Household net worth, according to the latest FED Z.1 report, was about $80 trillion at the end of 2012. Today, household net worth is over $148 trillion. Clearly, consumer debt as a percentage of total assets is falling year after year.
This analysis cannot be done for the US. There is no comparable data. And that’s why the “public debt-to-GDP” metric is the best lens we have. And thru that lens, if annual budgets and deficits, interest rates, and GDP growth rates in the next 10 years perform as expected, our metric will increase from about 96% to 116%. That concerns me.
Not to the point where I won’t sleep tonight … but it concerns me. It should concern you too.
It’s time to drink copiously. To the steakhouses!
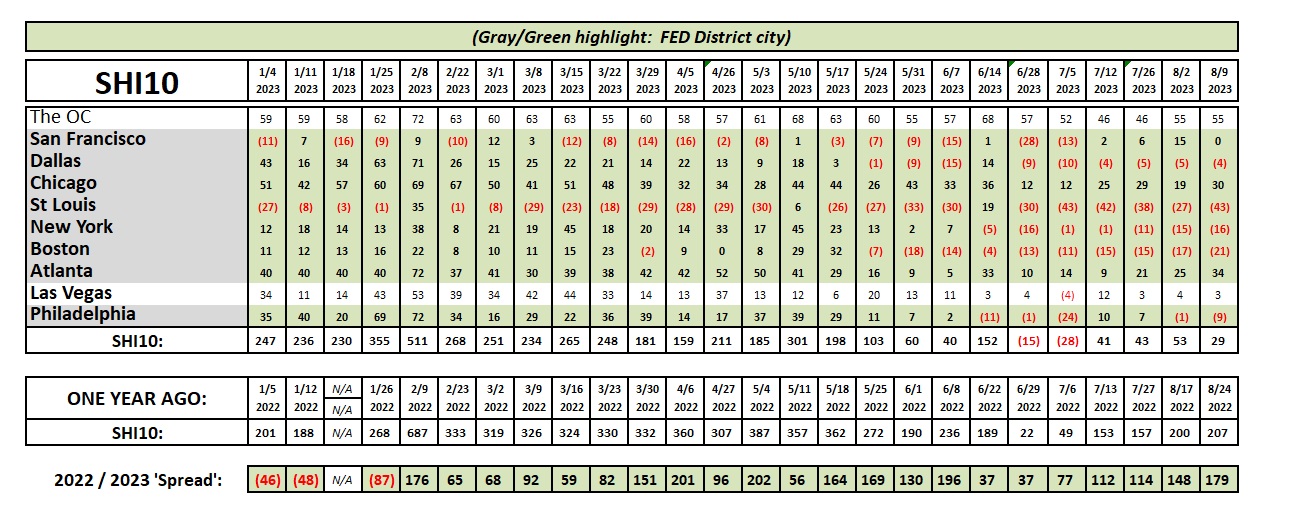
Not much new here. Another week … another SHI10 with little change. Steady sailing here, folks. Fear not, our economy remains sound.
🙂
<:> Terry Liebman