
SHI 8/16/2023 – Housing, Prepared 3 Ways

SHI 8.9.23 – 2 Sides of the Same Coin
August 9, 2023
SHI 8.23.23 – Defying Gravity
August 23, 2023
A place to live. It’s one of the “Big 3.”
Housing, food and clothing are the three human necessities. Generally speaking, one cannot survive, long-term, without each of these 3. Unlike used cars, these are basic needs and not simply “nice to haves.”
Which is why they make up the majority of the Consumer Price Index. Housing, in total, comprises about 40% of the CPI calculation. So, clearly, when we’re talking consumer inflation, housing costs loom large.
“
What’s up with housing?’“
“What’s up with housing?’“
What’s up with housing, of course, is the price. As we all know. Buying a home today, depending on location and price range, generally costs more than a year ago. And so does renting a home. Prices are generally up. So are rents. But it’s important, once again, to differentiate between home values and the cost of rent. Home values have little, if any, impact on the CPI. However counterintuitive this may seem, it is true. Buying a home is considered “investment” and, unlike paying rent, not consumption by a consumer. Rent paid for a ‘primary dwelling’ is considered consumption and, as such, is a large and important component of the CPI.
In the 12 months ending July of 2023, the cost of “Shelter” as measured by the CPI, was up 7.7% for the year — far more than the Y-O-Y increase in food (4.9%) and clothing (3.2%). So, by extension, a big reason the CPI is up significantly from a year ago is the cost of renting.
Will this trend continue? Will housing numbers keep the CPI running as hot as the grill at Mastros? Or will rental costs finally turn the corner and chill like a bottle of Dom? Yes, it is true: The food metaphors run thick as molasses here at the Steak House Index. 🙂
Welcome to this week’s Steak House Index update.
If you are new to my blog, or you need a refresher on the SHI10, or its objective and methodology, I suggest you open and read the original BLOG: https://www.steakhouseindex.com/move-over-big-mac-index-here-comes-the-steak-house-index/
Why You Should Care: The US economy and US dollar are the bedrock of the world’s economy.
But is the US economy expanding or contracting?
Expanding. Even as the FED rapidly raises rates! At the end of Q1, 2023, in ‘current-dollar’ terms, US annual economic output rose to an annualized rate of $26.53 trillion. After enduring the fastest FED rate hike in over 40 years, America’s current-dollar GDP still increased at an annualized rate exceeding 6% during the first quarter of 2023. No wonder the FED is so concerned. The world’s annual GDP rose to over $100 trillion as 2022 began. And according to the IMF, in June of this year, current-dollar global GDP eclipsed $105 trillion! IMF forecasts call for global GDP to reach almost 135 trillion by 2028. America’s GDP remains around 25% of all global GDP. Collectively, the US, the euro zone, and China still generate about 70% of the global economic output. These are the 3 big, global players. They bear close scrutiny.
The objective of this blog is singular.
It attempts to predict the direction of our GDP ahead of official economic releases. Historically, ‘personal consumption expenditures,’ or PCE, has been the largest component of US GDP growth — typically about 2/3 of all GDP growth. In fact, the majority of all GDP increases (or declines) usually results from (increases or decreases in) consumer spending. Consumer spending is clearly a critical financial metric. In all likelihood, the most important financial metric. The Steak House Index focuses right here … on the “consumer spending” metric. I intend the SHI10 is to be predictive, anticipating where the economy is going – not where it’s been.
Taking action: Keep up with this weekly BLOG update. Not only will we cover the SHI and SHI10, but we’ll explore “fun” items of economic importance. Hopefully you find the discussion fun, too.
If the SHI10 index moves appreciably -– either showing massive improvement or significant declines –- indicating growing economic strength or a potential recession, we’ll discuss possible actions at that time.
The Blog:
Lets take a look at three different housing metrics.
Some economic trends are easier to spot than others. In the macro, home values and rents are two that are somewhat predictable, over the mid- to long-term because the data is so complete and compelling. Consider this chart courtesy of the Census Bureau:
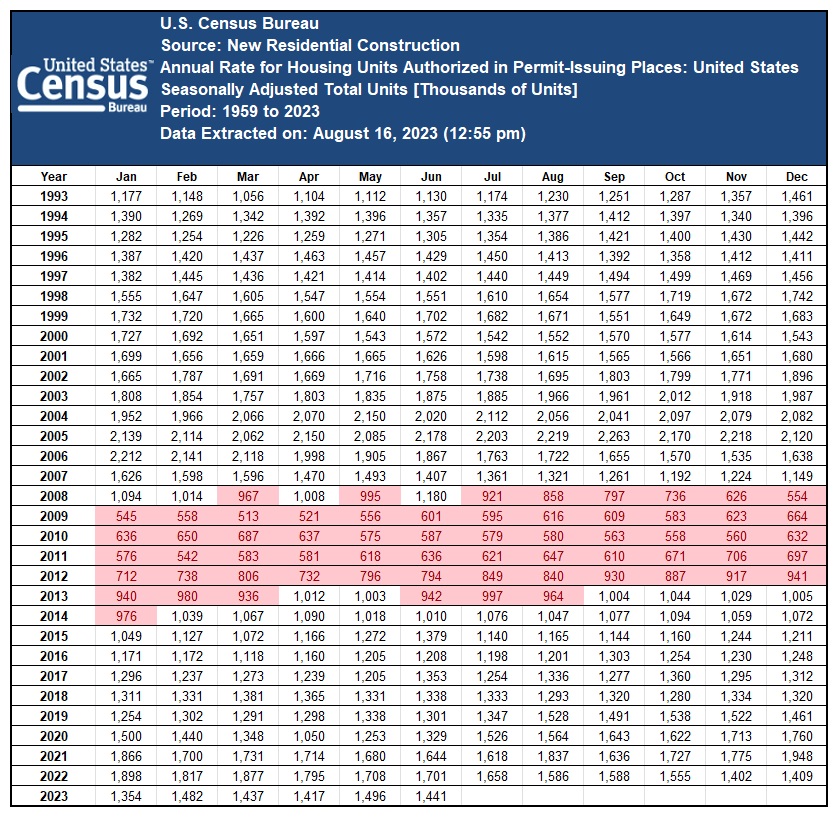
The original data set provided by the Census Bureau actually began in 1959. For brevity sake, I trimmed the series and show data starting in 1993 — 30 years ago. And I added the ‘conditional formatting’ to highlight in red any month when the “annualized” rate of new housing construction had a run-rate below 1 million.
Take a look at the chart. Notice anything interesting? That’s right: From 2008 thru much of 2013, the new home construction rate was below 1 million new units per year. From around 1998 thru 2007, that rate was generally over 1.5 million … and during 2005, it exceeded 2 million.
The “Great Recession of 2008” stopped all that.
Whatever excess new home construction the US may have experienced before 2008 was completely “absorbed” in the next 5 to 10 years. And then, the annual construction number went up, up, and up, … year after year, until the end of 2021.
The FED rate increase cycle quickly reversed this trend. Single-family home builders believed the good times were over … and slowed new home construction. Little did they know that very few ‘existing home owners’ had any intention of selling their home while holding a sub-3% mortgage rate. But multi-family builders kept right on going … building new apartment units as fast as possible. And that trend continues today.
Home values and rents were both “soft” during the 5 years following the great recession. But during that same period, insufficient new units were added to the existing supply. Increasing demand met inadequate supply and the price of both homes and rents increased dramatically. Ultimately adding one more trigger for a much higher CPI reading.
Why is the 1 million number important? It isn’t. It is simply a useful metric to make my point. During the sub-million years, new supply trailed demand, setting the table for large price increases over the coming years.
More recently, year-after-year, new construction supply exceeded demand levels, setting the stage for future years where excess supply will exceed demand.
Permit me to summarize and simplify: This data suggests home values and rental rates may soften during the next 3-7 years. I use the word “may” because this is not an exact science. There are more variables to consider than simply new construction. Demographics plays into the equation. As do household formation levels. And immigration, too, plays a part. As does geography. But in the macro, at the highest level, the trend is relatively easy to spot.
Am I suggesting home values will fall? No, I am not. Generally, I continue to expect well located homes to appreciate more rapidly than the inflation rate. But I think the days of 20% annual value increases are behind us.
Rent price increases, on the other hand, are likely to moderate meaningfully. In some areas of the country, I expect them to fall. Not appreciably, but fall nonetheless. Which brings us full circle back to the CPI discussion. New supply will ultimately cause rental prices to come in line, thereby helping moderate future CPI readings. In the not too distant future, you might even see <GASP!> a ‘negative‘ month-over-month housing value in the CPI figures. When? Hard to say. Remember, this is a very high level, macro-trend commentary.
The above chart is pretty dense. Perhaps a graphic image will make the picture easier to see:
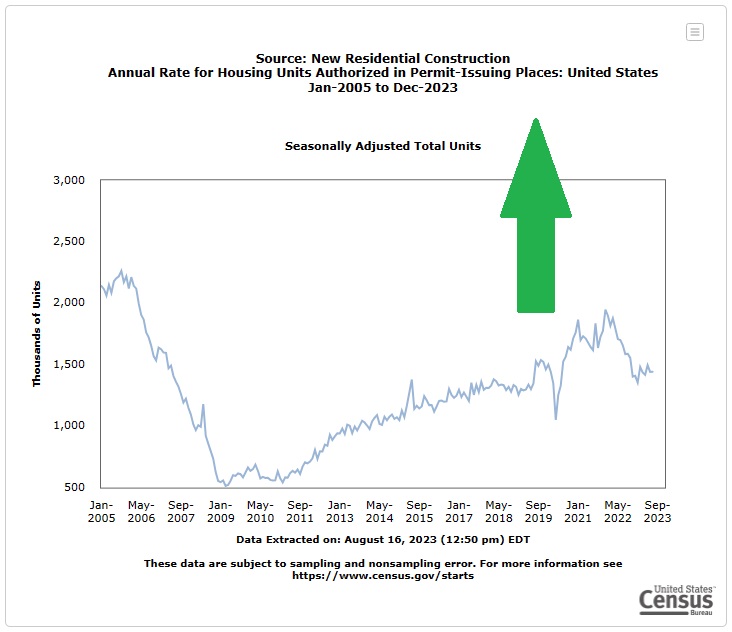
The “up-trend” following the great recession is easy to see. As is the “down-trend” beginning with the FED rate hikes at the beginning of 2022.
I promised you ‘housing,’ prepared three ways. Above are the first 2 … here’s the third:
TO THE STEAK HOUSES!
True, I cheated. Steak houses are not ‘housing’ in any traditional sense. But they do ‘house’ steaks! And wine!
Let’s see how reservation demand at the SHI10 steakhouses looks this week.
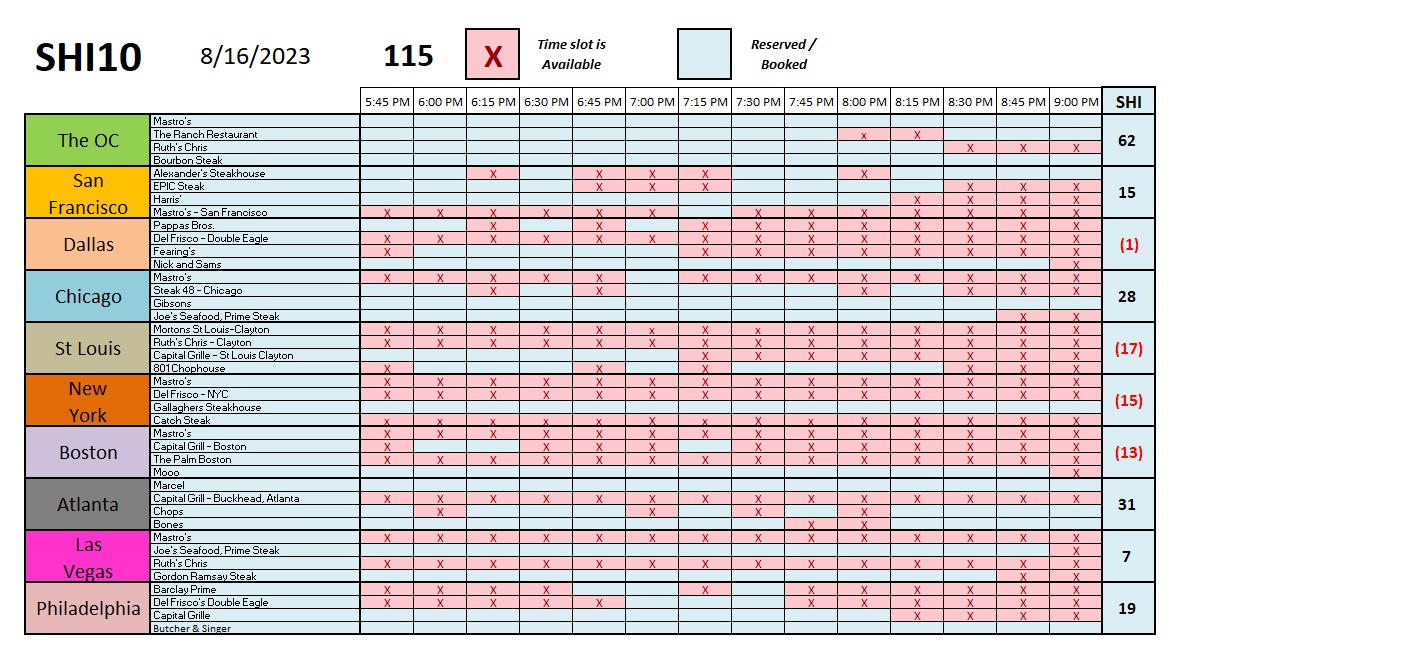
It’s actually a pretty good week for our 40 steakhouses. Reservation demand is generally up. Even in San Francisco! Demand in Philly is quite a bit stronger — their SHI is no longer in the red. Here’s the longer term trend chart:
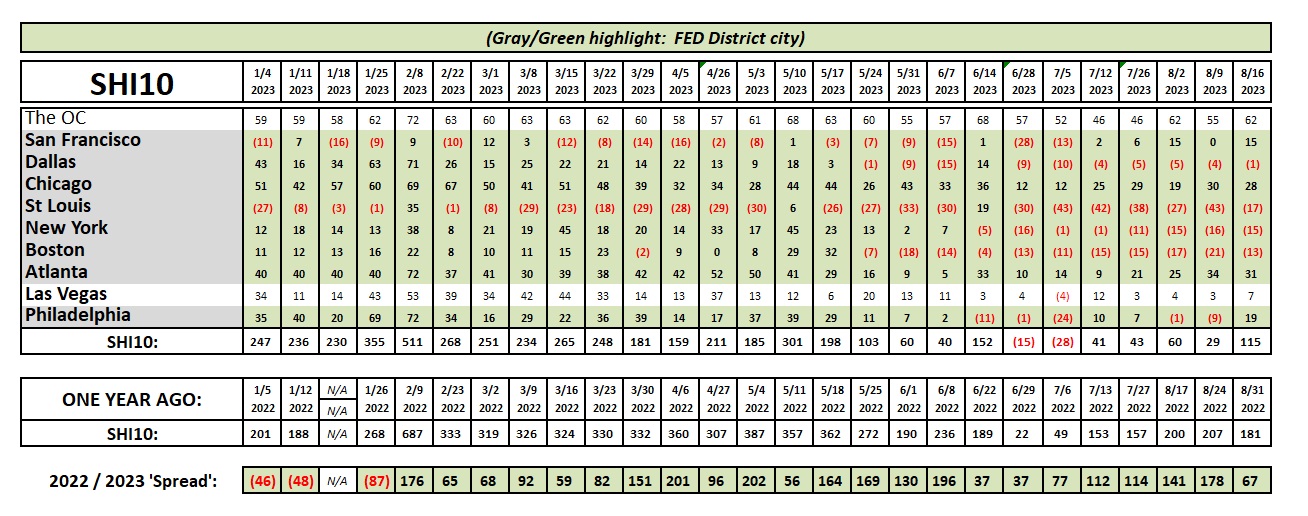
This weeks SHI10 reflects the same consistency we’ve seen for some time now. The US economy is simply chugging along.
For those of you who live for my weekly updates, I wanted to let you know there will be no SHI blog on 8/30, 9/20 or 9/27. I know. Very disappointing. It’s difficult to get anyone to work hard these days! 🙂
<:> Terry Liebman


