
SHI 8.23.23 – Defying Gravity

SHI 8/16/2023 – Housing, Prepared 3 Ways
August 16, 2023
SHI 9.6.23 – Reading the Signs
September 6, 2023
Yes, that’s a squirrel taking a ‘selfie.’
And defying gravity at the same time. I know what you are thinking …
“
Why doesn’t he have an iPhone?’“
“Why doesn’t he have an iPhone?’“
No? That wasn’t your question?
OK, right, you are wondering what an upside-down squirrel taking a selfie while defying gravity has to do with economics and finance? Well let me tell you….
Welcome to this week’s Steak House Index update.
If you are new to my blog, or you need a refresher on the SHI10, or its objective and methodology, I suggest you open and read the original BLOG: https://www.steakhouseindex.com/move-over-big-mac-index-here-comes-the-steak-house-index/
Why You Should Care: The US economy and US dollar are the bedrock of the world’s economy.
But is the US economy expanding or contracting?
Expanding … FED rate increases notwithstanding! At the end of Q2, 2023, in ‘current-dollar‘ terms, US annual economic output rose to an annualized rate of $26.84 trillion. After enduring the fastest FED rate hike in over 40 years, America’s current-dollar GDP still increased at an annualized rate of 4.7% during the second quarter of 2023. Even the ‘real’ GDP growth rate was strong … clocking in at the annual rate of 2.4% during Q2. No wonder the FED is concerned.
The world’s annual GDP first grew to over $100 trillion in 2022. According to the IMF, in June of this year, current-dollar global GDP eclipsed $105 trillion! IMF forecasts call for global GDP to reach almost $135 trillion by 2028 — an increase of more than 28% in just 5 years.
America’s GDP remains around 25% of all global GDP. Collectively, the US, the European Common Market, and China generate about 70% of the global economic output. These are the 3 big, global players. They bear close scrutiny.
The objective of this blog is singular.
It attempts to predict the direction of our GDP ahead of official economic releases. Historically, ‘personal consumption expenditures,’ or PCE, has been the largest component of US GDP growth — typically about 2/3 of all GDP growth. In fact, the majority of all GDP increases (or declines) usually results from (increases or decreases in) consumer spending. Consumer spending is clearly a critical financial metric. In all likelihood, the most important financial metric. The Steak House Index focuses right here … on the “consumer spending” metric. I intend the SHI10 is to be predictive, anticipating where the economy is going – not where it’s been.
Taking action: Keep up with this weekly BLOG update. Not only will we cover the SHI and SHI10, but we’ll explore “fun” items of economic importance. Hopefully you find the discussion fun, too.
If the SHI10 index moves appreciably -– either showing massive improvement or significant declines –- indicating growing economic strength or a potential recession, we’ll discuss possible actions at that time.
The Blog:
Defying gravity. That’s what the US economy has been doing, seemingly overcoming insurmountable odds.
For more than a year, financial and economic experts have raised the alarm that a tidal-wave-like recession is almost upon us. Remember, a recession is generally defined as two consecutive calendar quarters experiencing contracting GDP.
That clearly hasn’t happened. Not only has GDP maintained consistent growth, the GDP growth rate has been on a tear! How else can you describe the most recent (Q2, 2023) annualized GDP reading when compared to the same quarter in 2019, the last “normal” year before the pandemic? According to the U.S. Bureau of Economic Analysis, current dollar GDP rose to the annualized rate of $26.84 trillion during Q2, 2023. During Q2 of 2019, that number was $21.27 trillion. Doing the math, we see the current GDP run-rate is up by more than 26%! In 4 years!
And then, this: The Atlanta FED released their most recent GDPNow forecast on August 16th — 5.8%. And remember: That’s a real GDP growth rate! Meaning the ‘current-dollar’ growth rate is significantly higher! This forecast bears repeating:
The Atlanta FED is predicting 5.8% ‘real’ GDP growth in Q3.
Consider their graphic (note: I added the ‘green arrow‘ for emphasis):
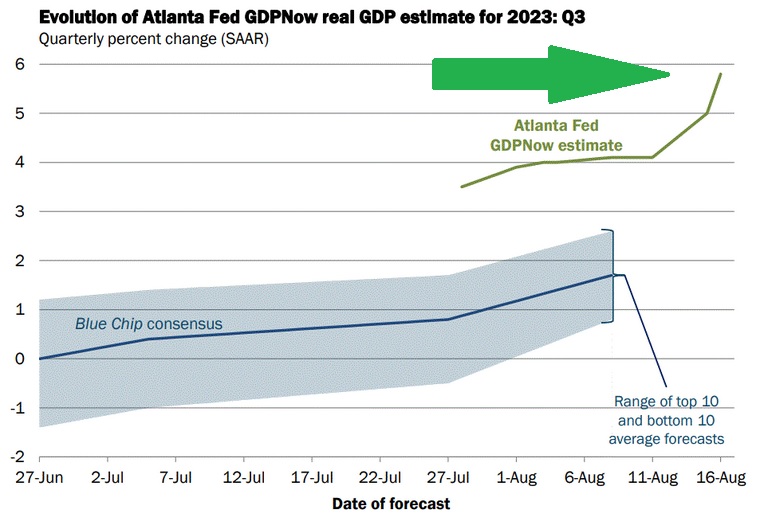
Wow. A forecast for a 5.8% ‘real’ GDP growth rate in Q3. Staggering. Absolutely staggering.
Do I agree? Could the forecast prove true?
No. I think their forecast is off. I believe it is way too high. For a number of reasons.
First and foremost, the SHI10 is telling us the ‘froth’ is off the cappuccino — reservation demand at our most expensive steak houses across America is definitely down. Meaningfully. If the US economy was running as hot as the Atlanta FED forecast, I feel our expensive eatery grills would be doing the same. But, alas, they are, at best, lukewarm. Demand is down significantly from Q1 of this year. Significantly. But as you’ll see below, it does not seem to be trending down. To my eye, the data suggests the economy has simply shifted from super hot … to a low heat setting. Like your medium-rare steak — red and slightly warm in the middle.
Second, because of gravity. Gravity is real. ‘What goes up, must come down,’ right? Eventually. Physics is a real thing. Eventually, gravity will do its job.
And yet, so far, the U.S. economy has defied the gravity of 525 bps worth of Fed rate hikes. In previous tightening cycles, by this time, GDP growth would be closer to zero. Not over 5%. Surprisingly, in spite of the 525 basis point rate hikes, pushing home loans over 7%, prime rate close to 8.5%, and credit card rates over 20%, consumer spending remains robust. Most people who want jobs still have them. Corporate profits remain relatively lofty. These facts, and more, are all seemingly defying gravity.
Consider the exceptionally low unemployment rate at 3.5%. This is a 50 year low! By this time in this tightening cycle, I would have expected unemployment at 4.5% or higher. The unemployment rate, too, is defying gravity.
Part of the explanation, of course, is the fact that the consumer remains flush with cash — all the news reports to the contrary notwithstanding. One could argue that the lowest income quartile has spent the majority of their pandemic windfall … and only the highest quartile remains flush. Perhaps. That is likely.
Another contributing factor is likely the consumer debt payment ratio, which remains below historic norms even as overall debt levels continue to increase.
Regardless, what is clear is that consumers remain eager to spend, even if the pace of that spending is slowing and purchases get thriftier. Low unemployment rates, strong cash positions, and lower debt-to-income ratios all help fuel consumer spending. But I am seeing signs of cooling.
Speaking of cooling, my thanks to CNBC for flashing this graphic as I was writing my blog!
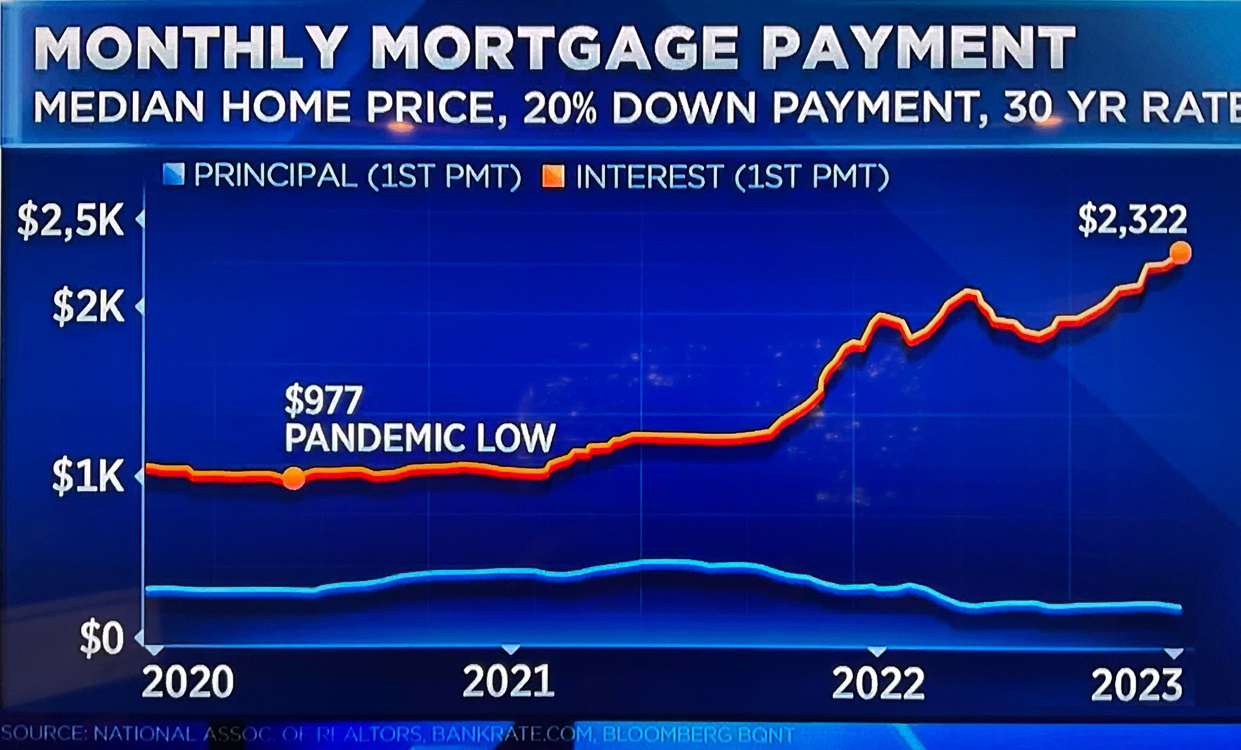
The graphic compares a ‘median’ home interest expense early in 2020 vs. today. $977 in a monthly interest expense back then — because of home mortgages rates in the mid- to high 2% range — would cost today’s borrower $2,322 in their first payment at today’s rates. That what a 7% home mortgage rate does to you.
The number itself isn’t overly meaningful — what is meaningful are two facts: First, the variables are consistent. We are comparing apples to apples — ‘first payment’ back then to ‘first payment’ now. Second, the change is applicable across the entire spectrum of housing debt amounts — from the ‘median’ home price up to the super-luxury home debt in California. What was near a 2.5% interest rate for a 30-year mortgage in early 2020 is now well north of 7%. It is inconceivable such a massive upward shift in home mortgage rates can defy gravity.
Of course, it has not. Existing home sales are way off their peaks. The weight of the FEDs 525 basis point hike has harmed home resales and must be causing harm elsewhere. The economy must be growing weaker, even if we cannot see many signs yet. The ‘lag effect’ is a just another way of saying gravity works — eventually.
Thus, I feel the Atlanta FED forecast is overly optimistic. Of course, if the actual number proves to be above 2%, in my opinion that will still be a huge win this late in the cycle. I simply cannot imagine a Q3 GDP growth rate above 5% given the massive weight of the FEDs rate hikes. Well see.
This debate leads us to another interesting question: … if the economy can rapidly grow under the weight of 525 bps, what does this suggest for the future of interest rates? Are we looking at a “higher, forever” future as opposed to a “higher, for longer”? If America’s economy can grow this fast with short-term rates above 5%, should the FED leave them there permanently? If yes, why did rates get so low in the first place?
These are all great questions … for the next blog! For now, let’s grab a steak!
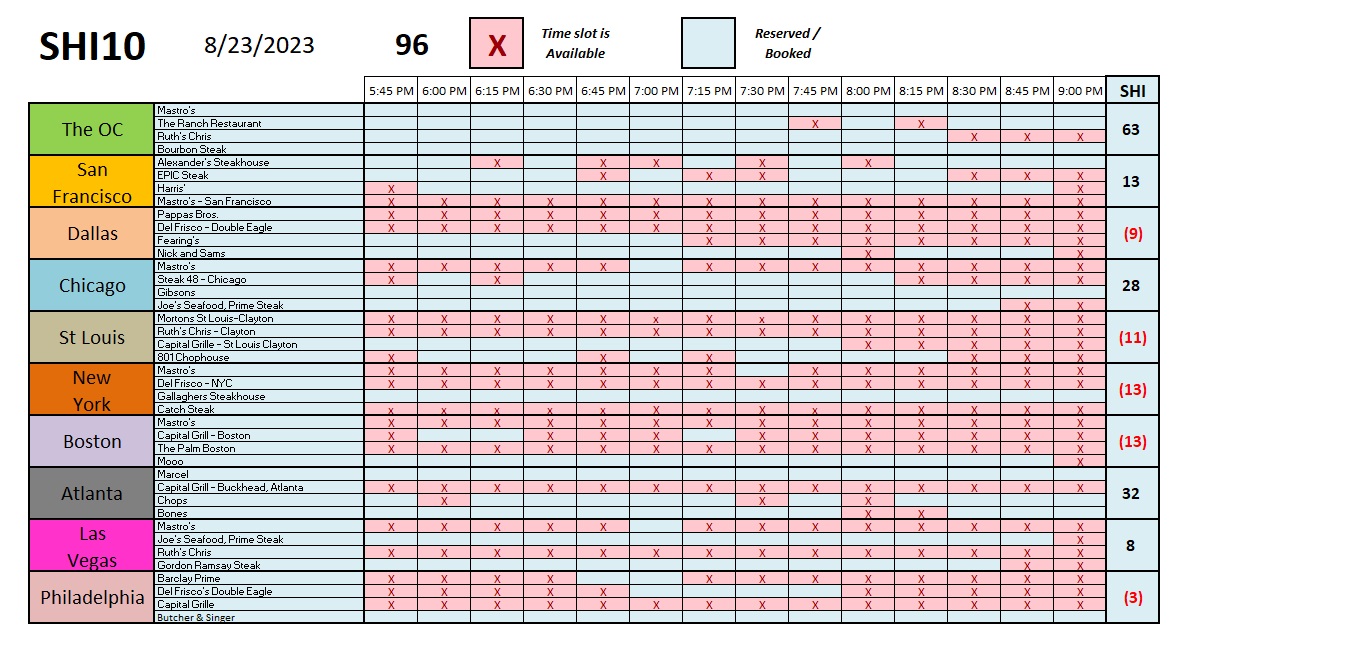
Not much change from last week … once again, the SHI10 is showing fairly consistent demand for our 40 opulent eateries across the US. ‘Mooo‘ in Boston remains booked, the entire city St Louis remains an embarrassment for steakhouse owners, and the OC remains a beacon of light for chickens everywhere.
Here’s the longer term trend chart:
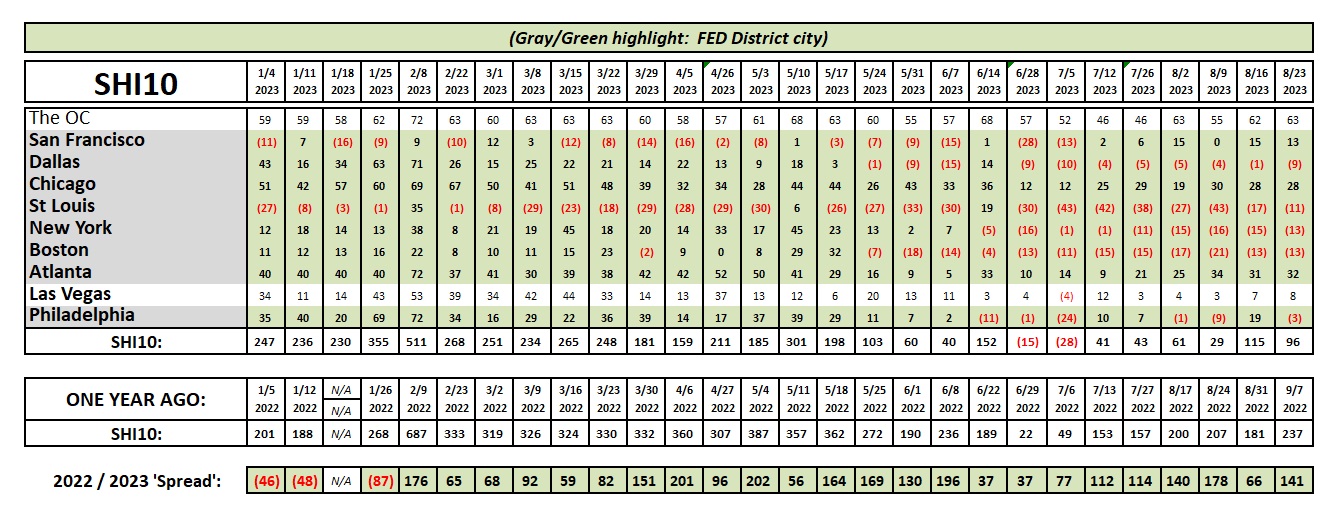
As I said above … consistent. Reservation demand in Philly seems to have fallen off a cliff the past week, but that could simply be a one-week aberration. We’ll see. All in all, very little change.
I’ll summarize with these comments. The overall US economy is exceptionally big and complex with many, many moving parts. Of late, public companies in the business of selling “stuff” to the consumer have been selling off in the stock markets, ostensibly due to the “experts” pronouncement that the consumer is over-stretched and consumer spending is either down or soon to be falling. I don’t buy it. (Yes, that’s a pun.) The consumer is fine. According to official reports from the BEA, consumer spending was up 0.5% in June, following a 0.2% increase in May, a 0.6% increase in April, and a 0.1% increase in March. The operative word here is increase. Sure, many of the ‘retailers’ are struggling, but they, too, may have simply fallen to a more normalized plateau — much like expensive steak houses reservations.
No. The consumer is doing fine. We’re simply seeing more post-pandemic turbulence in a far more expensive consumption marketplace. Those prices, frankly, are one thing I don’t expect to change much. Car prices will eventually recede a bit as supply pressures weight on demand, but in general, I believe prices, too, have generally achieved a new — but much higher — plateau.
We won’t see the ‘advanced estimate’ of Q3 GDP until October 26th … so we have a long wait. Until then, we’ll have to rely on the SHI10 for our forecasts. Here’s the beef, baby!
🙂


