
SHI 9.6.23 – Reading the Signs

SHI 8.23.23 – Defying Gravity
August 23, 2023
SHI 9.13.23 — Charge It!
September 13, 2023
There is no doubt in my mind: The US economy is slowing.
Slowing, of course, is a relative statement – not, in itself, indicative. A plane slows as it approaches a landing strip. A driver slows their vehicle as he or she exits the freeway. The FED slows the frequency of rate hikes as they approach the end of their tightening cycle. In all the preceding cases, slowing is a good thing.
“
Is a slowing US economy a good thing?“
“Is a slowing US economy a good thing?“
Yes. It is. Think of it this way: Imagine you are speeding – say doing 90 mph in a 65 zone. Far up ahead, parked on the side of the freeway, you think you see a cop with a radar gun. What do you do? You slow down. Avoiding a speeding ticket is always smart. If possible. ?
Notwithstanding what the naysayers have been saying, the US economy has been “speeding” for a couple of years. The FED has been handing out “rate hikes” instead of tickets for well over a year now, trying to slow it down. I am convinced they have finally done the trick. I believe the US economy is perceivably slowing … and now, it’s time for the FED to put away the ticket book. I believe they have done so.
Welcome to this week’s Steak House Index update.
If you are new to my blog, or you need a refresher on the SHI10, or its objective and methodology, I suggest you open and read the original BLOG: https://www.steakhouseindex.com/move-over-big-mac-index-here-comes-the-steak-house-index/
Why You Should Care: The US economy and US dollar are the bedrock of the world’s economy.
But is the US economy expanding or contracting?
Expanding … FED rate increases notwithstanding! At the end of Q2, 2023, in ‘current-dollar‘ terms, US annual economic output rose to an annualized rate of $26.84 trillion. After enduring the fastest FED rate hike in over 40 years, America’s current-dollar GDP still increased at an annualized rate of 4.7% during the second quarter of 2023. Even the ‘real’ GDP growth rate was strong … clocking in at the annual rate of 2.4% during Q2. No wonder the FED is concerned.
The world’s annual GDP first grew to over $100 trillion in 2022. According to the IMF, in June of this year, current-dollar global GDP eclipsed $105 trillion! IMF forecasts call for global GDP to reach almost $135 trillion by 2028 — an increase of more than 28% in just 5 years.
America’s GDP remains around 25% of all global GDP. Collectively, the US, the European Common Market, and China generate about 70% of the global economic output. These are the 3 big, global players. They bear close scrutiny.
The objective of this blog is singular.
It attempts to predict the direction of our GDP ahead of official economic releases. Historically, ‘personal consumption expenditures,’ or PCE, has been the largest component of US GDP growth — typically about 2/3 of all GDP growth. In fact, the majority of all GDP increases (or declines) usually results from (increases or decreases in) consumer spending. Consumer spending is clearly a critical financial metric. In all likelihood, the most important financial metric. The Steak House Index focuses right here … on the “consumer spending” metric. I intend the SHI10 is to be predictive, anticipating where the economy is going – not where it’s been.
Taking action: Keep up with this weekly BLOG update. Not only will we cover the SHI and SHI10, but we’ll explore “fun” items of economic importance. Hopefully you find the discussion fun, too.
If the SHI10 index moves appreciably -– either showing massive improvement or significant declines –- indicating growing economic strength or a potential recession, we’ll discuss possible actions at that time.
The Blog:
Earlier this week, I went out to breakfast at a local cafe.
I ordered an omelet and a cup of coffee. The bill came to just under $26. Pre-covid, that meal cost me about $16. In just 4 years, my breakfast cost had jumped about 60%. Cat food (covered previously) and omelets, folks – prices are way up.
Sure, as I said a few blogs ago, this is prima facie inflation. But it is also indicative of a robust, heated economy. The Atlanta FED GDPNow forecast is further testament to that heat. Their most recent reading, dated September 1st, suggests our GDP is still super-heated, forecasting Q3 ‘real’ GDP will roll in at 5.6%. I continue to believe they are vastly overestimating the case, but let’s take a closer look at the basis of their forecast.
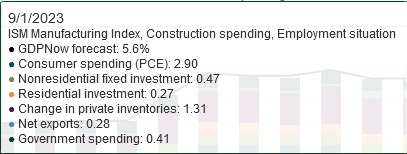
Repeating, on 9/1/23 the GDPNow forecast for Q3 GDP was 5.6%. Remember: This is an annualized ‘run rate’ and it measures ‘real’ GDP – a number which is always lower than the current-dollar, or nominal, GDP figure. So, to repeat, the ‘current-dollar’ figure will be higher!
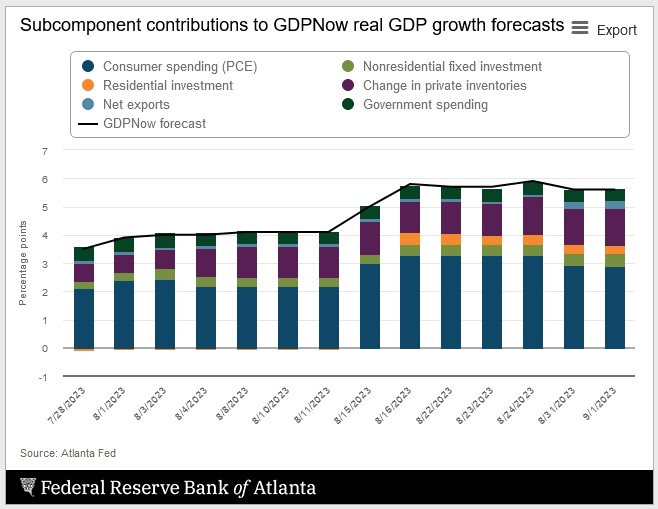
The ‘GDPNow forecast’ figure above shows the individual sub-component contributions to the total. Consumer spending at 2.9%, as we would expect, makes up the largest portion. Increasing inventories is in the second slot. Third is ‘nonresidential fixed investment’ at .47%.
Thru the sub-component lens, it’s easy to see why the forecast is so robust. Stacked on top of each other, that’s how the 5.6% GDP forecast is realized:
But here’s my 2-cents. I think consumer spending is definitely slowing more than the metrics currently suggest. The SHI10 agrees. And I feel the same way about inventories. ISM manufacturing numbers suggest inventory build-ups are reversing.
The most recent “jobs report” and JOLTS report agree. Federal statistics suggest the unemployment rate kicked up to 3.8% — during August, the number of unemployed increased by 514,000 people. That’s a lot. That 514 thousand people who lost their jobs in the past 30 days will be buying less ”stuff” in September.
The number of job openings peaked at over 12 million in March of 2022:
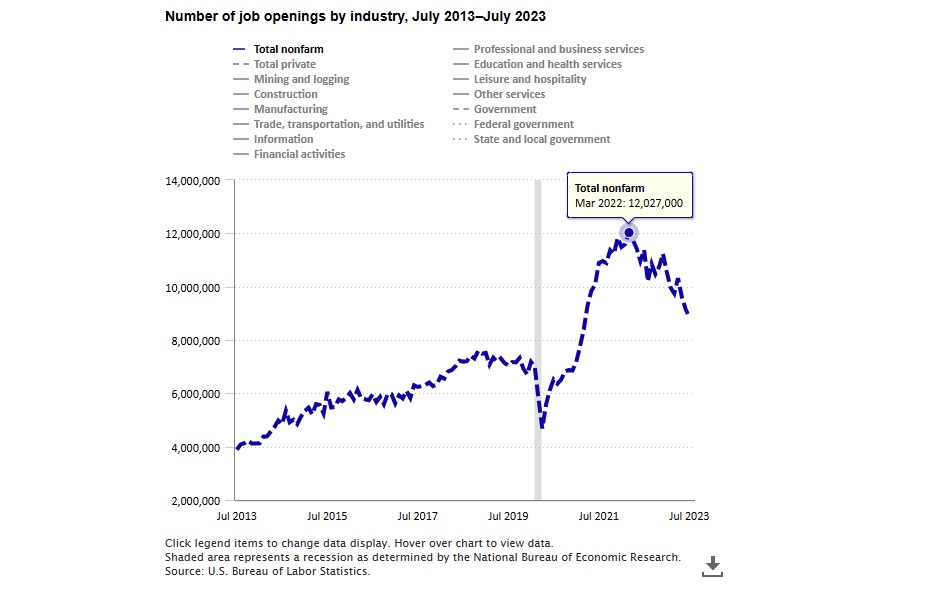
In July, that number fell to just over 8.8 million. By historic standards, that is still a very high number. But it is also far below the 2022 high-water mark – the frenzy and froth are gone.
On the other hand, I think all the recent federal regulation and money supporting microprocessor and infrastructure development will keep nonresidential fixed investment on a high flame for years to come.
Taken all together, I feel the data suggests the US economy has slowed from about 90 mph to about 55.
The slowing is likely a good thing. An overheated economy is unsustainable, and almost as bad as an economic contraction. In this environment, supply and demand come into balance and pricing pressures ease. This is where I believe we are today. 55 is a nice speed! We’re chugging along nicely.
The Steak House Index has always been an ‘alternative’ economic metric, relying on non-traditional data highly correlated with consumer spending to predict the direction of the US economy. While the SHI uses high-dollar steakhouses because of their unique clientele, the restaurant group, in the aggregate also serve as an alternative economic metric to judge the health of the consumer. The ‘S&P 1500 Restaurants Sub-Industry Index’ is an excellent lens thru which to track restaurant performance over time. Here is a 1-year chart of this financial index:
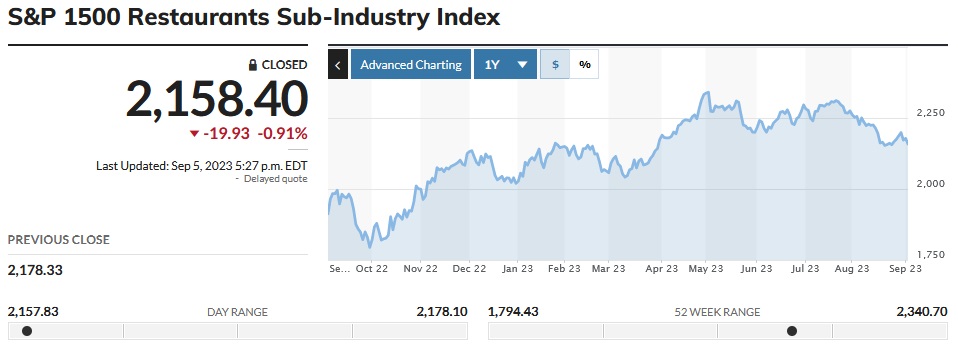
On May 2nd of this year, the value of this index peaked at $2,340. In today’s trading, it closed at $2,158 – 8.4% below the peak.
Stock market performance, in itself, tells us little about consumer spending. However, what it does tell us is how millions of sharp investing capitalists around the world view the health of the consumer. As we see above, the restaurant index is trading down more than 8% from it’s May 2nd peak, but many other publicly traded restaurant companies are faring much worse since their individual highs earlier this year:
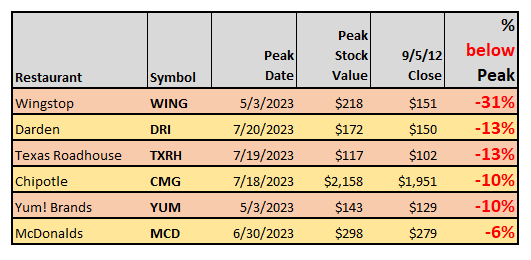
The stock values of lower-cost (yes, subjective, I know) fast food brands appear to have peaked first – in early May. The values of the somewhat more ‘mid-market’ brands then appeared to peaked a bit later, for some reason, in late June/early July. Only the McDonald’s stock price has held up better than the index – the others have performed worse, with the WING stock price down more than 31% from its May peak.
What does this tell us? Simply that across the globe, sophisticated public stock investors feel the consumer has become more tapped out as time passes. Sophisticated investors, in the aggregate, must feel the consumer is not happy with restaurant price increases. They must feel the consumer will be unable to spending as they have over the past few years given elevated price levels and eroding financial strength. Remember: While much of the federal pandemic financial stimulus is still sloshing around the economy, the two (2) lowest income quartiles have likely spent much of their windfall, and have now turned to credit cards. These are real headwinds to consumer spending … and sophisticated investors are telling us the headwinds are blowing stronger.
You remember my $26 omelet and cup of coffee? That elevated cost makes a home-cooked scramble and a 50 cent Keurig pod much more appetizing. ?
Let’s see what the steakhouses are saying this week.
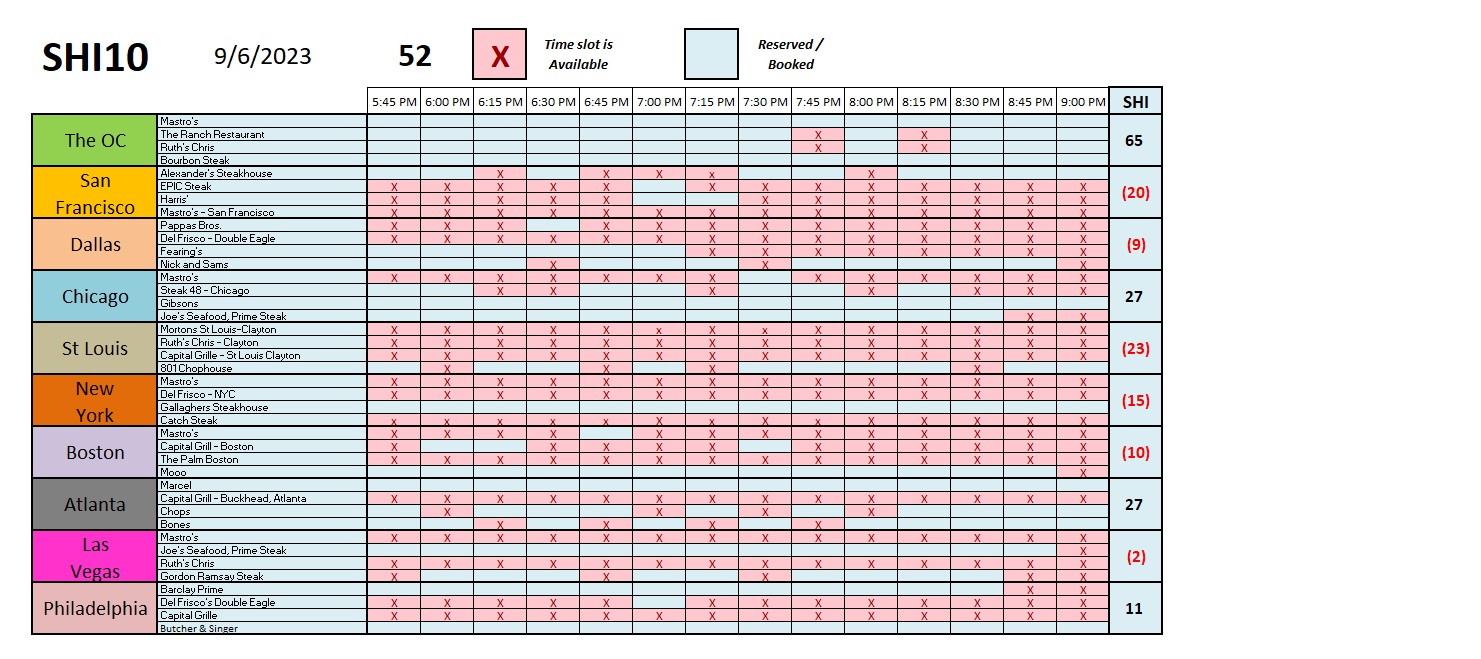
Hmmm. That’s not very good. Reservation demand is noticeably weaker in the majority of markets this week. Here’s the longer term trend chart:
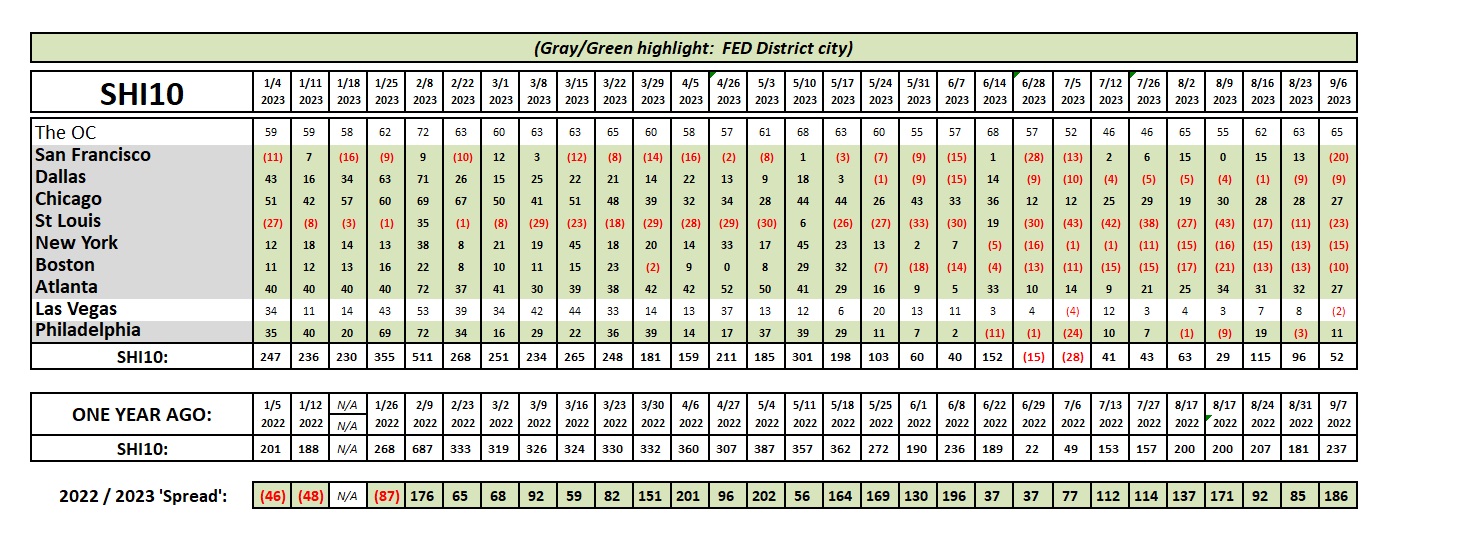
The SHI10 is down and the ‘spread’ is up. This outcome agrees with everything I’m seeing … and correlates well with the global investor attitude about publicly traded restaurant stocks.
The FED ‘Beige Book’ for the most recent quarter was released today. Here are their comments under “Overall Economic Activity” across the United States:
“Contacts from most Districts indicated economic growth was modest during July and August. Consumer spending on tourism was stronger than expected, surging during what most contacts considered the last stage of pent-up demand for leisure travel from the pandemic era. But other retail spending continued to slow, especially on non-essential items. Some Districts highlighted reports suggesting consumers may have exhausted their savings and are relying more on borrowing to support spending. New (manufacturing) orders were stable or declined in most Districts, and backlogs shortened as demand for manufactured goods waned.
One sector where supply did not become more available was single-family housing. Nearly all Districts reported the inventory of homes for sale remained constrained. Accordingly, new construction activity picked up for single-family housing. But multiple Districts noted that construction of affordable housing units was increasingly challenged by higher financing costs and rising insurance premiums. Bankers from different Districts had mixed experiences with growth in loan demand. Most indicated that consumer loan balances rose, and some Districts reported higher delinquencies on consumer credit lines.”
All in all, the data supports my contention that the US Economy is slowing to a more sustainable growth rate. The FED rate hikes have done the trick and I predict we will see no more hikes during this cycle. Consistent, sustainable growth is what the country needs … and — fingers crossed — we just might be there.
<.:.> Terry Liebman


